Microstructural effects of phase transformations Marek Faryna
|
|
|
- Julius Watts
- 5 years ago
- Views:
Transcription
1 Microstructural effects of phase transformations Marek Faryna Institute of Metallurgy and Materials Science mobile
2 Outline Transformation in solids Formal theories of transformation Nucleation Growth Description of overall transformation Transformation to stable phases Isothermal transformations in steel Spinodal decomposition Transformation to transition phases Precipitation reactions Martensitic reactions
3 Literature 1. A.G.Guy INTRODUCTION TO MATERIALS SCIENCE McGraw-Hill Donald R.Askeland, Pradeep P. Phule THE SCIENCE AND ENGINEERING OF MATERIALS, Thomson Canada Limited 2006
4 Nucleation an introduction The transformation of materials by diffusional mechanisms can be divided into two processes, nucleation and growth. In the solidification of metals, depending on temperature and the geometry of the mold, either one or the other will be dominant or a balance between the processes can be achieved. If the nucleation rate is high - the average grain size will be small. If the growth rate is high relative to the nucleation rate - the average grain size will be large. When there is a balance between the processes the grain size will be intermediate. By controlling the nucleation and growth rates the desired grain size can be obtained. By controlling grain size mechanical properties can be controlled.
5 Homogeneous and heterogeneous nucleation In either case a nucleus of a minimum size (critical radius) must be formed before it will be thermodynamically stable. There is a change in energy required to form the interface between the nucleus and the liquid phase as well as a change associated with the replacement of the volume of the liquid with that of the nucleus phase. In the case of heterogeneous nucleation some of the interface between the liquid and mold is removed which reduces the amount of energy required and the critical radius.
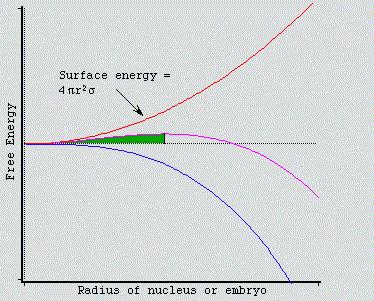
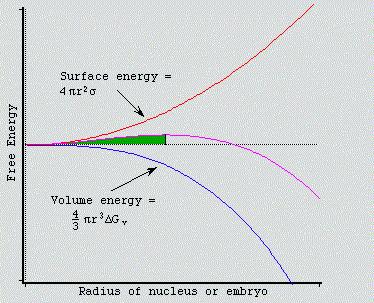
6 Nucleus To form a nucleus in an undercooled liquid, an interface between the liquid and the solid must be created. Due to boundary mismatch this requires additional energy, the surface energy 4 r 2 which is proportional to the surface area (for a sphere) of the nucleus. The change in structure (liquid to solid) provides energy due to the lower energy of the atom arrangement in the solid. This change in energy, the volume energy is proportional to the volume (for a sphere) of the nucleus. The sum of these energies is the free energy associated with the formation of a nucleus. 4 3 r 3 G v

7
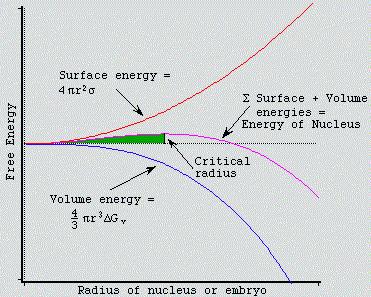
8 G r 4 3 r 3 G v 4 r 2 (1) where: ΔG r the total change in free energy for radius r r radius of nuclei ΔG v is the change in volume free energy per unit volume for the liquid to solid transformation (ΔG v < 0) γ is the surface free energy per unit area associated with the formation of the solid-liquid interface (γ>0) There is a radius at which ΔG r has a maximum, so called the critical radius. A nucleus with a radius smaller than the critical radius will tend to shrink to lower the energy, while the one with a radius larger than the critical radius will tend to grow.
9 Homogeneous and heterogeneous nucleation In either case a nucleus of a minimum size (critical radius) must be formed before it will be thermodynamically stable. There is a change in energy required to form the interface between the nucleus and the liquid phase as well as a change associated with the replacement of the volume of the liquid with that of the nucleus phase. In the case of heterogeneous nucleation some of the interface between the liquid and mold is removed which reduces the amount of energy required and the critical radius.
10 Homogeneous nucleation In an undercooled liquid, atoms begin to form large clusters that act as nuclei for the growth of grains. The spatially random nucleation is termed Homogeneous Nucleation. The greater the degree of undercooling ΔT, the smaller the critical radius of the nucleus. Below the equilibrium melting/freezing point, the solid arrangement of atoms becomes energetically more stable than the liquid arrangement. The more the system is undercooled, the greater this difference. Consequently, as the system is cooled, arranging a smaller number of atoms into the solid lattice produces a greater improvement in energy to overcome the energy penalty of the interface at the boundary between liquid and solid. When a nucleus grows to the critical point, energy can be reduced by growing larger (the nucleus is stable) so that homogeneous nucleation occurs.
11 G r 4 3 r 3 G v 4 r 2 (1) A very small nucleus is called an embryo. The radius of the embryo at which the free energy change associated with its formation reaches a maximum is the critical radius r*. At this point it can reduce its overall energy by continuing to grow. The critical radius for a spherical nucleus is obtained by setting the derivative of the total free energy with respect to the radius equal to zero. dg dr 0 (2) r * 2 G V (3) 32 3 G 48 3 G 16 3 G W V V V (4)
12 (6) T H S (5) S T H S T H E L E L S E S (7) S T H G (10) T) ( T H G (9) T) (T T H G (8) T H T H G E E E E
13 G H T E (T E T) (9) r * 2 G V (3) r * 2 T H(T E E T) 2 T E H T (10) where: T E is the melting temperature of the solid (absolute temperature) ΔT = T E T is the undercooling of the liquid at temperature T ΔH is the latent heat of fusion for the liquid to solid transformation W work needed to create a critical nucleus 16 T 3 2 * E W H (TE T) V (11)

14 Heterogeneous nucleation Impurity particles suspended in a liquid, or roughness on the walls of the container, can assume a radius of curvature greater than that of the critical radius. Atoms can then be "fooled" into forming around this dummy nucleus. This process is known as heterogeneous nucleation and requires much less undercooling because there is no need to form such a large nucleus.
15 ΔG is proportional to ΔT The free energy changes are dependent on temperature
16 Transformation of Fe into Fe r r * * H(T 2 E T E T ) ( ) H( ) 2 H 297 r * ( ) H( ) 2 H 85 r r * 910 * V V * 910 *

17 Finally, when the mismatch strain is too great, a discontinuous, or incoherent, interface forms between the precipitate and the host lattice which relieves the strain. The formation of precipitates in a solid lattice begins with a few atoms arranging themselves in a new atomic arrangement but maintaining coherence with the surrounding lattice. As this new precipitate particle grows, it strains the host lattice (the matrix). This distortion blocks dislocation motion on nearby planes and makes the effect of the precipitate much larger than its actual size.
18 Growth Is effected by the movement of the interface between the nucleus and the liquid as atoms are added to the structure of the solid and can take on many forms including planar and dendritic. The type of growth will affect the final microstructure of the material which in turn will affect the properties of the material.
19 Phase transformation Diffusional Temperature and time Examples: pearlite into austenite pearlite into bainite tempering ageing Diffussionless Diffusion does not play any role Example Martensitic transformation Intermediate transformation Example: Bainitic transformation


20 Phase transformation in Cobalt Allotropic diffusional transformation Cobalt β: FCC high temperature phase Temperature of allotropic transformation 417 C Cobalt α: low temperature phase HCP EBSD

")

![and [111]](/docs-images/89/98934975/images/21-3.jpg "β for Co")

21 -Co b-co α -Co (HPC) β -Co (FCC) Zone axes [0001] α and [111] β for Co are parallel
22 Phases in Fe Fe 3 C Phase Diagram α-ferrite - solid solution of C in BCC Fe Stable form of iron at room temperature. The maximum solubility of C is wt% Transforms to FCC γ-austenite at 912 C γ-austenite - solid solution of C in FCC Fe The maximum solubility of C is 2.14 wt %. Transforms to BCC δ-ferrite at 1395 C Is not stable below the eutectic temperature (727 C) unless cooled rapidly δ-ferrite solid solution of C in BCC Fe The same structure as α-ferrite Stable only at high T, above 1394 C Melts at 1538 C Fe 3 C (iron carbide or cementite) This intermetallic compound is metastable, it remains as a compound indefinitely at room T, but decomposes
23 C is an interstitial impurity in Fe. It forms a solid solution withα, γ, δ phases of iron Maximum solubility in BCC α-ferrite is limited (max wt% at 727 C) - BCC has relatively small interstitial positions Maximum solubility in FCC austenite is 2.14 wt% at 1147 C - FCC has larger interstitial positions Mechanical properties: Cementite is very hard and brittle can strengthen steels. Mechanical properties of steel depend on the microstructure, that is, how ferrite and cementite are mixed. Magnetic properties: α -ferrite is magnetic below 768 C, austenite is non-magnetic
 ferromagnetic properties, above Curie temp. paramagnetic properties, hardness: 80 HB Ferritic steel with non-ferrous inclusions")
24 Ferrite - solid solution of C in Fe with a very low concentration of carbon up to 0.02%. Its properties are similar to pure Fe, b.c.c., number of atoms in unit cell 2; up to Curie temp.(770 o C) ferromagnetic properties, above Curie temp. paramagnetic properties, hardness: 80 HB Ferritic steel with non-ferrous inclusions


25 Ferrite (bright areas) Pearlite (dark areas) Their fraction depends on carbon concentration in alloy

26 Austenite Austenite - solid solution of C in Fe, max. up to do 2.11%. Characteristic twin boundaries because low stacking fault energy, f.c.c., numer of atoms in cubic cel 4; hardness: 200 HB.

27 CSL 3
28
29 Three types of ferrous alloys: 1. Iron: less than wt % C in α ferrite at room T 2. Steels: wt % C (usually < 1 wt %) α-ferrite + Fe 3 C at room T Examples of tool steel (machine tools for cutting other metals): Fe + 1wt % C + 2 wt% Cr Fe + 1 wt% C + 5 wt% W + 6 wt % Mo Stainless steel (food processing equipment, knives, petrochemical equipment, etc.): wt% Cr, Cast iron: wt % (usually < 4.5 wt %)
30 Steels versus irons Steels contain much lower levels of carbon than cast irons do. Steels have carbon concentrations less than about 2% (depending on what other alloying elements are also present), so that it is possible to dissolve all of the carbon in the FCC lattice (γ or austenite). Subsequent heat treatment controls the form of the carbides that are produced, which in turn, produce the high strength of steels. The high temperatures needed to melt these low-carbon alloys, and the difficulty of removing the carbon and other impurities from the ores, prevented true steels from being made before the mid-19 th century.
31 Hypoeutectoids and Hypereutectoids Steels that contain more than 0.77% C are called hypereutectoid, and steels that contain less than 0.77% C are hypoeutectoid (hyper = above, hypo = below).


32 Cooling of ferritic steel Final products: ferrite and Fe 3 C III


33 Cooling of hypoeutectoid steel In hypoeutectoid steels, as the alloy cools, ferrite, the primary microconstituent, begins to form at the grain boundaries of the austenite. Ferrite continues to grow until the eutectoid temperature is reached. At the eutectoid temperature the remaining austenite undergoes the eutectoid reaction (note the thermal hold while this takes place) and transforms into pearlite. +pearlite +Fe 3 C Final structure contains the continuous proeutectoid microconstituent, ferrite, surrounding islands of pearlite. These steels are ductile because the primary ferrite can be deformed.


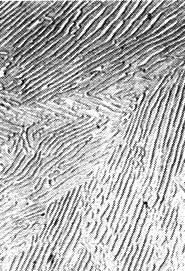
34 Hypoeutectoid steel structure The continuous white phase that forms along prior austenite grain boundaries is ferrite alpha and the lamellar pearlite consisting of alternating plates of alpha and Fe 3 C is dark with the individual platelets sometimes visible. A coarser austenite grain size affects the scale of the transformed microstructure. The details of the pearlite lamellar can be seen at higher magnification with an electron microscope. Ferrite and pearlite Pearlite colonies
.")
35 Cooling of hypereutectoid steel Hypereutectoid steels transform in the same way except that cementite is the primary microconstituent. This is a hard, brittle phase, so the mechanical properties of hypereutectoid steels are very different (they are used, for example, in ball bearings). Final products: pearlite, Fe 3 C II and small amount of Fe 3 C III.

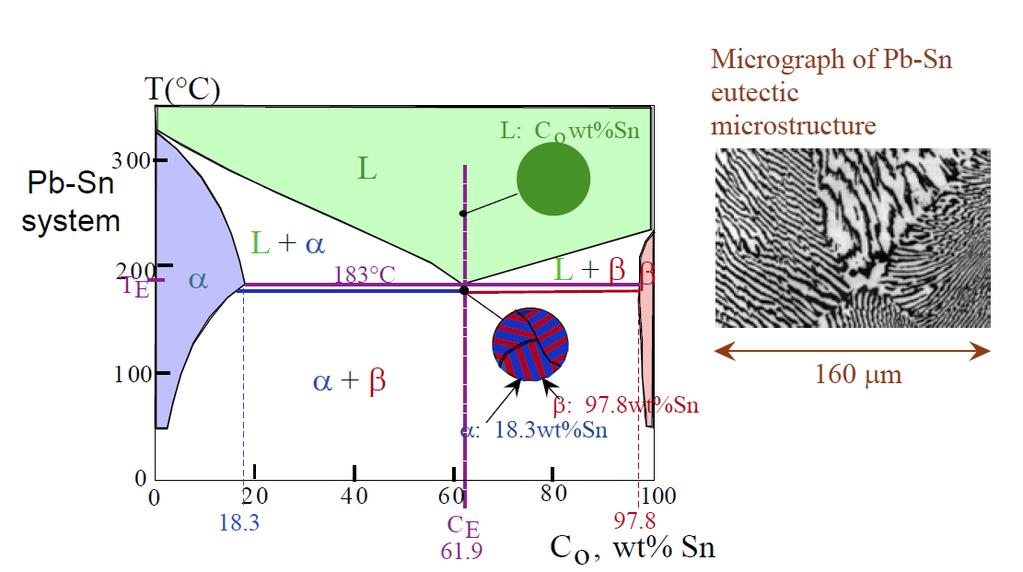
36 The melting point of the eutectic alloy is lower than that of the components (eutectic = easy to melt in Greek) The word eutectic is also used to describe the microstructure that is most characteristic of the process. The temperature and diffusion rates control the plate thickness. Lower temperatures produce finer plates and generally a stronger and tougher structure. Eutectic Transformation The lamellar eutectic is quite strong but not very ductile, e.g. lead-tin alloys near the eutectic composition are used as plumber's solder because the joints require strength but not ductility.
, while the surface provides a site for heterogeneous nucleation of the second phase (Pb).")
37 Upon cooling, two phases are formed. The first phase (e.g. Sn) is rich in one component and pushes away atoms of the second component (e.g. Pb) that do not fit into its crystal structure. This enriches the composition of the liquid near the growing first phase (Sn), while the surface provides a site for heterogeneous nucleation of the second phase (Pb). This phase then grows and pushes out the first component (Sn), producing another enrichment of the liquid that favours nucleation of more of the first phase (Sn), and so on. The result is the growth of lamellae or plates.
38 Temperature Temperature Binary alloy with no solubility Composition Binary alloy with limited solubility α is solid A with small amount of solid B dissolved in it β is solid B with small amount of solid A dissolved in it Components have different solid solubilities Composition

39 The development of microstructures during cooling is simulated for alloys hypoeutectic composition.
40 Eutectic (occurs at eutectic temperature) Line of three-phase equilibrium Limit of solid solubility Solidus (between solid and liquid and solid solution) Solvus (between single solid solution and mixture of solid solutions) Liquidus first solid appears on cooling Eutectic Line line of 3 phase equilibrium Invariant Point where 2 liquidus lines and eutectic line meet
 (atom percent) alloy: niobium (light phase) dispersed in Nb3Si (grey")

41 Eutectic microstructure of a Nb (81.8%) Si (18.2%) (atom percent) alloy: niobium (light phase) dispersed in Nb3Si (grey phase). Photograph: A. Bachelier, ONERA High magnification view of the eutectic microstructure in a Nb (81.8%) Si (18.2%) alloy (Nb is the light phase, Nb3Si is the dark phase).
42 Eutectic composition

43 Hypoeutectic composition

44 Hypoeutectic and Hypereutectic
45 Eutectoid Reactions The eutectoid (eutectic-like in Greek) reaction is similar to the eutectic reaction but occurs from one solid phase to two new solid phases. Eutectoid structures are similar to eutectic structures but are much finer in scale (diffusion is much slower in the solid state). Upon cooling, a solid phase transforms into two other solid phases (δ γ + ε in the example below) Cu-Zn
46 Eutectic and Eutectoid Reactions
47 Peritectic and Peritectoid Reactions A peritectic reaction - solid phase and liquid phase will together form a second solid phase at a particular temperature and composition upon cooling L + α β These reactions are rather slow as the product phase will form at the boundary between the two reacting phases thus separating them, and slowing down any further reaction. Peritectoid reaction is a three-phase reaction similar to peritectic but occurs from two solid phases to one new solid phase (α + β = γ).
 is cooled slowly it forms pearlite, a lamellar or layered structure of two phases: α-ferrite and cementite")
 and cementite (6.7 wt%) by diffusion.")
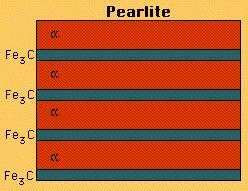
48 When alloy of eutectoid composition (0.77 wt % C) is cooled slowly it forms pearlite, a lamellar or layered structure of two phases: α-ferrite and cementite (Fe3C) The layers of alternating phases in pearlite are formed for the same reason as layered structure of eutectic structures: redistribution C atoms between ferrite (0.022 wt%) and cementite (6.7 wt%) by diffusion. Mechanically, pearlite has properties intermediate to soft, ductile ferrite and hard, brittle cementite.

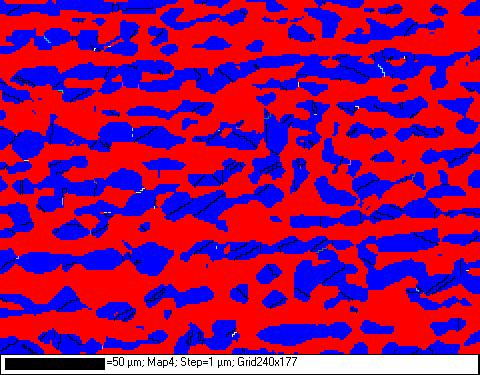
49 Red phase austenite Yellow phase ferrite Black lines HAGB White lines - LAGB

50 Illustrations of the transformation of austenite to pearlite

51 austenite pearlite austenite pearlite
52 Time-Temperature Transformation Cooling below the equilibrium temperature is required for the transformation to begin. The amount of undercooling controls the time, the rates of nucleation and growth, and the final microstructure. These can be predicted by using the T-T-T diagram (time-temperaturetransformation). The diagram is valid only for isothermal holds (horizontal lines) and rapid temperature changes (vertical lines).
53 TTT Diagrams (Time-Temperature-Transformation) The lower the temperature of transformation, the finer the resulting microstructure because diffusion is slower, and the distance that atoms can move in order to form the new phases is shorter. This is true in comparing pearlite to bainite to martensite and also in terms of the trend from coarse pearlite to fine pearlite and from coarse bainite to fine bainite.
54 A variety of different cooling paths may be taken in order to produce combinations of pearlite, martensite and bainite. It is important to remember that once either pearlite or bainite has formed, these structures are stable and will not change unless the specimen is again heated above 727 C. This means that if only a fraction of austenite transforms to pearlite and the alloy is once again rapidly cooled, none of the already formed pearlite will be affected.
55 Pearlite is formed if austenite is quenched to a temperature above 550 C. Because diffusion is rapid, temperatures closer to the 727 C equilibrium temperature will produce a coarse pearlite. Temperatures closer to about 550 C will produce a fine pearlite because diffusion is slower. When austenite is cooled past the "knee" of the curve (~220 C to ~550 C), a different microstructure is produced, in order to reduce the amount of surface area between the α and Fe 3 C phases. This type of microstructure is called bainite. Just as in pearlite, the bainite that forms at higher temperatures is coarser than the bainite that forms at lower temperatures.

56
57 BAINITE A mixture of supersaturated ferrite Fe, cementite Fe 3 C and carbide Fe 2.4 C with 8.4 wt% C found in incompletely hardened steels, produced when austenite is transformed at temperatures between the pearlite and martensite ranges. Bainite is harder than pearlite and contains needlelike grain structures, and it requires an initial rapid cooling followed by gradual cooling.

58 Between about 500 and 350 C initial nuclei are ferrite which is coherent with the austenite matrix. Cementite then precipitates from the carbon-enriched layer of austenite, allowing further growth of the ferrite. The carbides tend to lie parallel to the long axis of the bainite needle to form the typical open feathery structure of upper bainite. Below 350 C coherent ferrite, supersaturated with carbon, forms first and is then followed by the precipitation of carbide within the ferrite needle, transversely at an angle of 55. A proportion of the carbide is Fe 2,4 C and the ferrite contains a little dissolved carbon. This lower bainite structure is somewhat similar to lightly tempered martensite.


59 Upper bainite 550 o C o C Feathery structure Retained austenite


60 Lower bainite 350 o C - M s
 During martensitic transformation, even")

61 retained austenite (white areas between martensite (needles), and some cementite (arrows) During martensitic transformation, even at absolute temperature, all austenite does not transform into martensite. Some austenite always remains, known as retained austenite

62 Volume of martisite (%) Retained austenite Specific volume of martensite is ca 3% higher than specific volume of austenite! Temperature ( o C)
63 The amount of retained austenite increases with the C concentration in steel. The amount of retained austenite increases with Mn, Cr and Ni concentration in steel. The amount of retained austenite decreases with Co concentration in steel.
64 Spinodal decomposition Spinodal decomposition is a process by which a mixture of two materials can separate into distinct regions with different material concentrations. [This differs from nucleation in that spinodal phase separation occurs throughout the material, not just at nucleation sites.]
 is signalled by a common tangent of the thermodynamic potential.")
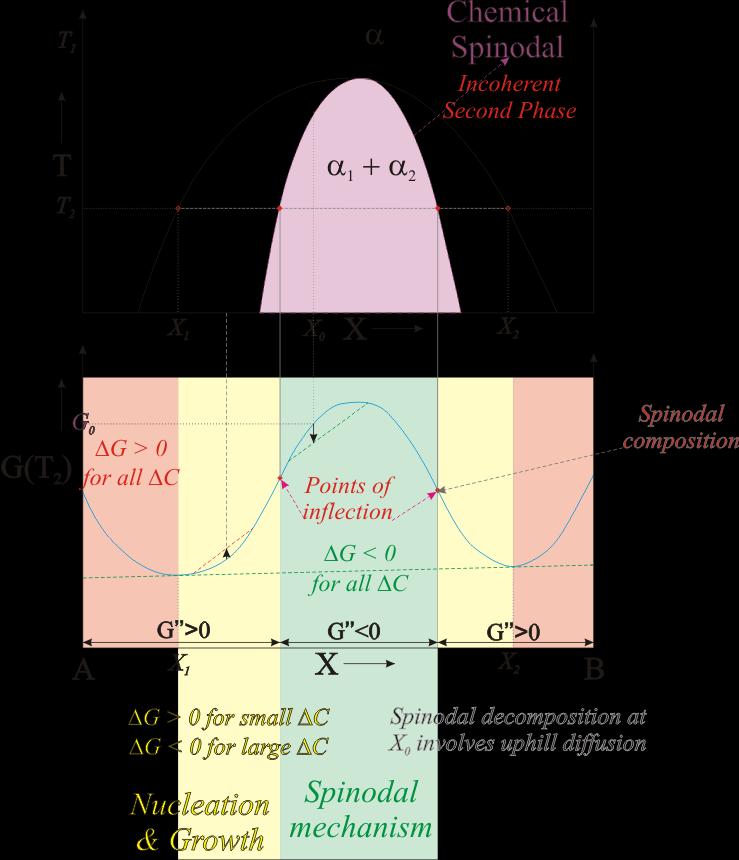
65 Phase separation may occur whenever a material finds itself in the thermodynamically unstable region of the phase diagram. The boundary of this unstable region (the binodal) is signalled by a common tangent of the thermodynamic potential. Inside the binodal boundary, the spinodal region is entered when the curvature of the potential turns negative. The binodal and spinodal meet at the critical point. It is when a material is brought into the spinodal phase region that spinodal decomposition can occur.
66 To reach the spinodal region of the phase diagram, the system must be brought through the binodal region where nucleation may occur. For spinodal decomposition to be realized, a very fast transition (a quench) is required to evolve the system from the stable region through the meta-stable nucleation region and well into the mechanically unstable spinodal phase region. In the spinodal phase region, the thermodynamics favours spontaneous separation of the components. But large regions will change their concentrations only slowly due to the amount of material that must be moved, and small regions will shrink away due to the energy cost of the interface between the two different component materials. Thus domains of a characteristic spinodal length scale will be favoured and since the growth is exponential, such domain sizes will come to dominate the morphology in the course of the associated spinodal time.
67 Spinodal decomposition Spinodal decomposition is a mechanism for the rapid unmixing of a mixture of liquids or solids from one phase, to form two coexisting phases. An example: a mixture of dodecane (CH 3 (CH 2 ) 10 CH 3, an oily liquid of the paraffin series) and ethanol. Above 13 o C dodecane and ethanol form a single thermodynamic completely miscible phase. The mixture is then cooled to a temperature at which at thermodynamic equilibrium favors an dodecane-rich phase coexisting with a ethanol-rich phase.
68 Spinodal decomposition occurs when the mixture is such that there is no barrier to nucleation. The dodecane and ethanol molecules immediately start to cluster together into microscopic dodecane-rich and ethanol-rich clusters throughout the liquid. These clusters then rapidly grow and coalesce until there is a single macroscopic dodecane-rich cluster (the dodecane-rich phase) and a single ethanol-rich cluster (the ethalol-rich phase)
69 Miscibility Gap It means that, for certain concentrations, two or more constituents don't mix well, but rather the separate phases coexist. Spinodal decomposition Since there is no thermodynamic barrier to the reaction inside of the spinodal region, the decomposition is determined solely by diffusion. Thus, it can be treated purely as a diffusional problem contrary to the nucleation and growth which invoke the thermodynamics of fluctuations.
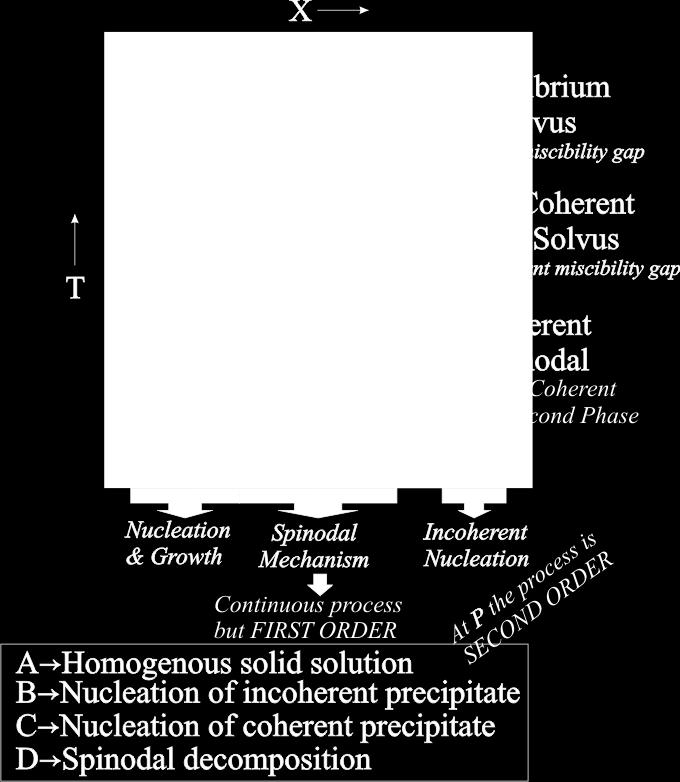
70 Phase diagrams showing miscibility gap correspond to solid solutions which exhibit clustering tendency Within the miscibility gap the decomposition can take place by either Nucleation and Growth Spinodal Mechanism If the second phase is not coherent with the parent then the region of the spinodal is called the chemical spinodal If the second phase is coherent with the parent phase then the spinodal mechanism is operative only inside the coherent spinodal domain As coherent second phases cost additional strain energy to produce (as compared to a incoherent second phase only interfacial energy involved) this requires additional undercooling for it to occur
71
72
73 Nucleation versus Spinodal decomposition Nucleation and Growth The composition of the second phase remains unaltered with time The interfaces between the nucleating phase and the matrix is sharp There is a marked tendency for random distribution of both sizes and positions of the equilibrium phases Particles of separated phases tend to be spherical with low connectivity Spinodal decomposition A continuous change of composition occurs until the equilibrium values are attained The interface is initially very diffuse but eventually sharpens A regularity- though not simple- exists both in sizes and distribution of phases The separated phases are generally nonspherical and posses a high degree of connectivity Spinodal decomposition provides a means of producing a very finely dispersed microstructure that can significantly enhance the physical properties of the material.

74
 Ideally coherent")
75 a) Supersaturated solid solution b) Ideally coherent precipitation
 5, dark phase: Sm 2")
76 Spinodal decompostion in the Sm-Co-Cu alloy; bright phase: Sm(Co,Cu) 5, dark phase: Sm 2 (Co,Cu) 17
77 Martensitic transformations Martensitic transformations are diffusionless, solid-tosolid phase transitions, and have been observed in metals, alloys and ceramics. They are characterized by a rapid change of crystal structure, accompanied by the development of a rich microstructure. Martensitic transformations can be irreversible, as seen in steels upon quenching, or they can be reversible, such as those observed in shape-memory alloys. In the latter case, the microstructures formed on cooling are easily manipulated by loads and disappear upon reheating.
78 Martensite Formation Martensite is a non-equilibrium phase that forms when the cooling rate is fast enough to avoid the formation of pearlite and bainite. The mechanism is a shear, or diffusionless transformation that does not require motion of atoms by diffusion but only a slight rearrangement of the immediate neighbours. Typically, a lath or plate of the new arrangement begins at an imperfection such as an austenite grain boundary or the surface of another lath, and then propagates across the grain at the speed of sound.

79 Schematic illustration of the surface tilting produced by the formation of plate of martensitic transformation product
 and body centered tetragonal lattice (bcc - related to")
80 Lattice correspondence between face centered cubic lattice (fcc - austenite) and body centered tetragonal lattice (bcc - related to martensite)
81 fcc austenite bcc ferrite Bain deformation A lattice deformation is required to convert the tetragonal lattice with a 3 /a 1 = 2 to the tetragonal lattice of martensite for which the a 3 /a 1 is only The lattice deformation consists of a contraction along x 3 direction and extensions along the x 1 and x 2 (dimensions in ppms). Bain deformation: contraction along [001] up to ca 20 %, extension along [100] and [110] directions up to ca 12%.

82 Orientation relationship between the parent (fcc) and martensite (bcc) phases for the Bain (a), the Nishiyama Wassermann (b) and the Kurdjumov Sachs (c) paths. The blue atoms indicate a bcc unit cell. The red arrows indicate part of the motion initiating the transformation. The dashed arrows indicate the invariant direction which is shared by the parent and martensite phases. Martensite (011) planes are parallel to austenite (111) planes and martensite [11-1] directions are parallel to austenite [10-1] directions

83 Austenite fcc Martensite bcc

84


85 The growth of martensite laths, or plates, starting at grain boundaries in the original grain structure, produces a structure like that shown in these light microscope images. In steel, the "as quenched" structure is very fine and the individual laths are not well defined. After tempering fine carbide particles are present which are themselves, too small to resolve, and the BCC iron structure is more easily etched showing the lath arrangement.
86 Dispersion strengthening Dispersion strengthened alloys are designed to improve the mechanical properties of a material. In a dispersion-strengthened alloy 2 phases are present: 1. a matrix which is usually soft and present in large amounts, 2. a precipitate which is usually hard and present in smaller amounts.


87 There are a few basic guidelines materials engineers use in order to predict the behaviour of the relationship between the matrix and precipitate 1. The matrix should be soft in order to provide some ductility to the alloy. The precipitate should be hard in order to give strength to the alloy. By increasing the amount of precipitate, we can increase the strength. 2. The precipitate should be discontinuous or cracks could propagate through the entire structure. A crack in a discontinuous precipitate will be stopped by the matrix. A good alloy should have a soft ductile matrix with hard precipitates


88 3. Smaller, more numerous precipitate particles are preferred because they increase the chances of interfering with slip.

89 4. Round particles are better than needle-like ones; needle-like particles are more likely to initiate a crack. Round particles are less likely to initiate a crack and cause a catastrophe
90 Age or Precipitation Hardening Precipitation hardening produces a fine, hard, uniformly dispersed, coherent precipitate in a soft, ductile matrix. There are three main steps to this agehardening heat treatment. The term age hardening is sometimes reserved for the case where step 3 occurs at room temperature.

91 Step 1: Solution Treatment The alloy is heated just above the solvus temperature until a homogeneous alpha phase is produced. This step will dissolve any other phases present.

92 Step 2: Quench Now the alloy is rapidly cooled or quenched, not allowing the precipitate to form, and produces a supersaturated solid solution. This is not an equilibrium structure.

93 Step 3: Aging The supersaturated alloy is now heated again below the solvus line to allow the excess atoms to diffuse to numerous nucleation sites in order to form a fine and well dispersed precipitate of the phase.
94 Precipitation hardening Guinier-Preston Zones The formation of precipitates in a solid lattice begins with a few atoms arranging themselves in a new atomic arrangement but maintaining coherence with the surrounding lattice. As this new precipitate particle grows, it strains the host lattice. This distortion blocks dislocation motion on nearby planes and makes the effect of the precipitate much larger than its actual size. Finally, when the mismatch strain is too great, a discontinuous, or incoherent, interface forms between the precipitate and the host lattice which relieves the strain. GP zone Non coherent


95 Precipitation hardening Guinier-Preston zones in Mg-Gd-Zn alloys

96 Precipitation hardening Precipitation and Yield Strength The final strength of a precipitation-hardened alloy depends on the temperature and time for which it was aged. If an alloy is aged for too long or at an extremely high temperature, the strength may decrease because the precipitates grow too large, become incoherent, and are too few in number. A moderate temperature is preferred over a high one, for the maximum strength increases as the aging temperature decreases. More precipitate will be formed at the lower temperature. Also, the properties are much more uniform throughout the alloy if a moderate temperature is used. Using a high aging temperature may cause the outside of the alloy to "burn" while the inside will remain cool. If too low a temperature is used, then the aging time may be too great (i.e., 10,000 hours) for practical treatment. A graph shows how the time and temperature will affect the strength of the alloy. The horizontal (time) axis is logarithmic.
97 Precipitation hardening a) If there is no relationship between phase boundary energy and boundary orientations, precipitation s are spherical b) If there is a relationship between phase boundary energy and boundary orientations, precipitation s are lamellar
98 Precipitation hardening Relationship between grain boundary energy γ GZ and phase boundary energy γ αβ. If γ GZ 2 γ αβ a new phase forms a homogenous layer along grain boundaries. If such a phase is brittle, the whole alloys is brittle too.