January 31, Mr. David M. Heger Senior Counsel AES US Services, LLC One Monument Circle, Suite 701A Indianapolis, Indiana
|
|
|
- Ernest Fox
- 5 years ago
- Views:
Transcription
1 January 31, 2018 Mr. David M. Heger Senior Counsel AES US Services, LLC One Monument Circle, Suite 701A Indianapolis, Indiana ATC Group Services LLC 7988 Centerpoint Dr. Suite 100 Indianapolis, IN Phone Fax Re: CCR Annual Groundwater Monitoring and Corrective Action Report Indianapolis Power & Light Company Petersburg Generating Station Ash Pond System Dear Mr. Heger: ATC Group Services LLC (ATC) has prepared this 2017 CCR Annual Groundwater Monitoring and Corrective Action Report for the ash pond system at Indianapolis Power & Light Company s (IPL) Petersburg Generating Station located outside Petersburg, Pike County, Indiana. This report has been prepared to comply with reporting requirements described in the United States Environmental Protection Agency s (USEPA) Coal Combustion Residuals (CCR) Rule (e). This annual report documents the status of the groundwater monitoring and corrective action program for the ash pond system and summarizes information required by (e)(1) through (e)(5). Federal CCR Rule (e) specifies the following: For existing CCR landfills and existing CCR surface impoundments, no later than January 31, 2018, and annually thereafter, the owner or operator must prepare an annual groundwater monitoring and corrective action report. For new CCR landfills, new CCR surface impoundments, and all lateral expansions of CCR units, the owner or operator must prepare the initial annual groundwater monitoring and corrective action report no later than January 31 of the year following the calendar year a groundwater monitoring system has been established for such CCR unit as required by this subpart, and annually thereafter. For the preceding calendar year, the annual report must document the status of the groundwater monitoring and corrective action program for the
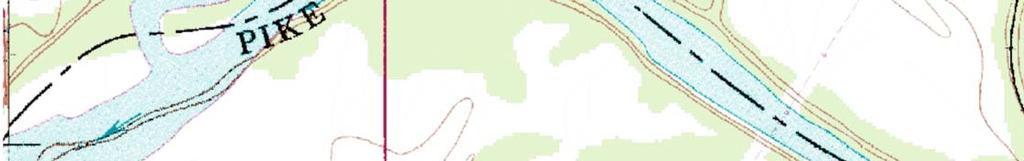
2 Petersburg Generating Station Ash Pond System Pike County, Indiana CCR Annual Groundwater Monitoring and Corrective Action Report CCR unit, summarize key actions completed, describe any problems encountered, discuss actions to resolve the problems, and project key activities for the upcoming year. For purposes of this section, the owner or operator has prepared the annual report when the report is placed in the facility s operating record as required by (h)(1). The following key actions have been completed to comply with the CCR Rule: In accordance with (b)(1)(i), IPL installed a groundwater monitoring system as required by In accordance with (b)(1)(ii), IPL developed the groundwater sampling and analysis program to include the selection of the statistical procedures to be used for evaluating groundwater monitoring data as required by In accordance with (b)(1)(iii), IPL initiated a detection monitoring program to obtain a minimum of eight samples from each background and downgradient well as required by (b). In accordance with (f), IPL provided the groundwater monitoring system certification. In accordance with (f)(6), IPL provided the certification that the selected statistical method is appropriate for evaluating the groundwater monitoring data for the CCR management area. To report on the activities conducted during the prior calendar year and document compliance with the CCR Rule, the specific requirements listed in (e)(1) through (e)(5) are provided below in bold/italic type followed by a short narrative addressing how that specific requirement has been met. At a minimum, the annual groundwater monitoring and corrective action report must contain the following information, to the extent available: (e)(1) A map, aerial image, or diagram showing the CCR unit and all background (or upgradient) and downgradient monitoring wells, to include the well identification numbers, that are part of the groundwater monitoring program for the CCR unit; IPL operates the Petersburg Station located approximately four miles north of. It is located at 6925 North State Road 57,. A Site Location Map is provided as Figure 1. A map showing the location of each CCR management unit and associated upgradient and downgradient monitoring wells is provided as Figure 2. This information was previously presented in the Indianapolis Power & Light Company Petersburg Generating Station Ash Pond System Closure & Post-Closure Plan, dated August 4, The Ash Pond System Closure & Post-Closure Plan was approved in a December 31, 2014 IDEM letter (e)(2) Identification of any monitoring wells that were installed or decommissioned during the preceding year, along with a narrative description of why those actions were taken; January 31, 2018 ATC Group Services LLC 2
3 Petersburg Generating Station Ash Pond System Pike County, Indiana CCR Annual Groundwater Monitoring and Corrective Action Report Because this is the first CCR annual report, relevant activities conducted prior to and during 2017 are summarized below. The CCR groundwater monitoring system at the Petersburg Ash Pond System consists of seventeen (17) monitoring wells; three (3) upgradient wells MW-2R, MW-3, and MW-4C and fourteen (14) downgradient monitoring wells; AP-1R, AP-2A, AP-2BO, AP-3, AP-3A, AP-4A, AP-4B, AP-4I, AP-5, AP-5A, AP-6A, AP-6B, AP-7, and AP-8. Nested groundwater monitoring wells are installed in five (5) downgradient locations (AP-2A/B, AP-3/3A, AP-4A/I/B, AP-5/5A, and AP-6A/B). The wells were installed between 1986 and 2017 and are installed in unconsolidated deposits overlying bedrock. The location of the CCR monitoring well network is depicted on Figure 2. Documentation of the design and construction of the monitoring well network for the CCR ash pond system management units at the Petersburg Station is included in the Indianapolis Power & Light Company Petersburg Generating Station Ash Pond System Closure & Post-Closure Plan, dated August 4, In April 2016, monitoring well AP-1 was abandoned and replaced with AP-1R. Documentation of the well abandonment/installation was provided in the Monitoring Well AP-1R Installation and Abandonment of Monitoring Well AP-1 Report dated May 19, Additionally, monitoring well AP-2BO was installed in April 2016 as part of an ongoing arsenic investigation in the vicinity of AP-2A and AP-2B. Documentation of the well installation was provided in the Monitoring Well AP-2BO Installation Report dated May 19, (e)(3) In addition to all the monitoring data obtained under through , a summary including the number of groundwater samples that were collected for analysis for each background and downgradient well, the dates the samples were collected, and whether the sample was required by the detection monitoring or assessment monitoring programs; In accordance with (b), a minimum of eight independent samples from each background and downgradient monitoring well were collected prior to October 17, Each of the sampling events completed through 2017 were part of the detection monitoring program. Table 1 provides a summary of the number of samples collected at each well, sampling dates, and designation of whether samples were required by the detection or assessment monitoring program. Groundwater analytical results for samples collected during 2016 and 2017 are summarized in Tables 2 through (e)(4) A narrative discussion of any transition between monitoring programs (e.g., the date and circumstances for transitioning from detection monitoring to assessment monitoring in addition to identifying the constituent(s) detected at a statistically significant increase over background levels); Consistent with (e), the 2017 annual report documents activities conducted during the prior calendar year at the CCR management units subject to the Rule. The statistical analysis of the initial minimum eight rounds of groundwater sampling was not completed in 2017 and therefore is not reported in this Annual Report. A narrative discussion of any transition between monitoring programs (e.g., the date and circumstances for transitioning from detection monitoring to assessment monitoring January 31, 2018 ATC Group Services LLC 3
4 Petersburg Generating Station Ash Pond System Pike County, Indiana CCR Annual Groundwater Monitoring and Corrective Action Report in addition to identifying the constituent(s) detected at a statistically significant increase over background levels) will be provided, as appropriate, in subsequent annual reports (e)(5) Other information required to be included in the annual report as specified in through Other information required to be included in this report will be provided, as appropriate, in subsequent annual reports. We appreciate the opportunity to assist with IPL s CCR Rule groundwater monitoring program at Petersburg Station s ash pond system. Please contact any of the undersigned at if you have any questions regarding this report. Sincerely, Slawa Bruder Project Geologist Mark E. Breting, L.P.G. Senior Project Geologist John R. Noel, L.P.G. Principal Geologist Copies: Mr. Thom O Leary Mr. Juan Hummel Erwin Leidolf Wil Teague January 31, 2018 ATC Group Services LLC 4
5 TABLES Table 1: Well Sampling Summary Table 2: Summary of Monitoring Results September 2016 Table 3: Summary of Monitoring Results October 2016 Table 4: Summary of Monitoring Results November 2016 Table 5: Summary of Monitoring Results December 2016 Table 6: Summary of Monitoring Results February 2017 Table 7: Summary of Monitoring Results March 16, 2017 Table 8: Summary of Monitoring Results March 17, 2017 Table 9: Summary of Monitoring Results March 23-25, 2017 Table 10: Summary of Monitoring Results April 20, 2017 Table 11: Summary of Monitoring Results April 24, 2017 Table 12: Summary of Monitoring Results May 2017 Table 13: Summary of Monitoring Results June 2017 Table 14: Summary of Monitoring Results August 2017
6 Table 1 Well Sampling Summary Ash Pond System - Ash Ponds A, A', and C Indianapolis Power Light Company Petersburg Generating Station, Identification Date Installed Upgradient, Background, or Downgradient Number of Samples Sample Date or Assessment Monitoring MW-2 (2R) MW-3 MW-4C Deep and Shallow Monitoring Well Network - Upgradient Wells 9/28/ /19/ /9/ /12/2016 3/16/2017 MW /17/2017 MW-2R - 2/1/ /29/1992 AP-3A 5/13/2015 Upgradient Upgradient Upgradient Downgradient 9 3/24/2017 4/20/2017 4/24/2017 5/16/2017 6/20/2017 8/8/2017 9/28/ /19/ /9/ /12/2016 2/5/2017 3/24/2017 5/25/2017 6/20/2017 8/8/2017 9/28/ /19/ /9/ /12/2016 2/5/2017 3/25/2017 5/25/2017 6/20/2017 8/8/2017 Deep Monitoring Well Network - Downgradient Monitoring Wells AP-2A 6/11/2014 Downgradient 9 AP-4A 6/16/2014 Downgradient /28/ /19/ /9/ /12/2016 2/5/2017 3/24/2017 5/24/2017 6/21/2017 8/10/2017 9/28/ /18/ /8/ /13/2016 2/4/2017 3/23/2017 5/24/2017 6/21/2017 8/9/2017 9/29/ /18/ /8/ /13/2016 2/4/2017 3/23/2017 5/24/2017 6/21/2017 8/9/2017 Page 1 of 3
7 Table 1 Well Sampling Summary Ash Pond System - Ash Ponds A, A', and C Indianapolis Power Light Company Petersburg Generating Station, Identification Date Installed Upgradient, Background, or Downgradient Number of Samples Sample Date or Assessment Monitoring AP-5A AP-6A 5/12/2015 6/17/2014 Downgradient Downgradient 9 9 9/29/ /18/ /8/ /13/2016 2/4/2017 3/23/2017 5/23/2017 6/21/2017 8/9/2017 9/29/ /18/ /8/ /13/2016 2/4/2017 3/23/2017 5/23/2017 6/21/2017 8/9/2017 AP-1R* AP-2BO AP-3 AP-4B AP-4I Shallow Monitoring Well Network - Downgradient Monitoring Wells 4/5/2016 Downgradient 9 4/5/2016 Downgradient 9 6/9/2014 Downgradient 9 6/17/2014 Downgradient 6/16/2014 Downgradient 9 9 9/28/ /19/ /9/ /12/2016 2/5/2017 3/24/2017 5/16/2017 6/22/2017 8/10/2017 9/28/ /19/ /9/ /12/2016 2/5/2017 3/24/2017 5/24/2017 6/22/2017 8/9/2017 9/28/ /18/ /8/ /13/2016 2/4/2017 3/23/2017 5/24/2017 6/21/2017 8/9/2017 9/29/ /18/ /8/ /13/2016 2/4/2017 3/23/2017 5/24/2017 6/21/2017 8/9/2017 9/29/ /18/ /8/ /13/2016 2/4/2017 3/23/2017 5/24/2017 6/21/2017 8/9/2017 Page 2 of 3
8 Table 1 Well Sampling Summary Ash Pond System - Ash Ponds A, A', and C Indianapolis Power Light Company Petersburg Generating Station, Identification Date Installed Upgradient, Background, or Downgradient Number of Samples Sample Date or Assessment Monitoring AP-5 6/17/2014 Downgradient 9 AP-6B 6/18/2014 Downgradient 9 AP-7 6/10/2014 Downgradient 9 AP-8 6/10/2014 Downgradient 9 9/29/ /18/ /8/ /13/2016 2/4/2017 3/23/2017 5/23/2017 6/21/2017 8/9/2017 9/29/ /18/ /8/ /13/2016 2/4/2017 3/23/2017 5/23/2017 6/21/2017 8/9/2017 9/28/ /19/ /9/ /12/2016 2/5/2017 3/25/2017 5/24/2017 6/21/2017 8/8/2017 9/28/ /19/ /9/ /12/2016 2/5/2017 3/25/2017 5/24/2017 6/20/2017 8/8/2017 * Monitoring well AP-1R is also labeled as AP-1AR in the 2016 laboratory reports. Page 3 of 3
9 Table 2 Summary of Monitoring Results - September 2016 AP-1AR AP-2A AP-2BO AP-3 AP-3A AP-4A AP-4B AP-4I AP-5 AP-5A AP-6A AP-6B AP-7 AP-8 MW-2 MW-3 MW-4C /09/ /09/ /09/ /09/ /09/ /09/ /09/ /09/ /09/ /09/ /09/ /09/ /09/ /09/ /09/ /09/ /09/2016 Static Water Elevation (ft MSL) Temperature, Field C Dissolved Oxygen, Field mg/l Conductivity, Field µs/cm ORP, Field mv ph, Field SU Antimony, Total mg/l < < < < < < < < < < < < < < < < < Arsenic, Total mg/l < < < < < < < < < < < < < < < < Barium, Total mg/l Beryllium, Total mg/l <0.010 <0.010 <0.010 <0.010 <0.010 <0.010 <0.010 <0.010 <0.010 <0.010 <0.010 <0.010 <0.010 <0.010 <0.010 <0.010 <0.010 Boron, Total mg/l < Cadmium, Total mg/l <0.010 <0.010 <0.010 <0.010 <0.010 <0.010 <0.010 <0.010 <0.010 <0.010 <0.010 <0.010 < <0.010 <0.010 <0.010 Calcium, Total mg/l Chromium, Total mg/l <0.010 <0.010 <0.010 <0.010 <0.010 <0.010 <0.010 <0.010 <0.010 <0.010 <0.010 <0.010 <0.010 <0.010 <0.010 <0.010 <0.010 Cobalt, Total mg/l <0.020 <0.020 <0.020 <0.020 <0.020 <0.020 <0.020 <0.020 <0.020 <0.020 <0.020 <0.020 < <0.020 <0.020 <0.020 Lead, Total mg/l <0.010 <0.010 <0.010 <0.010 <0.010 <0.010 <0.010 <0.010 <0.010 <0.010 <0.010 <0.010 <0.010 <0.010 <0.010 <0.010 <0.010 Lithium, Total mg/l < <0.10 <0.10 <0.10 <0.10 <0.10 <0.10 <0.10 <0.10 <0.10 <0.10 <0.10 < Mercury, Total mg/l < < < < < < < < < < < < < < < < < Molybdenum, Total mg/l < < < <0.10 <0.10 <0.10 <0.10 < <0.10 Selenium, Total mg/l <0.020 <0.020 <0.020 <0.020 <0.020 <0.020 <0.020 <0.020 <0.020 <0.020 <0.020 <0.020 <0.020 <0.020 <0.020 <0.020 <0.020 Thallium, Total mg/l <0.050 <0.050 <0.050 <0.050 <0.050 <0.050 <0.050 <0.050 <0.050 <0.050 <0.050 <0.050 <0.050 <0.050 <0.050 <0.050 <0.050 Radium-Combined pci/l Chloride mg/l Fluoride mg/l <0.50 <0.50 <0.50 <0.50 <0.50 <0.50 <0.50 <0.50 <0.50 <0.50 <0.50 <0.50 < <0.50 <0.50 <0.50 ph SU Solids, Dissolved mg/l Sulfate mg/l Note: Static water elevation listed for a well may have been collected on a date different than date of well sampling.
10 Table 3 Summary of Monitoring Results - October 2016 AP-1AR AP-2A AP-2BO AP-3 AP-3A AP-4A AP-4B AP-4I AP-5 AP-5A AP-6A AP-6B AP-7 AP-8 MW-2 MW-3 MW-4C /10/ /10/ /10/ /10/ /10/ /10/ /10/ /10/ /10/ /10/ /10/ /10/ /10/ /10/ /10/ /10/ /10/2016 Static Water Elevation (ft MSL) Temperature, Field C Dissolved Oxygen, Field mg/l Conductivity, Field µs/cm ORP, Field mv ph, Field SU Antimony, Total mg/l < < < < < < < < < < < < < < < < < Arsenic, Total mg/l <0.010 <0.010 <0.010 <0.010 <0.010 <0.010 <0.010 <0.010 <0.010 <0.010 <0.010 <0.010 < <0.010 <0.010 <0.010 Barium, Total mg/l Beryllium, Total mg/l <0.010 <0.010 <0.010 <0.010 <0.010 <0.010 <0.010 <0.010 <0.010 <0.010 <0.010 <0.010 <0.010 <0.010 <0.010 <0.010 <0.010 Boron, Total mg/l < Cadmium, Total mg/l <0.010 <0.010 <0.010 <0.010 <0.010 <0.010 <0.010 <0.010 <0.010 <0.010 <0.010 <0.010 < <0.010 <0.010 <0.010 Calcium, Total mg/l Chromium, Total mg/l <0.010 <0.010 <0.010 <0.010 <0.010 <0.010 <0.010 <0.010 <0.010 <0.010 <0.010 <0.010 <0.010 <0.010 <0.010 <0.010 <0.010 Cobalt, Total mg/l <0.020 <0.020 <0.020 <0.020 <0.020 <0.020 <0.020 <0.020 <0.020 <0.020 <0.020 <0.020 < <0.020 <0.020 <0.020 Lead, Total mg/l <0.010 <0.010 <0.010 <0.010 <0.010 <0.010 <0.010 <0.010 <0.010 <0.010 <0.010 <0.010 < <0.010 <0.010 <0.010 Lithium, Total mg/l < <0.10 <0.10 <0.10 <0.10 <0.10 <0.10 <0.10 <0.10 <0.10 <0.10 <0.10 < Mercury, Total mg/l < < < < < < < < < < < < < < < < < Molybdenum, Total mg/l < < < <0.10 <0.10 <0.10 <0.10 < <0.10 Selenium, Total mg/l <0.010 <0.010 <0.010 <0.010 <0.010 < <0.010 <0.010 <0.010 <0.010 <0.010 <0.010 <0.010 <0.010 <0.010 <0.010 Thallium, Total mg/l <0.050 <0.050 <0.050 <0.050 <0.050 <0.050 <0.050 <0.050 <0.050 <0.050 <0.050 <0.050 <0.050 <0.050 <0.050 <0.050 <0.050 Radium-Combined pci/l Chloride mg/l < Fluoride mg/l <5.0 <5.0 <5.0 <5.0 <5.0 <5.0 <5.0 <5.0 <5.0 <5.0 <5.0 <5.0 <5.0 <5.0 <5.0 <5.0 <5.0 ph SU Solids, Dissolved mg/l Sulfate mg/l Note: Static water elevation listed for a well may have been collected on a date different than date of well sampling.
11 Table 4 Summary of Monitoring Results - November 2016 AP-1R AP-2A AP-2BO AP-3 AP-3A AP-4A AP-4B AP-4I AP-5 AP-5A AP-6A AP-6B AP-7 AP-8 MW-2 MW-3 MW-4C /11/ /11/ /11/ /11/ /11/ /11/ /11/ /11/ /11/ /11/ /11/ /11/ /11/ /11/ /11/ /11/ /11/2016 Static Water Elevation (ft MSL) Temperature, Field C NA NA Dissolved Oxygen, Field mg/l 1.08 NA NA Conductivity, Field µs/cm NA NA ORP, Field mv NA NA ph, Field SU 7.07 NA NA Antimony, Total mg/l < < < < < < < < < < < < < < < < < Arsenic, Total mg/l <0.020 <0.020 <0.020 <0.020 <0.020 <0.020 <0.020 <0.020 <0.020 <0.020 <0.020 <0.020 <0.020 <0.020 <0.020 <0.020 <0.020 Barium, Total mg/l Beryllium, Total mg/l <0.010 <0.010 <0.010 <0.010 <0.010 <0.010 <0.010 <0.010 <0.010 <0.010 <0.010 <0.010 <0.010 <0.010 <0.010 <0.010 <0.010 Boron, Total mg/l < Cadmium, Total mg/l <0.010 <0.010 <0.010 <0.010 <0.010 <0.010 <0.010 <0.010 <0.010 <0.010 <0.010 <0.010 < <0.010 <0.010 <0.010 Calcium, Total mg/l Chromium, Total mg/l <0.010 <0.010 <0.010 <0.010 <0.010 <0.010 <0.010 <0.010 <0.010 <0.010 <0.010 <0.010 <0.010 <0.010 <0.010 <0.010 <0.010 Cobalt, Total mg/l <0.020 <0.020 <0.020 <0.020 <0.020 <0.020 <0.020 <0.020 <0.020 <0.020 <0.020 <0.020 < <0.020 <0.020 <0.020 Lead, Total mg/l <0.010 <0.010 <0.010 <0.010 <0.010 <0.010 <0.010 < <0.010 <0.010 < <0.010 <0.010 <0.010 Lithium, Total mg/l < <0.10 <0.10 <0.10 <0.10 <0.10 <0.10 <0.10 <0.10 <0.10 <0.10 <0.10 < Mercury, Total mg/l < < < < < < < < < < < < < < < < < Molybdenum, Total mg/l < < < <0.10 <0.10 <0.10 <0.10 < <0.10 Selenium, Total mg/l <0.020 <0.020 <0.020 <0.020 <0.020 <0.020 <0.020 <0.020 <0.020 <0.020 <0.020 <0.020 <0.020 <0.020 <0.020 <0.020 <0.020 Thallium, Total mg/l <0.050 <0.050 <0.050 <0.050 <0.050 <0.050 <0.050 <0.050 <0.050 <0.050 <0.050 <0.050 <0.050 <0.050 <0.050 <0.050 <0.050 Radium-Combined pci/l < < <0.56 < < < Chloride mg/l Fluoride mg/l <0.50 <0.50 <0.50 <0.50 <0.50 <0.50 <0.50 <0.50 <0.50 <0.50 <0.50 <0.50 < <0.50 <0.50 <0.50 ph SU Solids, Dissolved mg/l Sulfate mg/l Note: Static water elevation listed for a well may have been collected on a date different than date of well sampling. NA: Not Available.
12 Table 5 Summary of Monitoring Results - December 2016 AP-1AR AP-2A AP-2BO AP-3 AP-3A AP-4A AP-4B AP-4I AP-5 AP-5A AP-6A AP-6B AP-7 AP-8 MW-2 MW-3 MW-4C /12/ /12/ /12/ /12/ /12/ /12/ /12/ /12/ /12/ /12/ /12/ /12/ /12/ /12/ /12/ /12/ /12/2016 Static Water Elevation (ft MSL) Temperature, Field C Dissolved Oxygen, Field mg/l Conductivity, Field µs/cm ORP, Field mv ph, Field SU Antimony, Total mg/l < < < < < < < < < < < < < < < < < Arsenic, Total mg/l < < < < < < < < < < < < < < < < < Barium, Total mg/l Beryllium, Total mg/l <0.010 <0.010 <0.010 <0.010 <0.010 <0.010 <0.010 <0.010 <0.010 <0.010 <0.010 <0.010 <0.010 <0.010 <0.010 <0.010 <0.010 Boron, Total mg/l < Cadmium, Total mg/l <0.010 <0.010 <0.010 <0.010 <0.010 <0.010 <0.010 <0.010 <0.010 <0.010 <0.010 <0.010 < <0.010 <0.010 <0.010 Calcium, Total mg/l Chromium, Total mg/l <0.010 <0.010 <0.010 <0.010 <0.010 <0.010 <0.010 <0.010 <0.010 <0.010 <0.010 <0.010 <0.010 <0.010 <0.010 <0.010 <0.010 Cobalt, Total mg/l <0.020 <0.020 <0.020 <0.020 <0.020 <0.020 <0.020 <0.020 <0.020 <0.020 <0.020 <0.020 < <0.020 <0.020 <0.020 Lead, Total mg/l <0.010 <0.010 <0.010 <0.010 <0.010 <0.010 <0.010 <0.010 <0.010 <0.010 <0.010 <0.010 <0.010 <0.010 <0.010 <0.010 <0.010 Lithium, Total mg/l < <0.10 <0.10 <0.10 <0.10 <0.10 <0.10 <0.10 <0.10 <0.10 <0.10 <0.10 < Mercury, Total mg/l < < < < < < < < < < < < < < < < < Molybdenum, Total mg/l < < < <0.10 <0.10 <0.10 <0.10 < <0.10 Selenium, Total mg/l < < < < < < < < < < < < < < < < Thallium, Total mg/l <0.050 <0.050 <0.050 <0.050 <0.050 <0.050 <0.050 <0.050 <0.050 <0.050 <0.050 <0.050 <0.050 <0.050 <0.050 <0.050 <0.050 Radium-Combined pci/l Chloride mg/l < Fluoride mg/l <5.0 <5.0 <5.0 <5.0 <5.0 <5.0 <5.0 <5.0 <5.0 <5.0 <5.0 <5.0 <5.0 <5.0 <5.0 <5.0 <5.0 ph SU Solids, Dissolved mg/l Sulfate mg/l Note: Static water elevation listed for a well may have been collected on a date different than date of well sampling.
13 Table 6 Summary of Monitoring Results - Febraury 2017 AP-1R AP-2A AP-2BO AP-3 AP-3A AP-4A AP-4B AP-4I AP-5 AP-5A AP-6A AP-6B AP-7 AP-8 MW-3 MW-4C /2/ /2/ /2/ /2/ /2/ /2/ /2/ /2/ /2/ /2/ /2/ /2/ /2/ /2/ /2/ /2/2017 Static Water Elevation (ft MSL) Temperature, Field C Dissolved Oxygen, Field mg/l Conductivity, Field µs/cm ORP, Field mv ph, Field SU Antimony, Total mg/l < < < < < < < < < < < < < < < < Arsenic, Total mg/l <0.010 <0.010 <0.010 <0.010 <0.010 <0.010 <0.010 <0.010 <0.010 <0.010 <0.010 <0.010 <0.010 <0.010 <0.010 <0.010 Barium, Total mg/l Beryllium, Total mg/l < < < < < < < < < < < < < < < < Boron, Total mg/l < Cadmium, Total mg/l < < < < < < < < < < < < < < < Calcium, Total mg/l Chromium, Total mg/l <0.010 <0.010 <0.010 <0.010 <0.010 <0.010 <0.010 <0.010 <0.010 <0.010 <0.010 <0.010 <0.010 <0.010 <0.010 <0.010 Cobalt, Total mg/l <0.020 <0.020 <0.020 <0.020 <0.020 <0.020 <0.020 <0.020 <0.020 <0.020 <0.020 <0.020 < <0.020 <0.020 Lead, Total mg/l <0.010 <0.010 <0.010 <0.010 <0.010 <0.010 <0.010 <0.010 <0.010 <0.010 <0.010 <0.010 <0.010 <0.010 <0.010 <0.010 Lithium, Total mg/l < <0.10 <0.10 <0.10 <0.10 <0.10 <0.10 <0.10 <0.10 <0.10 <0.10 <0.10 < Mercury, Total mg/l < < < < < < < < < < < < < < < < Molybdenum, Total mg/l < < < <0.10 <0.10 <0.10 < <0.10 Selenium, Total mg/l < <0.030 < <0.030 < < <0.030 < <0.030 < < <0.030 <0.030 <0.030 <0.030 Thallium, Total mg/l < < < < < < < < < < < < < < < < Radium-Combined pci/l Chloride mg/l < Fluoride mg/l <5.0 <5.0 <5.0 <5.0 <5.0 <5.0 <5.0 <5.0 <5.0 <5.0 <5.0 <5.0 <5.0 <5.0 <5.0 <5.0 ph SU Solids, Dissolved mg/l Sulfate mg/l Note: Static water elevation listed for a well may have been collected on a date different than date of well sampling.
14 Table 7 Summary of Monitoring Results - March 16, 2017 MW-2R /3/2017 Static Water Elevation (ft MSL) Temperature, Field C Dissolved Oxygen, Field mg/l 0.18 Conductivity, Field µs/cm ORP, Field mv ph, Field SU 6.64 Antimony, Total mg/l <0.020 Arsenic, Total mg/l <0.010 Barium, Total mg/l Beryllium, Total mg/l < Boron, Total mg/l 1.1 Cadmium, Total mg/l < Calcium, Total mg/l 500 Chromium, Total mg/l <0.010 Cobalt, Total mg/l <0.020 Lead, Total mg/l <0.010 Lithium, Total mg/l 0.28 Mercury, Total mg/l < Molybdenum, Total mg/l <0.10 Selenium, Total mg/l < Thallium, Total mg/l < Radium-Combined pci/l <0.55 Chloride mg/l 81 Fluoride mg/l <5.0 ph SU 6.83 Solids, Dissolved mg/l 2400 Sulfate mg/l 990 Note: Static water elevation listed for a well may have been collected on a date different than date of well sampling.
15 Table 8 Summary of Monitoring Results - March 17, 2017 MW-2R /3/2017 Static Water Elevation (ft MSL) Temperature, Field C Dissolved Oxygen, Field mg/l 1.47 Conductivity, Field µs/cm ORP, Field mv ph, Field SU 6.76 Antimony, Total mg/l < Arsenic, Total mg/l <0.010 Barium, Total mg/l Beryllium, Total mg/l < Boron, Total mg/l 1.3 Cadmium, Total mg/l < Calcium, Total mg/l 480 Chromium, Total mg/l <0.010 Cobalt, Total mg/l <0.020 Lead, Total mg/l <0.010 Lithium, Total mg/l 0.41 Mercury, Total mg/l < Molybdenum, Total mg/l <0.10 Selenium, Total mg/l < Thallium, Total mg/l < Radium-Combined pci/l 2.3 Chloride mg/l 83 Fluoride mg/l <5.0 ph SU 6.84 Solids, Dissolved mg/l 2300 Sulfate mg/l 940 Note: Static water elevation listed for a well may have been collected on a date different than date of well sampling.
16 Table 9 Summary of Monitoring Results - March 23-25, 2017 AP-1R AP-2A AP-2BO AP-3 AP-3A AP-4A AP-4B AP-4I AP-5 AP-5A AP-6A AP-6B AP-7 AP-8 MW-2R MW-3 MW-4C /3/ /3/ /3/ /3/ /3/ /3/ /3/ /3/ /3/ /3/ /3/ /3/ /3/ /3/ /3/ /3/ /3/2017 Static Water Elevation (ft MSL) Temperature, Field C NA NA Dissolved Oxygen, Field mg/l NA NA Conductivity, Field µs/cm NA NA ORP, Field mv NA NA ph, Field SU NA NA Antimony, Total mg/l < < < < < < < < < < < < <0.024 <0.024 <0.024 <0.024 <0.024 Arsenic, Total mg/l <0.010 <0.010 <0.010 <0.010 <0.010 <0.010 <0.010 <0.040 <0.040 <0.040 <0.040 <0.040 <0.040 <0.040 <0.040 <0.040 <0.040 Barium, Total mg/l Beryllium, Total mg/l < < < < < < < < < < < < < < < < < Boron, Total mg/l < Cadmium, Total mg/l < < < < < < < < < < < < < < < < Calcium, Total mg/l Chromium, Total mg/l <0.010 <0.010 <0.010 <0.010 <0.010 <0.010 <0.010 <0.010 <0.010 <0.010 <0.010 <0.010 <0.010 <0.010 <0.010 <0.010 Cobalt, Total mg/l <0.020 <0.020 <0.020 <0.020 <0.020 <0.020 <0.020 <0.020 <0.020 <0.020 <0.020 <0.020 < <0.020 <0.020 <0.020 Lead, Total mg/l <0.010 <0.010 <0.010 <0.010 <0.010 <0.010 <0.010 <0.010 <0.010 <0.010 <0.010 <0.010 <0.010 <0.010 <0.010 <0.010 <0.010 Lithium, Total mg/l < <0.10 <0.10 <0.10 <0.10 <0.10 <0.10 <0.10 <0.10 <0.10 <0.10 <0.10 < Mercury, Total mg/l < < < < < < < < < < < < < < < < < Molybdenum, Total mg/l < < < <0.10 <0.10 <0.10 <0.10 < <0.10 Selenium, Total mg/l < < < < < < <0.020 <0.020 <0.020 <0.020 <0.020 <0.020 <0.020 <0.020 <0.020 <0.020 Thallium, Total mg/l < < < < < < < < < < < < < <0.020 <0.020 <0.020 <0.020 Radium-Combined pci/l < <0.6 < < Chloride mg/l < Fluoride mg/l <5.0 <5.0 <5.0 <5.0 <5.0 <5.0 <5.0 <5.0 <5.0 <5.0 <5.0 <5.0 <5.0 <5.0 <5.0 <5.0 <5.0 ph SU Solids, Dissolved mg/l Sulfate mg/l Note: Static water elevation listed for a well may have been collected on a date different than date of well sampling. NA: Not Available.
17 Table 10 Summary of Monitoring Results - April 20, 2017 MW-2R /4/2017 Static Water Elevation (ft MSL) Temperature, Field C 16.6 Dissolved Oxygen, Field mg/l 0.59 Conductivity, Field µs/cm ORP, Field mv ph, Field SU 6.76 Antimony, Total mg/l < Arsenic, Total mg/l <0.010 Barium, Total mg/l Beryllium, Total mg/l < Boron, Total mg/l 1.7 Cadmium, Total mg/l < Calcium, Total mg/l 500 Chromium, Total mg/l <0.010 Cobalt, Total mg/l <0.020 Lead, Total mg/l <0.010 Lithium, Total mg/l 0.78 Mercury, Total mg/l < Molybdenum, Total mg/l <0.10 Selenium, Total mg/l < Thallium, Total mg/l < Radium-Combined pci/l 1.4 Chloride mg/l 86 Fluoride mg/l <5.0 ph SU 6.88 Solids, Dissolved mg/l 2600 Sulfate mg/l 1100 Note: Static water elevation listed for a well may have been collected on a date different than date of well sampling.
18 Table 11 Summary of Monitoring Results - April 24, 2017 MW-2R /4/2017 Static Water Elevation (ft MSL) Temperature, Field C Dissolved Oxygen, Field mg/l 0.28 Conductivity, Field µs/cm ORP, Field mv 89.7 ph, Field SU 6.96 Antimony, Total mg/l < Arsenic, Total mg/l <0.010 Barium, Total mg/l Beryllium, Total mg/l < Boron, Total mg/l 1.6 Cadmium, Total mg/l < Calcium, Total mg/l 560 Chromium, Total mg/l <0.010 Cobalt, Total mg/l <0.020 Lead, Total mg/l <0.010 Lithium, Total mg/l 0.84 Mercury, Total mg/l < Molybdenum, Total mg/l <0.10 Selenium, Total mg/l < Thallium, Total mg/l < Radium-Combined pci/l 1.2 Chloride mg/l 81 Fluoride mg/l <5.0 ph SU 6.91 Solids, Dissolved mg/l 2700 Sulfate mg/l 1100 Note: Static water elevation listed for a well may have been collected on a date different than date of well sampling.
19 Table 12 Summary of Monitoring Results - May 2017 AP-1R AP-2A AP-2BO AP-3 AP-3A AP-4A AP-4B AP-4I AP-5 AP-5A AP-6A AP-6B AP-7 AP-8 MW-2R MW-3 MW-4C /5/ /5/ /5/ /5/ /5/ /5/ /5/ /5/ /5/ /5/ /5/ /5/ /5/ /5/ /5/ /5/ /5/2017 Static Water Elevation (ft MSL) Temperature, Field C NA Dissolved Oxygen, Field mg/l 0.3 NA Conductivity, Field µs/cm NA ORP, Field mv NA ph, Field SU 7.34 NA Antimony, Total mg/l < < < < < < < < < < < < < < < < < Arsenic, Total mg/l <0.010 <0.010 <0.010 <0.010 <0.010 <0.010 <0.010 <0.010 <0.010 <0.010 <0.010 <0.010 <0.010 <0.010 <0.010 <0.010 <0.010 Barium, Total mg/l Beryllium, Total mg/l < < < < < < < < < < < < < < < < < Boron, Total mg/l < Cadmium, Total mg/l < < < < < < < < < < < < < < < < Calcium, Total mg/l Chromium, Total mg/l <0.010 <0.010 <0.010 <0.010 <0.010 <0.010 <0.010 <0.010 <0.010 <0.010 <0.010 <0.010 <0.010 <0.010 <0.010 <0.010 <0.010 Cobalt, Total mg/l <0.020 <0.020 <0.020 <0.020 <0.020 <0.020 <0.020 <0.020 <0.020 <0.020 <0.020 <0.020 < <0.020 <0.020 <0.020 Lead, Total mg/l <0.010 <0.010 <0.010 <0.010 <0.010 <0.010 <0.010 <0.010 <0.010 <0.010 <0.010 <0.010 <0.010 <0.010 <0.010 <0.010 <0.010 Lithium, Total mg/l <0.10 <0.10 <0.10 <0.10 <0.10 <0.10 <0.10 <0.10 <0.10 <0.10 <0.10 <0.10 <0.10 < Mercury, Total mg/l < < < < < < < < < < < < < < < < < Molybdenum, Total mg/l < < < <0.10 <0.10 <0.10 <0.10 < <0.10 Selenium, Total mg/l < < < < < < < < < < < < < < < < Thallium, Total mg/l < < < < < < < < < < < < < < < < < Radium-Combined pci/l 1.4 NA 1.34 < < < < Chloride mg/l < Fluoride mg/l <5.0 <5.0 <5.0 <5.0 <5.0 <5.0 <5.0 <5.0 <5.0 <5.0 <5.0 <5.0 <5.0 <5.0 <5.0 <5.0 <5.0 ph SU Solids, Dissolved mg/l Sulfate mg/l Note: Static water elevation listed for a well may have been collected on a date different than date of well sampling. NA: Not Available.
20 Table 13 Summary of Monitoring Results - June 2017 AP-1R AP-2A AP-2BO AP-3 AP-3A AP-4A AP-4B AP-4I AP-5 AP-5A AP-6A AP-6B AP-7 AP-8 MW-2R MW-3 MW-4C /6/ /6/ /6/ /6/ /6/ /6/ /6/ /6/ /6/ /6/ /6/ /6/ /6/ /6/ /6/ /6/ /6/2017 Static Water Elevation (ft MSL) Temperature, Field C NA NA Dissolved Oxygen, Field mg/l NA NA Conductivity, Field µs/cm NA NA ORP, Field mv NA NA ph, Field SU NA NA Antimony, Total mg/l < < < < < < < < < < < < < < < < Arsenic, Total mg/l <0.010 <0.010 <0.010 <0.010 <0.010 <0.010 <0.010 <0.010 <0.010 <0.010 <0.010 <0.010 < <0.010 <0.010 <0.010 Barium, Total mg/l Beryllium, Total mg/l < < < < < < < < < < < < < < < < Boron, Total mg/l < Cadmium, Total mg/l < < < < < < < < < < < < < < < < Calcium, Total mg/l Chromium, Total mg/l <0.010 <0.010 <0.010 <0.010 <0.010 <0.010 <0.010 <0.010 <0.010 <0.010 <0.010 <0.010 <0.010 <0.010 <0.010 <0.010 <0.010 Cobalt, Total mg/l <0.020 <0.020 <0.020 <0.020 <0.020 <0.020 <0.020 <0.020 <0.020 <0.020 <0.020 <0.020 < <0.020 <0.020 <0.020 Lead, Total mg/l <0.010 <0.010 <0.010 <0.010 <0.010 <0.010 <0.010 <0.010 <0.010 <0.010 <0.010 <0.010 <0.010 <0.010 <0.010 <0.010 <0.010 Lithium, Total mg/l <0.10 <0.10 <0.10 <0.10 <0.10 <0.10 <0.10 <0.10 <0.10 <0.10 <0.10 <0.10 <0.10 < Mercury, Total mg/l < < < < < < < < < < < < < < Molybdenum, Total mg/l < < < <0.10 <0.10 <0.10 <0.10 < <0.10 Selenium, Total mg/l < < < < < < < < < < < < < < Thallium, Total mg/l < < < < < < < < < < < < < < < < < Radium-Combined pci/l < Chloride mg/l < Fluoride mg/l <5.0 <5.0 <5.0 <5.0 <5.0 <5.0 <5.0 <5.0 <5.0 <5.0 <5.0 <5.0 <5.0 <5.0 <5.0 <5.0 <5.0 ph SU Solids, Dissolved mg/l Sulfate mg/l Note: Static water elevation listed for a well may have been collected on a date different than date of well sampling. NA: Not Available.
21 Table 14 Summary of Monitoring Results - August 2017 AP-1R AP-2A AP-2BO AP-3 AP-3A AP-4A AP-4B AP-4I AP-5 AP-5A AP-6A AP-6B AP-7 AP-8 MW-2R MW-3 MW-4C /8/ /8/ /8/ /8/ /8/ /8/ /8/ /8/ /8/ /8/ /8/ /8/ /8/ /8/ /8/ /8/ /8/2017 Static Water Elevation (ft MSL) Temperature, Field C NA Dissolved Oxygen, Field mg/l NA Conductivity, Field µs/cm NA ORP, Field mv NA ph, Field SU NA Antimony, Total mg/l < < < < < < < < < < < < < < < < < Arsenic, Total mg/l <0.010 <0.010 <0.010 <0.010 <0.010 <0.010 <0.010 <0.010 <0.010 <0.010 <0.010 <0.010 <0.010 <0.010 <0.010 <0.010 <0.010 Barium, Total mg/l Beryllium, Total mg/l < < < < < < < < < < < < < < < < Boron, Total mg/l < Cadmium, Total mg/l < < < < < < < < < < < < < < < < Calcium, Total mg/l Chromium, Total mg/l <0.010 <0.010 <0.010 <0.010 <0.010 <0.010 <0.010 <0.010 <0.010 <0.010 <0.010 <0.010 <0.010 <0.010 <0.010 <0.010 <0.010 Cobalt, Total mg/l <0.020 <0.020 <0.020 <0.020 <0.020 <0.020 <0.020 <0.020 <0.020 <0.020 <0.020 <0.020 < <0.020 <0.020 <0.020 Lead, Total mg/l <0.010 <0.010 <0.010 <0.010 <0.010 <0.010 <0.010 <0.010 <0.010 <0.010 <0.010 <0.010 <0.010 <0.010 <0.010 <0.010 <0.010 Lithium, Total mg/l <0.10 <0.10 <0.10 <0.10 <0.10 <0.10 <0.10 <0.10 <0.10 <0.10 <0.10 <0.10 <0.10 < Mercury, Total mg/l < < < < < < < < < < < < < < < < < Molybdenum, Total mg/l < < <0.10 <0.10 < <0.10 <0.10 <0.10 <0.10 < <0.10 Selenium, Total mg/l < < < < < < < < < < < < < < < < Thallium, Total mg/l < < < < < < < < < < < < < < < < < Radium-Combined pci/l < <0.5 <0.86 <0.73 < Chloride mg/l < Fluoride mg/l <5.0 <5.0 <5.0 <5.0 <5.0 <5.0 <5.0 <5.0 <5.0 <5.0 <5.0 <2.5 <5.0 <5.0 <5.0 <5.0 <5.0 ph SU Solids, Dissolved mg/l Sulfate mg/l Note: Static water elevation listed for a well may have been collected on a date different than date of well sampling. NA: Not Available.
22 FIGURES Figure 1: Figure 2: Site Location Map CCR Groundwater Monitoring System


23