Single Molecules and Single Gold Nanoparticles: Detection and Spectroscopy
|
|
|
- Donald Harvey
- 5 years ago
- Views:
Transcription
1 Single Molecules and Single Gold Nanoparticles: Detection and Spectroscopy T. Jollans, W. Zhang, B. Pradhan A. Carattino, L. Hou, N. Verhart S. Adhikari, M. Caldarola M. Orrit Molecular Nano-Optics and Spins Leiden University (Netherlands) Strasbourg, 05 July 2016
2 Outline Single molecules and gold nanoparticles Photothermal detection Sensing, luminescence, trapping and enhancement with gold nanorods Plasmonic creation of nanobubbles in liquids

3 Optical microscope V 1 m 3 illum µ. about 10 9 molecules in focal spot
 ( Low T.")
4 Room Temperature σ σ abs abs ( Room T.) ( Low T.) 10 6 DiI in Zeonex 10 µm
 799")
5 Optical Microscopy of single gold nanoparticles 5 µm Third Harmonic, 100 nm; M. Lippitz et al., NanoLett 5 (2005) 799

6 Plasmons in gold nanoparticles ω = k m k m Harmonic oscillator, spring constant depends on shape
7 Gold Nanorods collab. P. Zijlstra, J. Chon, M. Gu Swinburne U. (Melbourne, Australia) SEM and TEM images Plasmons and scattering Acoustic modes

8 TEM images

9 Optical scattering and SEM images local index probe
10 Local probing of supercooled liquids Perylene-di-imide (a) in glycerol (b)


11 Dr. Florian Kulzer Dr. Rob Zondervan Dr. Ted Xia Haifeng Yuan Saumyakanti Khatua

12 Polarized single-molecule fluorescence

13 Anticorrelation of polarization channels

14 T-dep. of tumbling rates for 69 molecules

15 Extremely long memory of diffusion rate evidence for solid walls? Seen already for colloidal suspensions in the glass phase: E. R. Weeks et al., Science 287(2000) 627 A solid matrix should be elastic : rheology
16 Correction for volume
17 Molecules and rods on the same plot

18 Imaging Absorption by Photothermal Contrast Interferometric detection of the temperature rise due to absorption Au colloids, diameter 5 nm from D. Boyer et al., Science 297 (2002) 1160


19 Dr. Alexander Gaiduk Mustafa Yorulmaz
20 Signal/Noise in photothermal detection P probe σ - signal Pprobe 1 n heat hν VC T P τ P P heat - noise P probe hν Δt Pprobe Δt ( SNR) phototh. =Δn s at hν 1 n Δ nsat = Psa t τ VC T P is limited by saturation, but SNR is not (in principle).
 045424 Fluorescence and photothermal Point spread")
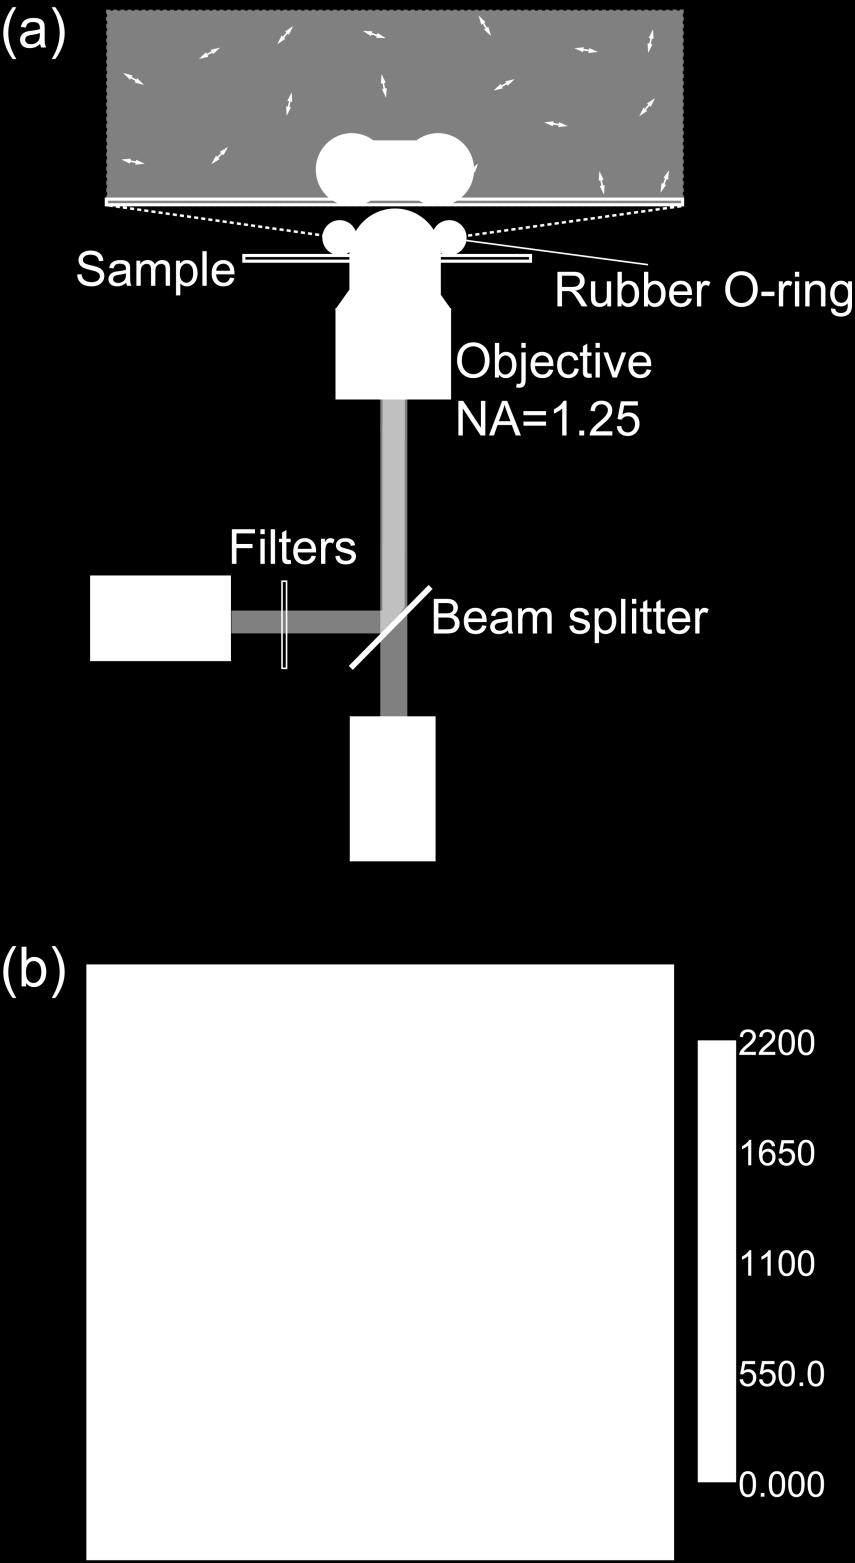
21 Optical setup Similar to: Berciaud et al., PRB 73 (2006) Fluorescence and photothermal Point spread function: about 200 nm FWHM

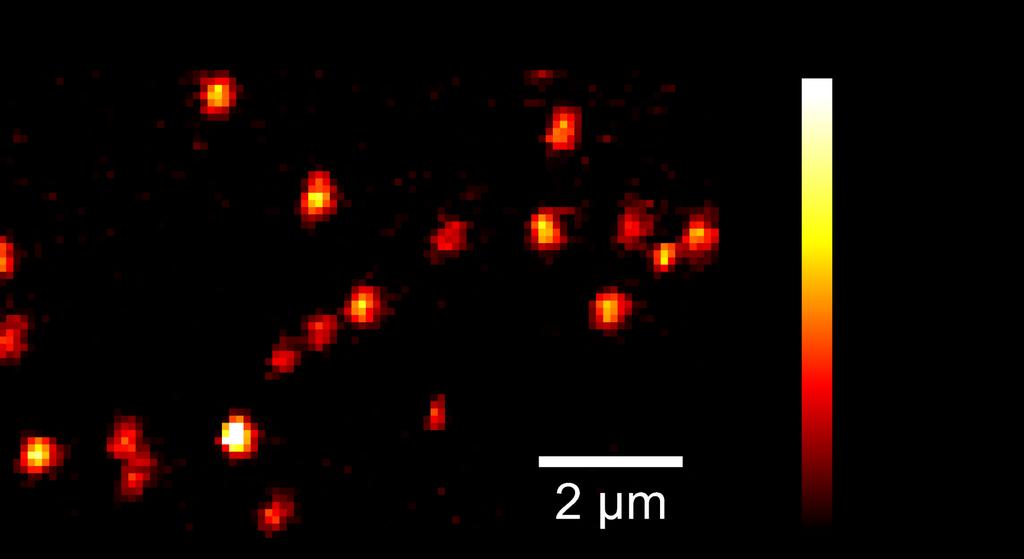
22 Simultaneous imaging of 5 nm and 20 nm Au NP s Gaiduk et al., Chemical Science 1 (2010) 343.
 379")
23 Plasmonic sensing with a single gold nanorod P. Zijlstra et al., Nat. Nanotechn., 7 (2012) 379


24 Dr Peter Zijlstra Dr. Pedro Paulo

25 Principle of the sensing

26 Preferential conjugation at the tips P. Zijlstra et al., Angew. Chem., 51 (2012) 8352
27 Binding of Streptavidin-phycoerythrin

28 Stokes and Anti-Stokes Photoluminescence of Gold Nanoparticles Carattino et al., in preparation

29 Aquiles Carattino

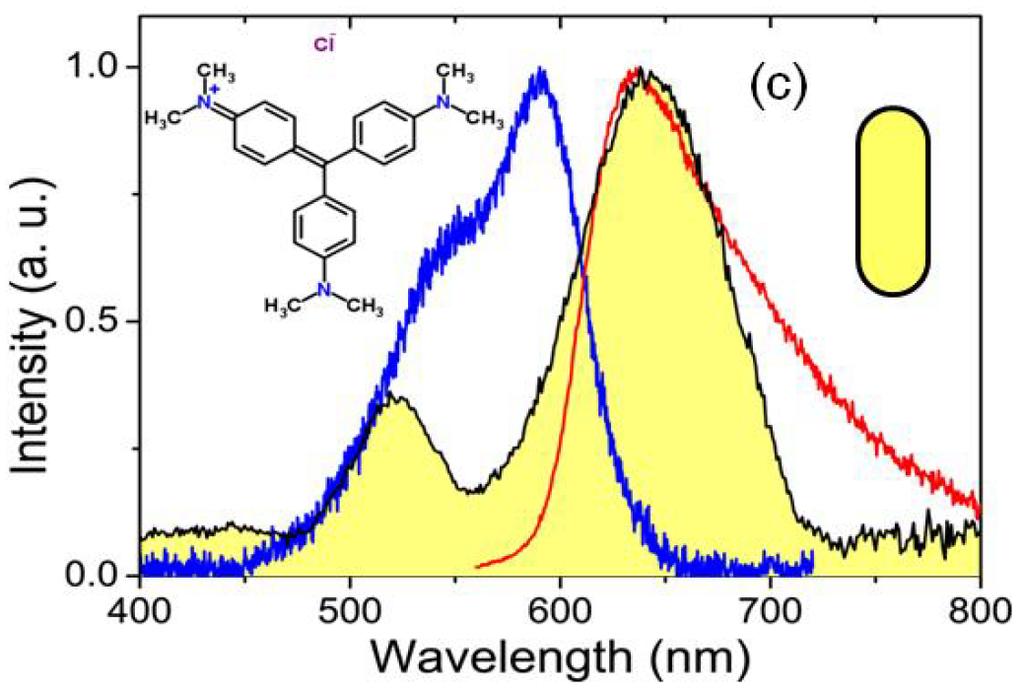
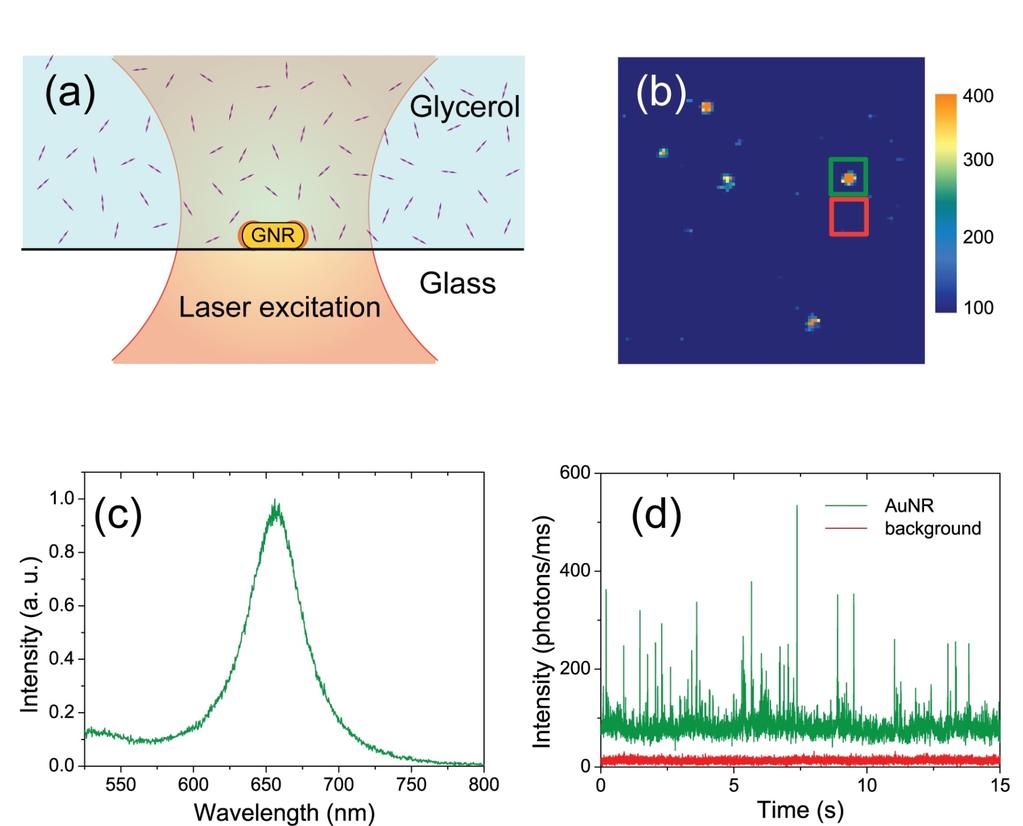
30 Photoluminescence and scattering spectra
31 Photoluminescence spectra of a gold nanorod (60 25 nm 2 )
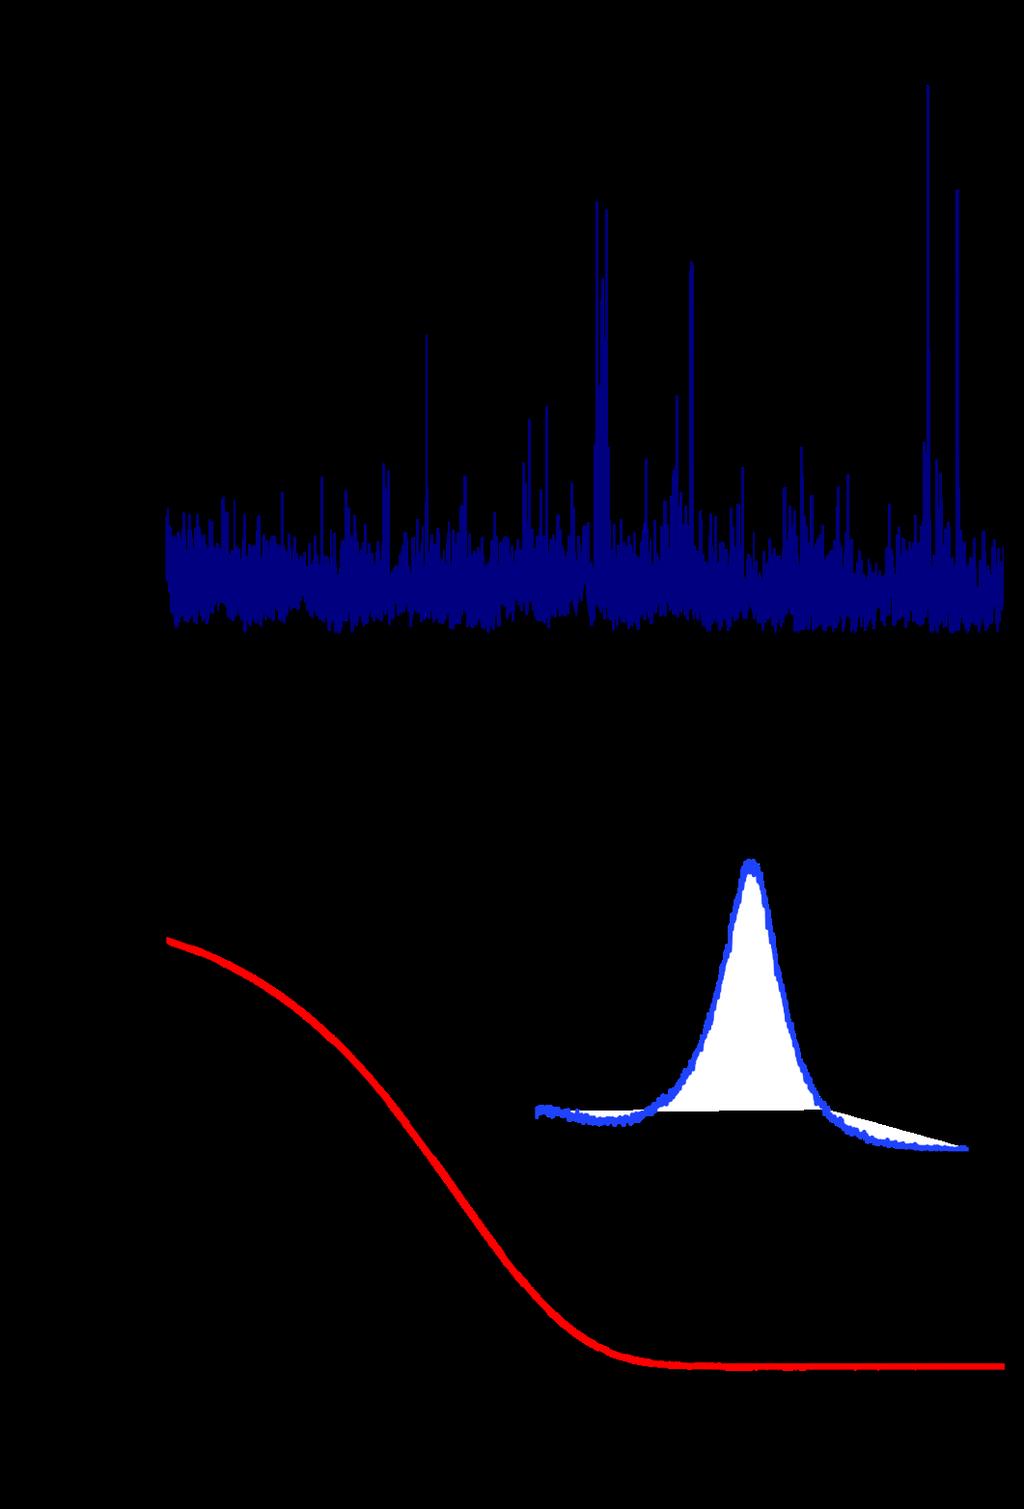
32 Intensities of AntiStokes and Stokes PL of single gold nanorods (60 25 nm 2 )

33 Cells on glass slide with gold nanorods 20 µm
")
34 Background reduction in anti-stokes image counts/s Stokes (stained cells) anti-stokes
35 Photoluminescence Signal and Background
36 Optically trapping nanoparticles - Advantages: no perturbation by the substrate; manipulations possible

37 Paul Ruijgrok
38 Orientation of gold nanorod along trap polarization
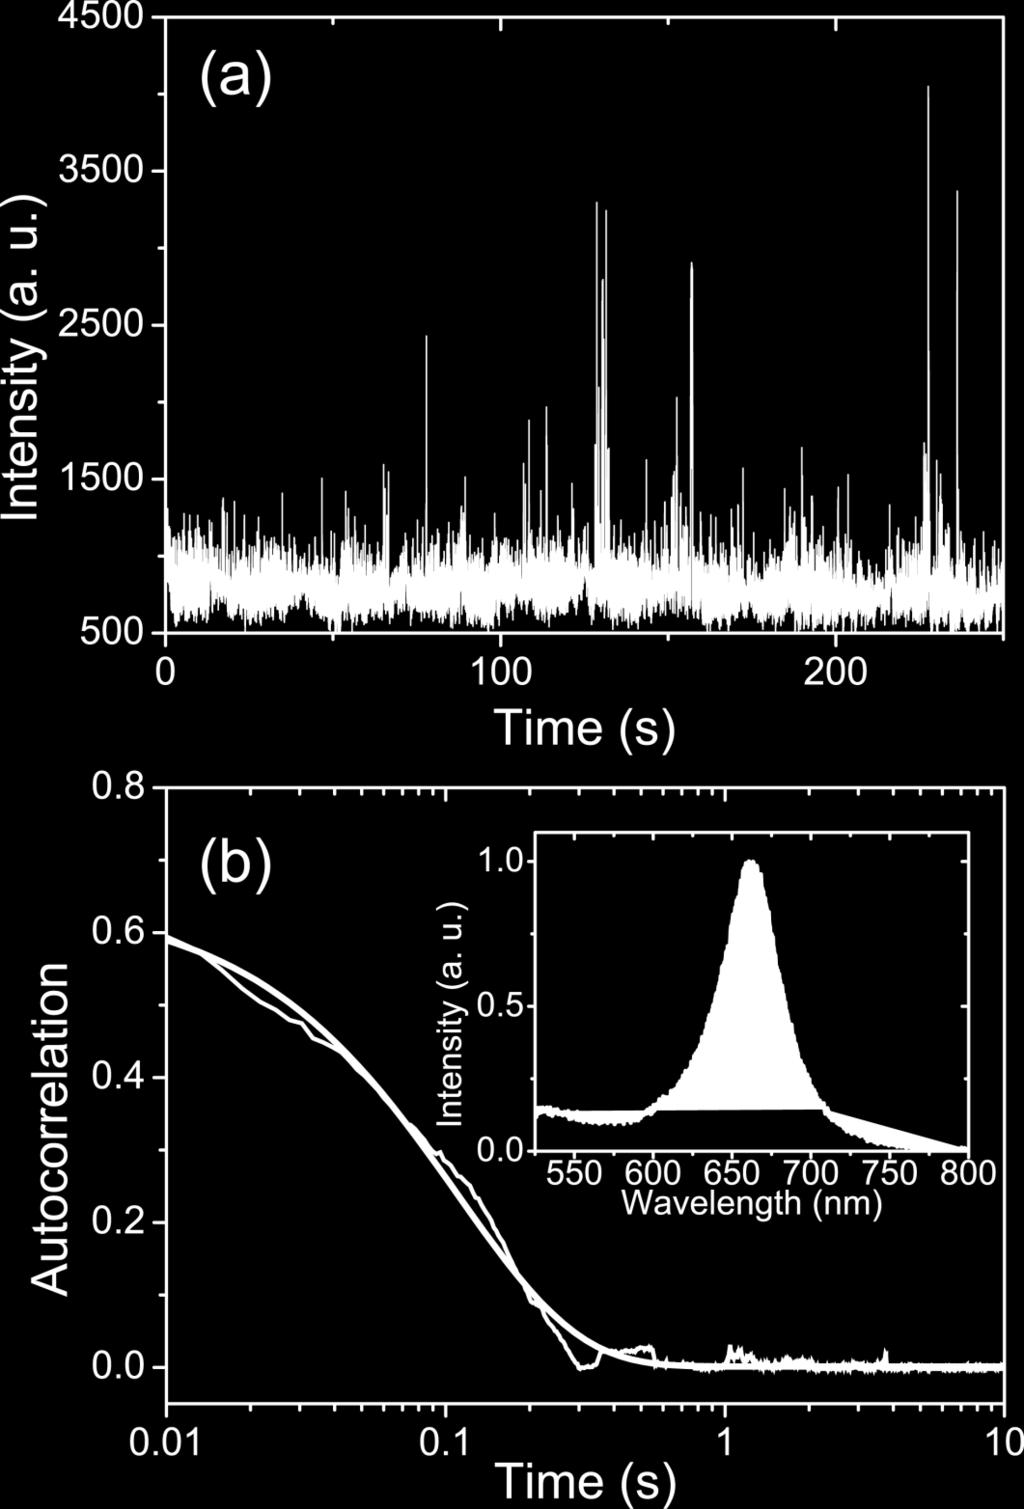
39 Fluctuations of orientation by autocorrelation nm 2 glycerol in water nm 2
40 Local temperature and viscosity Single 60x25 nm 2 nanorod in the optical trap Polarization of scattered light, rotational time, translational time as functions of trapping power Maximum temperature change about 80 K Ruijgrok et al., PRL 107 (2011)
 1217 S. Khatua et al. ACS Nano 8 (2014) 4440 S. Khatua et al. PCCP DOI 10.")
41 Fluorescence enhancement by a single gold nanorod HF Yuan et al., Angew. Chem. 52 (2013) 1217 S. Khatua et al. ACS Nano 8 (2014) 4440 S. Khatua et al. PCCP DOI /c4cp03057e
42 Haifeng Yuan Dr Saumyakanti Khatua

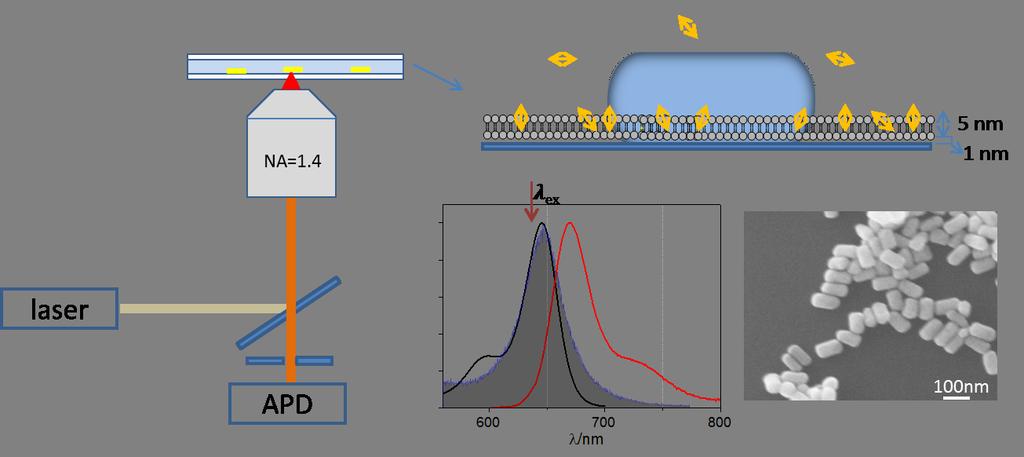
43 Spectra and Setup

44 Fluorescence bursts 2 E E nm 10 enhancement ~ 1000-fold
45 Influence of plasmon resonance Intensity (Counts/ms) SPR 648 nm SPR 690 nm SPR 545 nm Wavelength (nm) Intensity (a.u.) Time (s)
46 Spectral dependence of enhancement
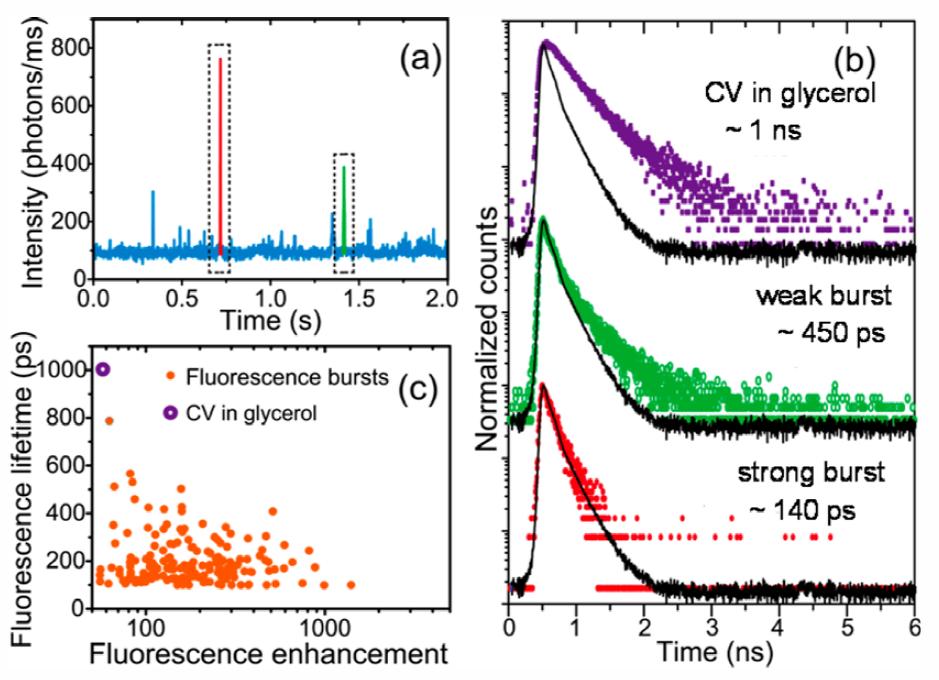
47 Fluorescence lifetime

48 Biswajit Pradhan
49 Enhancement of Atto 647N A B
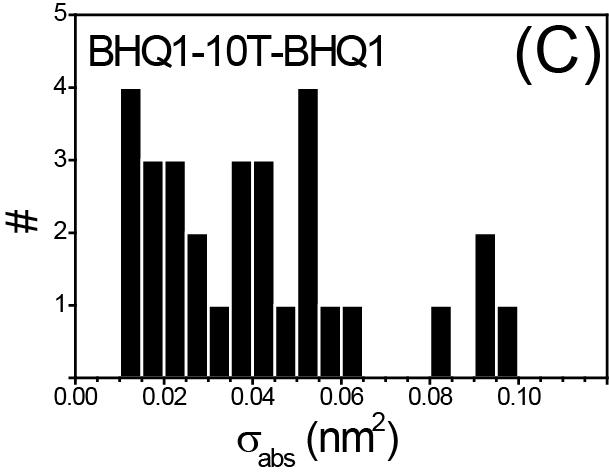
50 Near-field bursts in time traces A B C D E F Only far field
51 Fluorescence decays 1 Enhanced signal ATTO 647N only AuNR only Total signal of ATTO 647N with AuNR Normalized counts E time/ns Lifetime shortening due to antenna effect and fluorescence quenching by the metal

52 Enhanced FCS with Lifetime filtering A B C D Ratio of diffusion times in near-field and far-field: about 60


53 Enhanced FCS of a labelled protein Diffusion time in bilayer longer than for the dye alone
")
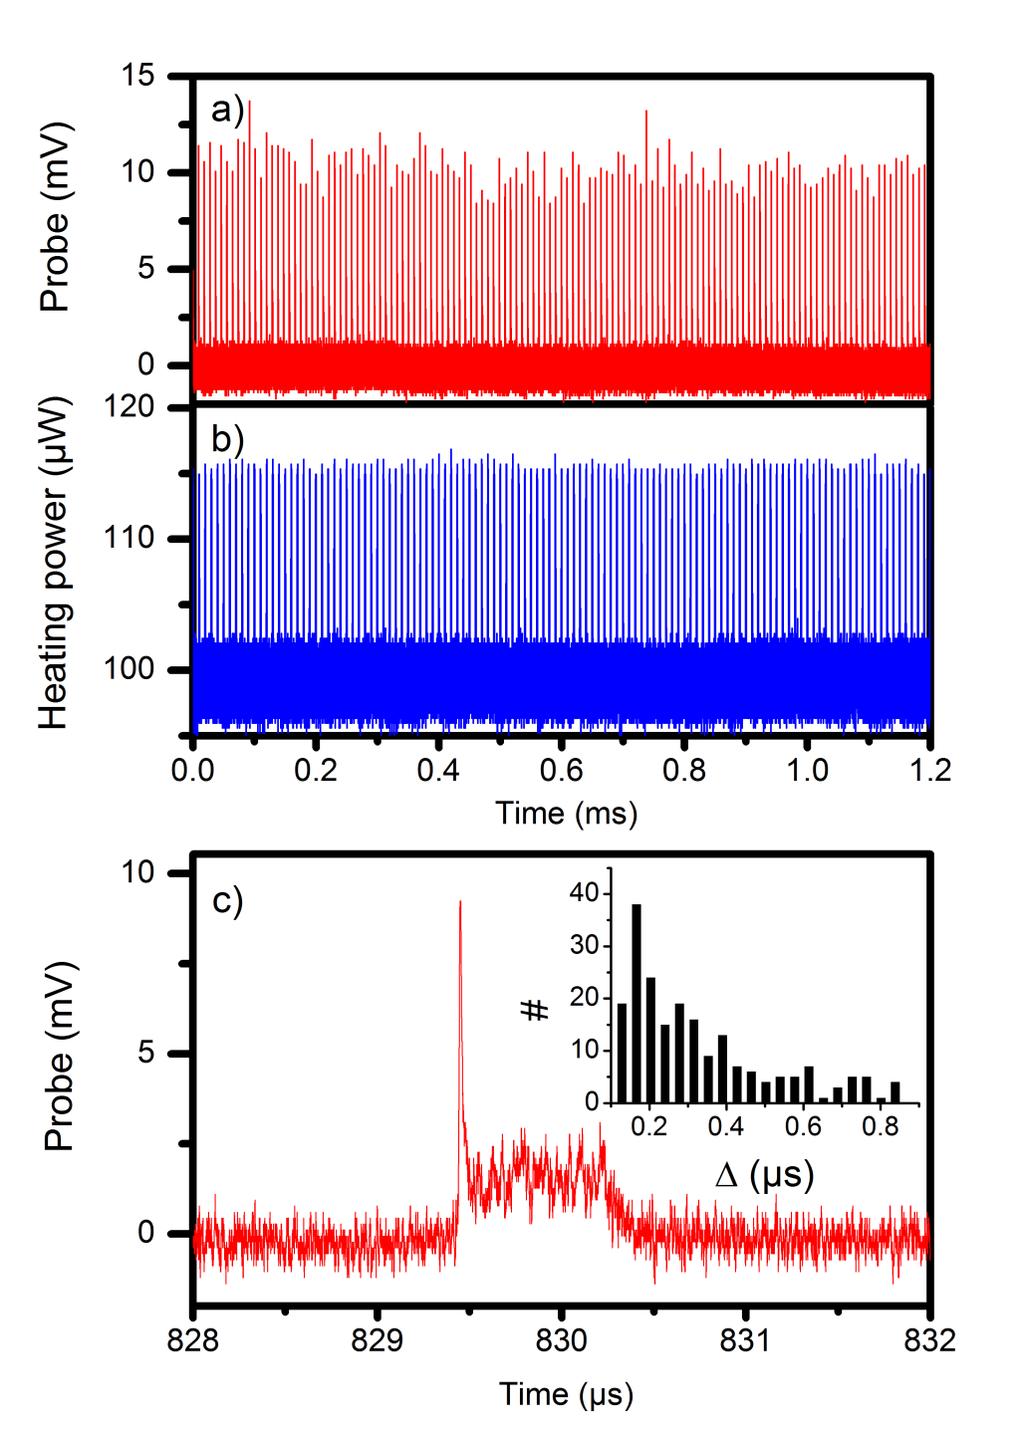
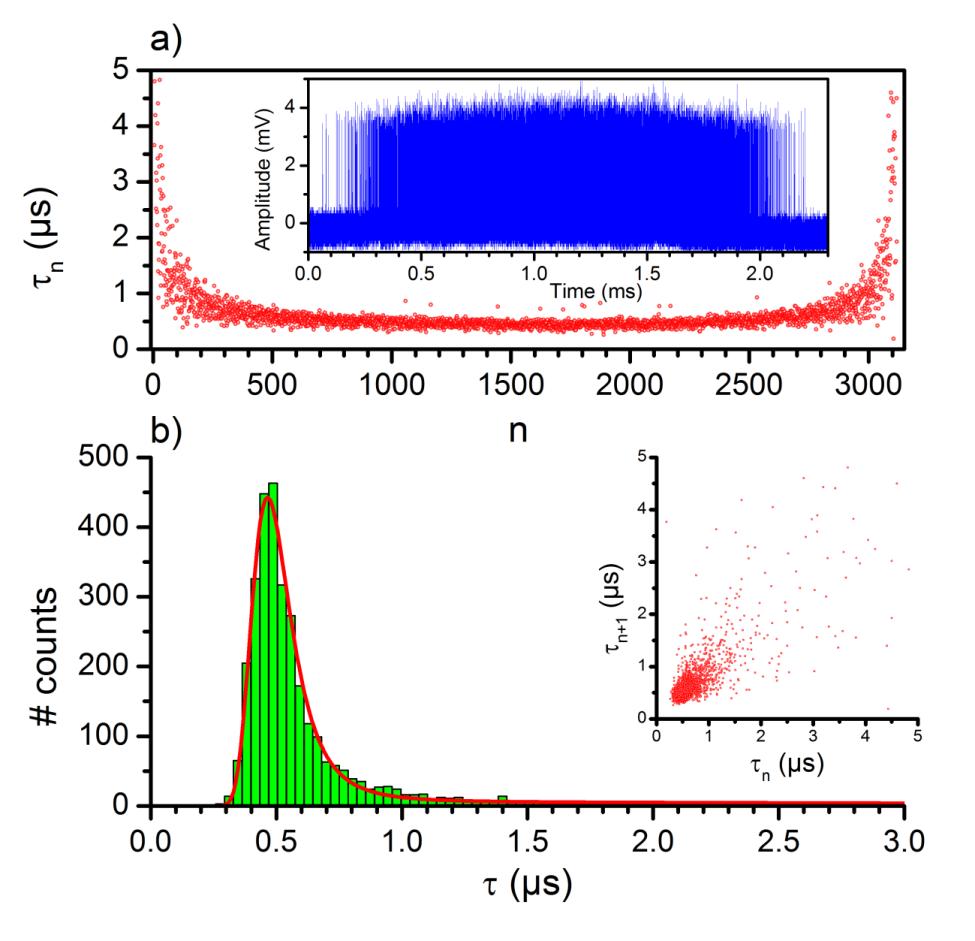
54 Plasmonic Nanobubbles Lei Hou et al., submitted (ArXiv , 2014)


55 Lei Hou Thomas Jollans
56 Boiling occurs at higher temperature

57 Threshold in water Photothermal detection of scattered probe.

58 Dynamics of nanobubble in pentane Fast explosive events (25 ns).
59 Acoustic echoes trigger new nanobubbles

 Intensity (a.")

60 Conclusions Dynamical heterogeneity Plasmonic sensing with a single gold nanorod Intensity (Counts/ms) SPR 648 nm SPR 690 nm SPR 545 nm Wavelength (nm) Intensity (a.u.) Time (s) 1000 fluorescence enhancement with spectral matching Explosive nanobubbles upon plasmonic heating
61
62 Single-molecule absorption
63 Single-step photobleaching Gaiduk et al., Science 330 (2010) 353

64 Intrinsic luminescence quantum yield Gaiduk et al., ChemPhysChem 2011 Dulkeith et al. PRB 2004 (ensembles)
65
66 Fluorescence bursts

67 Trapping individual gold nanorods ~ real time 60 µ m
68 Power spectrum of lateral fluctuations 10-4 with rod P (f) (arb. u.) without rod f (Hz) Single 40x20 nm nanorod in the optical trap (P~120 mw) Cut-off frequency ~ 400 Hz Trap stiffness ~ 0.01 pn/nm/w
69 Persistent nanobubble