Future climate scenarios for phosphorus and nitrogen dynamics in the Gulf of Riga
|
|
|
- Eustace Lewis
- 5 years ago
- Views:
Transcription

1 Future climate scenarios for phosphorus and nitrogen dynamics in the Gulf of Riga Bärbel Müller Karulis, Latvian Institute of Aquatic Ecology Juris Aigars, Latvian Institute of Aquatic Ecology In colaboration with Juris Seņņikovs, Laboratory for Mathematical Modelling of Environmental and Technological Processes, Faculty of Physics and Mathematics, University of Latvia Latvian Institute of Aquatic Ecology
2 Gulf of Riga characteristics Semi enclosed basin Connected to Eastern Gotland basin surface waters Salinity PSU Shallow: average depth 22 m, maximum 56 m no permament halocline, seasonal thermocline, monomictic circulation High freshwater and riverine nutrient input Regular monitoring since 1973 Response to climate change

3 Mean temperature (period )

4 Mean oxygen (period )
5 Model setup Biogeochemical model phytoplankton, zooplankton and nutrients NPZD Box model based on Savchuk boxes (pelagic, demersal) + sediments 3 phytoplankton groups Zooplankton NO 3, NH 4, PO 4, O 2 Calibrated to 28 year observation series Physical model (1D) vertical temperature distribution in the GoR General Ocean Turbulence Model (GOTM) Coefficients of second order model: Cheng (2002) Dynamic equation (k ε style) for TKE Dynamic dissipation rate equation Ecosystem response Temperature change
6 Climate change scenario Climate data from PRUDENCE. Control: , Scenario A2: Ins titute Model Driving data Acronym Experiment SMHI RCAO high res. HadAM3H A2 HCCTL_22 control SMHI RCAO high res. HadAM3H A2 HCA2_22 scenario Extra downscaling of RCM data (bias correction via histogram equalisation): relative humidity (used variable td2m) air temperature (used variable t2m) Original RCM data: sea level pressure (used variable MSLP) cloudiness (used variable clcov) wind speed (used variable w10m) wind direction (used variable w10dir) Calculations made for Gulf of Riga (50 m), 30 year period, daily output data water temperature
7 Physical model results I (mean temperature distribution over depth) 0 Surface T increase close to air T increase Depth, m Water Water Air Air T increase by 1,5 (bottom) to 3 (surface) degrees Temperature, degc
8 Physical model results II (mean daily pycnocline depth and its variation) stratification lasts longer Depth, m Pycnocline develops earlier... Jan Feb Mar Apr Mai Jūn Jūl Aug Sep Okt Nov Dec


9 Physical model results III (mean time-depth plots of temperature) Contemporary climate Climate change scenario A2
10 Vertical water exchange Vertical water exchange CTL A2 md decreased vertical 0.2 water exchange Jan Feb Mar Apr May Jun Jul Aug Sep Oct Nov Dec Jan
11 Demersal oxygen GR mean Demersal oxygen CTL A2 9 8 ml l Jan Feb Mar Apr May Jun Jul Aug Sep Oct Nov Dec Jan
12 Species succession Spring phytoplankton CTL A2 mg C m earlier and more vigorous spring bloom Jan Feb Mar Apr May Jun Jul Aug Sep Oct Nov Dec Jan
13 Species succession Summer phytoplankton CTL A2 250 mg C m larger biomass of summer species 0 Jan Feb Mar Apr May Jun Jul Aug Sep Oct Nov Dec Jan
14 Species succession Nfixing phytoplankton more cyanobacteria CTL A2 mg C m Jan Feb Mar Apr May Jun Jul Aug Sep Oct Nov Dec Jan
15 Pelagic nutrients Pelagic NO3 CTL A2 larger winter pool 3 l m o 6 m m earlier depletion Jan Feb Mar Apr May Jun Jul Aug Sep Oct Nov Dec Jan
16 Demersal nutrients Demersal NO3 CTL A2 mmol m larger demersal nutrient concentrations in summer Jan Feb Mar Apr May Jun Jul Aug Sep Oct Nov Dec Jan
17 Vertical nutrient flux net vertical DIN flux CTL A2 1 d 2 8 l m 6 o m m increased demersal concentrations compensate stratification effect Jan Feb Mar Apr May Jun Jul Aug Sep Oct Nov Dec Jan
18 Nutrient regeneration Pelagic DIN regeneration CTL A2 10 mmol m 2 d Pronounced increase in nutrient recycling! Jan Feb Mar Apr May Jun Jul Aug Sep Oct Nov Dec Jan
19 Denitrification
20 Nitrate uptake/release (oxygen control)

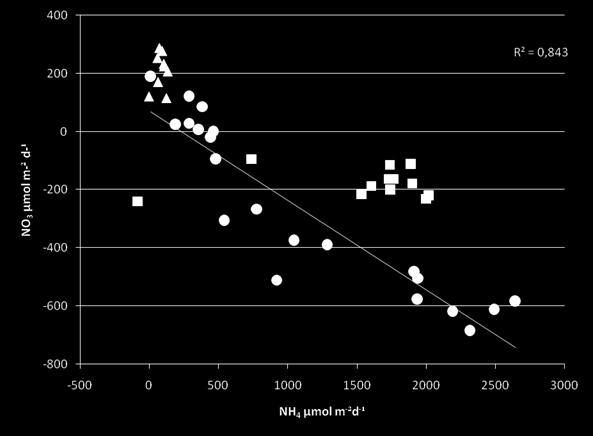
21 Ammonium versus nitraterelease

22 Mean nitrate (period )
23 Conclusions Increase in phytoplankton growth and primary productivity caused by increased nutrient regeneration Slightly increased winter nutrient concentrations Earlier spring bloom (earlier stratification, no ice cover) Larger summer phytoplankton biomass, more cyanobacteria because of more intensive nutrient regeneration Lower demersal oxygen concentration caused by more stable and longer stratification Denitrification open question for future research