January 31, Mr. Lon Petts Hoosier Energy REC, Inc. P.O. Box 908 Bloomington, Indiana 47402
|
|
|
- Sophie Wilkerson
- 5 years ago
- Views:
Transcription

1 ATC Group Services LLC January 31, 2018 Mr. Lon Petts Hoosier Energy REC, Inc. P.O. Box 908 Bloomington, Indiana Centerpoint Dr. Suite 100 Indianapolis, IN Phone Fax Re: CCR Annual Groundwater Monitoring and Corrective Action Report Merom Generating Station Area 3 Landfill CCR Monitoring System 5500 West Old Highway 54 Sullivan County, Indiana ATC Project No. 170LF00147 Dear Mr. Petts: ATC Group Services LLC (ATC) has prepared this 2017 CCR Annual Groundwater Monitoring and Corrective Action Report for the bedrock aquifer groundwater monitoring system at the Hoosier Energy REC, Inc. (Hoosier Energy) Merom Generating Station located outside Sullivan, Sullivan County, Indiana. This report has been prepared to comply with reporting requirements described in the United States Environmental Protection Agency s (USEPA) Coal Combustion Residuals (CCR) Rule (e). This annual report documents the status of the groundwater monitoring and corrective action program for the Area 3 Landfill and summarizes information required by (e)(1) through (e)(5). Federal CCR Rule (e) specifies the following: For existing CCR landfills and existing CCR surface impoundments, no later than January 31, 2018, and annually thereafter, the owner or operator must prepare an annual groundwater monitoring and corrective action report. For new CCR landfills, new CCR surface impoundments, and all lateral expansions of CCR units, the owner or operator must prepare the initial annual groundwater monitoring and corrective action report no later than January 31 of the year following the calendar year a groundwater monitoring system has been established for such CCR unit as required by this subpart, and annually thereafter. For the preceding calendar year, the annual report must document the status of the groundwater monitoring and corrective action program for the
2 Hoosier Energy REC Inc. Merom Generating Station Sullivan County, Indiana CCR Annual Groundwater Monitoring and Corrective Action Report ATC Project No. 170LF00147 CCR unit, summarize key actions completed, describe any problems encountered, discuss actions to resolve the problems, and project key activities for the upcoming year. For purposes of this section, the owner or operator has prepared the annual report when the report is placed in the facility s operating record as required by (h)(1). The following key actions have been completed to comply with the CCR Rule: In accordance with (b)(1)(i), Hoosier Energy installed a groundwater monitoring system as required by In accordance with (b)(1)(ii), Hoosier Energy developed the groundwater sampling and analysis program to include the selection of the statistical procedures to be used for evaluating groundwater monitoring data as required by In accordance with (b)(1)(iii), Hoosier Energy initiated a detection monitoring program to obtain a minimum of eight samples from each background and downgradient well as required by (b). In accordance with (f), Hoosier Energy provided the groundwater monitoring system certification. In accordance with (f)(6), Hoosier Energy provided the certification that the selected statistical method is appropriate for evaluating the groundwater monitoring data for the CCR management area. To report on the activities conducted during the prior calendar year and document compliance with the CCR Rule, the specific requirements listed in (e)(1) through (e)(5) are provided below in bold/italic type followed by a short narrative addressing how that specific requirement has been met. At a minimum, the annual groundwater monitoring and corrective action report must contain the following information, to the extent available: (e)(1) A map, aerial image, or diagram showing the CCR unit and all background (or upgradient) and downgradient monitoring wells, to include the well identification numbers, that are part of the groundwater monitoring program for the CCR unit; Hoosier Energy operates the Merom Generating Station, located approximately six miles west of Sullivan, Indiana. It is located at 5500 West Old Highway 54, Sullivan, Indiana. A Vicinity Map is provided as Figure 1. A map showing the location of the CCR management unit and associated upgradient and downgradient monitoring wells is provided as Figure 2. This information was previously presented in the Hoosier Energy Monitoring Well Installation Report, dated August 15, (e)(2) Identification of any monitoring wells that were installed or decommissioned during the preceding year, along with a narrative description of why those actions were taken; January 31, 2018 ATC Group Services LLC 2
3 Hoosier Energy REC Inc. Merom Generating Station Sullivan County, Indiana CCR Annual Groundwater Monitoring and Corrective Action Report ATC Project No. 170LF00147 Because this is the first CCR annual report, relevant activities conducted prior to and during 2017 are summarized below. The CCR groundwater monitoring system at the Merom Generating Station Area 3 Landfill consists of eight monitoring wells: SWW-40, SWW-41, SWW-42, SWW-43, SWW-44, SWW-45, SWW-46, and SWW-47. The wells were installed in accordance with the requirements of Federal CCR Rule between December 7, 2015 and January 21, Monitoring wells SWW-40, SWW-46, and SWW-47 are considered upgradient wells. The location of the CCR monitoring well network is depicted on Figure 2. Documentation of the design and construction of the monitoring well network for the Area 3 Landfill is included in the Hoosier Energy Monitoring Well Installation Report, dated August 15, (e)(3) In addition to all the monitoring data obtained under through , a summary including the number of groundwater samples that were collected for analysis for each background and downgradient well, the dates the samples were collected, and whether the sample was required by the detection monitoring or assessment monitoring programs; In accordance with (b), a minimum of eight independent samples from each background and downgradient monitoring well were collected prior to October 17, Each of the sampling events completed through 2017 were part of the detection monitoring program. Table 1 provides a summary of the number of samples collected at each well, sampling dates, and designation of whether samples were required by the detection or assessment monitoring program. Groundwater analytical results for samples collected during 2016 and 2017 are summarized in Tables 2 through (e)(4) A narrative discussion of any transition between monitoring programs (e.g., the date and circumstances for transitioning from detection monitoring to assessment monitoring in addition to identifying the constituent(s) detected at a statistically significant increase over background levels); Consistent with (e), the 2017 annual report documents activities conducted during the prior calendar year at the CCR management units subject to the Rule. The statistical analysis of the initial minimum eight rounds of groundwater sampling was not completed in 2017 and therefore is not reported in this Annual Report. A narrative discussion of any transition between monitoring programs (e.g., the date and circumstances for transitioning from detection monitoring to assessment monitoring in addition to identifying the constituent(s) detected at a statistically significant increase over background levels) will be provided, as appropriate, in subsequent annual reports. January 31, 2018 ATC Group Services LLC 3
4 Hoosier Energy REC Inc. Merom Generating Station Sullivan County, Indiana CCR Annual Groundwater Monitoring and Corrective Action Report ATC Project No. 170LF (e)(5) Other information required to be included in the annual report as specified in through Other information required to be included in this report will be provided, as appropriate, in subsequent annual reports. We appreciate the opportunity to assist with Hoosier Energy s CCR Rule groundwater monitoring program at Merom Generating Station s Area 3 Landfill. Please contact any of the undersigned at if you have any questions regarding this report. Sincerely, Mark E. Breting, L.P.G. Senior Project Geologist John R. Noel, L.P.G. Principal Geologist January 31, 2018 ATC Group Services LLC 4
5 TABLES Table 1: Well Sampling Summary Table 2: Summary of Detection Monitoring Results March 2016 Table 3: Summary of Detection Monitoring Results June 2016 Table 4: Summary of Detection Monitoring Results September 2016 Table 5: Summary of Detection Monitoring Results November 2016 Table 6: Summary of Detection Monitoring Results January 2017 Table 7: Summary of Detection Monitoring Results March 2017 Table 8: Summary of Detection Monitoring Results May 2017 Table 9: Summary of Detection Monitoring Results July 2017 Table 10: Summary of Detection Monitoring Results August 2017 Table 11: Summary of Detection Monitoring Results September 2017
6 Table 1 Well Sampling Summary Merom Generating Station Sullivan, Indiana ATC Project No. 170LF00147 Identification Date Installed Background or Downgradient Number of Samples Sample Date 3/28/2016 6/16/2016 9/27/ /14/2016 SWW-40 (PZ-5) 12/11/2015 Background 9 1/11/2017 3/14/2017 5/9/2017 7/5/2017 9/5/2017 3/28/2016 6/16/2016 9/27/ /14/2016 SWW-41 (PZ-4) 12/19/2015 Downgradient 9 1/11/2017 3/14/2017 5/9/2017 7/5/2017 9/5/2017 3/28/2016 6/16/2016 9/27/ /14/2016 SWW-42 (PZ-3) 12/16/2015 Downgradient 9 1/11/2017 3/14/2017 5/10/2017 7/6/2017 9/5/2017 3/28/2016 6/17/2016 9/27/ /14/2016 SWW-43 (PZ-2) 1/5/2016 Downgradient 9 1/11/2017 3/14/2017 5/10/2017 7/6/2017 9/5/2017 3/28/2016 6/16/2016 9/27/ /14/2016 SWW-44 (PZ-1) 1/7/2016 Downgradient 9 1/11/2017 3/14/2017 5/10/2017 7/6/2017 9/6/2017 3/29/2016 6/16/2016 9/27/ /14/2016 SWW-45 (PZ-8) 1/14/2016 Downgradient 9 1/11/2017 3/14/2017 5/9/2017 7/6/2017 9/6/2017 Detection or Assessment Monitoring Detection Detection Detection Detection Detection Detection
7 Table 1 Well Sampling Summary Merom Generating Station Sullivan, Indiana ATC Project No. 170LF00147 Identification Date Installed Background or Downgradient Number of Samples Sample Date 3/29/2016 6/17/2016 9/27/ /14/2016 SWW-46 (PZ-7) 1/21/2016 Background 9 1/11/2017 3/14/2017 5/9/2017 7/5/2017 9/6/2017 3/29/2016 6/17/2016 9/27/ /14/2016 SWW-47 (PZ-6) 1/19/2016 Background 9 1/11/2017 3/14/2017 5/9/2017 7/5/2017 8/18/2017* 9/6/2017 Detection or Assessment Monitoring Detection Detection Notes: * A resample for TDS at SWW-47 was completed on August 18, It is not counted as a unique sample.
8 Merom Landfill [ccra3] Analysis prepared on: 1/29/2018 Table 2 Analytical Data Summary for 3/28/2016 to 3/29/2016 Constituents Units SWW-40 SWW-41 SWW-42 SWW-43 SWW-44 SWW-45 SWW-46 SWW-47 Antimony 1.2 < <1.0 < <2.0 Arsenic Barium Beryllium <.20 <.20 < Boron Cadmium <2 <2 <2 <2 <2 <2 <2 2 Calcium Chloride mg/l Chromium <10.0 <10.0 <10.0 <10.0 < Cobalt <1.0 < Fluoride mg/l <.1 Lead < <10.0 <10.0 <10.0 <10.0 < Lithium < Mercury <2 <2 <2 <2 <2 <2 <2 <2 Molybdenum 22.8 <10.0 <10.0 < <10.0 < ph SU Selenium <1 <1 <1 <1 <1 <1 <1 <40 Sulfate mg/l Thallium <1 <1 <1 <1 <1 <1 <1 <2 Total dissolved solids mg/l * - The displayed value is the arithmetic mean of multiple database matches. Prepared by: ATC Group Services LLC
9 Merom Landfill [ccra3] Analysis prepared on: 1/29/2018 Table 3 Analytical Data Summary for 6/16/2016 to 6/17/2016 Constituents Units SWW-40 SWW-41 SWW-42 SWW-43 SWW-44 SWW-45 SWW-46 SWW-47 Antimony <1.0 <1.0 <1.0 < <1.0 Arsenic Barium Beryllium < <.20 <.20 < Boron Cadmium <2 <2 <2 <2 <2 <2 <2 <2 Calcium Chloride mg/l Chromium < <10.0 <10.0 < Cobalt < <1.0 <1.0 < Fluoride mg/l Lead <10.0 < <10.0 <10.0 < Lithium < < Mercury <2 <2 <2 <2 <2 <2 <2 <2 Molybdenum 22.1 <10.0 <10.0 <10.0 <10.0 < ph SU Selenium <1 <1 <1 <1 <1 <1 <1 <1 Sulfate mg/l Thallium <1 <1 <1 <1 <1 <1 <1 <1 Total dissolved solids mg/l * - The displayed value is the arithmetic mean of multiple database matches. Prepared by: ATC Group Services LLC
10 Merom Landfill [ccra3] Analysis prepared on: 1/29/2018 Table 4 Analytical Data Summary for 9/27/2016 Constituents Units SWW-40 SWW-41 SWW-42 SWW-43 SWW-44 SWW-45 SWW-46 SWW-47 Antimony <1.0 <1.0 <1.0 < <1.0 Arsenic Barium Beryllium < <.20 <.20 < Boron Cadmium <2 <2 <2 <2 <2 <2 <2 <2 Calcium Chloride mg/l Chromium < <10.0 <10.0 < Cobalt < <1.0 <1.0 < Fluoride mg/l Lead <10.0 <10.0 <10.0 <10.0 <10.0 <10.0 < Lithium < < Mercury <2 <2 <2 <2 <2 <2 <2 <2 Molybdenum 12.8 <10.0 <10.0 <10.0 <10.0 < ph SU Selenium <1 <1 <1 <1 <1 <1 <1 <10 Sulfate mg/l Thallium <1 <1 <1 <1 <1 <1 <1 <1 Total dissolved solids mg/l * - The displayed value is the arithmetic mean of multiple database matches. Prepared by: ATC Group Services LLC
11 Merom Landfill [ccra3] Analysis prepared on: 1/29/2018 Table 5 Analytical Data Summary for 11/14/2016 Constituents Units SWW-40 SWW-41 SWW-42 SWW-43 SWW-44 SWW-45 SWW-46 SWW-47 Antimony <1.0 <1.0 <1.0 <1.0 < <1.0 Arsenic Barium Beryllium < <.20 <.20 < Boron Cadmium <2 <2 <2 <2 <2 <2 <2 <2 Calcium Chloride mg/l Chromium <10.0 <10.0 <10.0 <10.0 <10.0 <10.0 < Cobalt < <1.0 <1.0 < Fluoride mg/l Lead <10.0 <10.0 <10.0 <10.0 <10.0 <10.0 < Lithium < < Mercury <2 <2 <2 <2 <2 <2 <2 <2 Molybdenum 18.0 <10.0 <10.0 < < <10.0 ph SU Selenium <1 <1 <1 <1 <1 <1 <1 <5 Sulfate mg/l Thallium <1 <1 <1 <1 <1 <1 <1 <1 Total dissolved solids mg/l * - The displayed value is the arithmetic mean of multiple database matches. Prepared by: ATC Group Services LLC
12 Merom Landfill [ccra3] Analysis prepared on: 1/29/2018 Table 6 Analytical Data Summary for 1/11/2017 Constituents Units SWW-40 SWW-41 SWW-42 SWW-43 SWW-44 SWW-45 SWW-46 SWW-47 Antimony <1.0 <1.0 <1.0 < < <1.0 Arsenic Barium Beryllium <.20 < <.20 <.20 < Boron Cadmium <2 <2 <2 <2 <2 <2 <2 <2 Calcium Chloride mg/l Chromium <10.0 < <10.0 <10.0 <10.0 < Cobalt <1.0 < <1.0 <1.0 < Fluoride mg/l Lead <10.0 < <10.0 <10.0 <10.0 < Lithium < < Mercury <2 <2 <2 <2 <2 <2 <2 <2 Molybdenum 17.6 <10.0 <10.0 <10.0 <10.0 < ph SU Selenium <1 <1 <1 <1 <1 <1 <1 <1 Sulfate mg/l Thallium <1 <1 <1 <1 <1 <1 <1 <1 Total dissolved solids mg/l * - The displayed value is the arithmetic mean of multiple database matches. Prepared by: ATC Group Services LLC
13 Merom Landfill [ccra3] Analysis prepared on: 1/29/2018 Table 7 Analytical Data Summary for 3/14/2017 Constituents Units SWW-40 SWW-41 SWW-42 SWW-43 SWW-44 SWW-45 SWW-46 SWW-47 Antimony <1.0 <1.0 <1.0 <1.0 <1.0 < <1.0 Arsenic < Barium Beryllium <.20 <.20 <.20 < Boron Cadmium <2 <2 <2 <2 <2 <2 <2 <2 Calcium Chloride mg/l Chromium < <10.0 <10.0 <10.0 < Cobalt <1.0 <1.0 <1.0 < Fluoride mg/l Lead <10.0 <10.0 <10.0 <10.0 <10.0 <10.0 < Lithium <20.0 < Mercury <2 <2 <2 <2 <2 <2 <2 <2 Molybdenum 15.3 <10.0 <10.0 <10.0 <10.0 < <10.0 ph SU Selenium <1 <1 <1 <1 <1 <1 <1 <1 Sulfate mg/l Thallium <1 <1 <1 <1 <1 <1 <1 <1 Total dissolved solids mg/l * - The displayed value is the arithmetic mean of multiple database matches. Prepared by: ATC Group Services LLC
14 Merom Landfill [ccra3] Analysis prepared on: 1/29/2018 Table 8 Analytical Data Summary for 5/09/2017 to 5/10/2017 Constituents Units SWW-40 SWW-41 SWW-42 SWW-43 SWW-44 SWW-45 SWW-46 SWW-47 Antimony <1.0 <1.0 <1.0 <1.0 < <1.0 Arsenic Barium Beryllium <.20 < <.20 <.20 < Boron Cadmium <2 <2 <2 <2 <2 <2 <2 <2 Calcium Chloride mg/l Chromium <10.0 < <10.0 <10.0 <10.0 < Cobalt < <1.0 <1.0 < Fluoride mg/l Lead <10.0 < <10.0 <10.0 <10.0 < Lithium < < Mercury <2 <2 <2 <2 <2 <2 <2 <2 Molybdenum 13.2 <10.0 <10.0 <10.0 <10.0 <10.0 <10.0 <10.0 ph SU Selenium <1.0 < <1.0 <1.0 <1.0 <1.0 <5.0 Sulfate mg/l Thallium <1 <1 <1 <1 <1 <1 <1 <1 Total dissolved solids mg/l * - The displayed value is the arithmetic mean of multiple database matches. Prepared by: ATC Group Services LLC
15 Merom Landfill [ccra3] Analysis prepared on: 1/29/2018 Table 9 Analytical Data Summary for 7/05/2017 to 7/06/2017 Constituents Units SWW-40 SWW-41 SWW-42 SWW-43 SWW-44 SWW-45 SWW-46 SWW-47 Antimony <1.0 <1.0 <1.0 <1.0 < <1.0 Arsenic Barium Beryllium <.20 < <.20 <.20 < Boron Cadmium <2 <2 <2 <2 <2 <2 <2 <2 Calcium Chloride mg/l Chromium <10.0 < <10.0 <10.0 < Cobalt <1.0 < <1.0 <1.0 < Fluoride mg/l Lead <10.0 < <10.0 <10.0 <10.0 < Lithium < < Mercury <2 <2 <2 <2 <2 <2 <2 <2 Molybdenum 10.6 <10.0 <10.0 <10.0 <10.0 <10.0 <10.0 <10.0 ph SU Selenium <1 <1 <1 <1 <1 <1 <1 <1 Sulfate mg/l Thallium <1 <1 <1 <1 <1 <1 <1 <1 Total dissolved solids mg/l * - The displayed value is the arithmetic mean of multiple database matches. Prepared by: ATC Group Services LLC
16 Merom Landfill [ccra3] Analysis prepared on: 1/29/2018 Table 10 Analytical Data Summary for 8/18/2017 Constituents Units SWW-40 SWW-41 SWW-42 SWW-43 SWW-44 SWW-45 SWW-46 SWW-47 Antimony Arsenic Barium Beryllium Boron Cadmium Calcium Chloride mg/l Chromium Cobalt Fluoride mg/l Lead Lithium Mercury Molybdenum ph SU Selenium Sulfate mg/l Thallium Total dissolved solids mg/l 886 * - The displayed value is the arithmetic mean of multiple database matches. Prepared by: ATC Group Services LLC
17 Merom Landfill [ccra3] Analysis prepared on: 1/29/2018 Table 11 Analytical Data Summary for 9/05/2017 to 9/06/2017 Constituents Units SWW-40 SWW-41 SWW-42 SWW-43 SWW-44 SWW-45 SWW-46 SWW-47 Antimony <1.0 <1.0 <1.0 <1.0 < <1.0 Arsenic <5.0 <5.0 < <5.0 Barium Beryllium <.20 < <.20 <.20 <.20 < Boron Cadmium <2 <2 <2 <2 <2 <2 <2 <2 Calcium Chloride mg/l Chromium <10.0 < <10.0 <10.0 <10.0 < Cobalt <1 <1 <5 <1 <5 <1 <5 9 Fluoride mg/l Lead <10 <10 <10 <10 <10 <10 <10 <10 Lithium < Mercury <2 <2 <2 <2 <2 <2 <2 <2 Molybdenum <10 <10 <10 <10 <10 <10 <10 <10 ph SU Selenium <1 <1 <5 <5 <5 <1 <5 <5 Sulfate mg/l Thallium <1 <1 <1 <1 <1 <1 <1 <1 Total dissolved solids mg/l * - The displayed value is the arithmetic mean of multiple database matches. Prepared by: ATC Group Services LLC
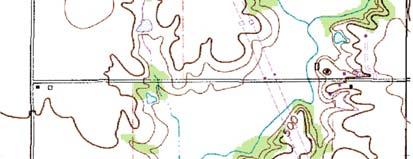
18 FIGURES Figure 1: Figure 2: Vicinity Map CCR Groundwater Monitoring System


19
20