City of Loveland Nutrient Removal Evaluation Final Report
|
|
|
- Gertrude Smith
- 5 years ago
- Views:
Transcription


1 City of Loveland Nutrient Removal Evaluation Final Report Prepared for Prepared by March 28, 2014
2
3 Table of Contents Executive Summary... ES 1 Introduction... ES 1 Process Modeling of Nutrient Removal Alternatives... ES 1 Nutrient Removal Alterative Development and Comparison... ES 5 Preferred Alternative Implementation... ES 7 Hydraulic Impacts... ES 7 Results of Dynamic Modeling of the Preferred Alternative... ES 7 Facilities Modifications to Meet Anticipated Potential Future More Stringent Effluent Requirements... ES 8 Implementation Schedule... ES 9 Section 1 Modeling and Evaluation of Nutrient Removal Alternatives Plant Model Development, Calibration and Validation Data Analysis and Wastewater Parameter Development for Alternative Analysis Modeling CDHE Design Criteria Plant Modification Alternatives Modification Alternative Modeling and Sizing Impact of Higher Influent TKN Summary and Recommendations Section 2 Nutrient Removal Alternatives Development and Comparison Alternatives Development and Descriptions Alternative 1 A2O Process Alternative 2 JHB Process Alternative 3 Step Feed Process Alternatives Implementation A2O and JHB Step Feed Alternatives Comparison and Recommendations Alternatives Capital Cost Estimates Alternatives Annual Cost Estimates Alternatives Non Monetary Considerations Recommendations Section 3 Modeling and Evaluation of Nutrient Removal Alternatives Hydraulic Impacts of Preferred Alternative Dynamic Process Modeling of Preferred Alternative Solids Balance for Preferred Alternative Plant Modifications to Meet Potential Future Regulation 31 Permit Limits Implementation Plan Appendices A... Drawing Markups for A20 B... Drawings Markups for JHB C... Drawing Markups for Step Feed D... Dynamic Modeling Output and Results E... Solids Balance F... Site Plan for Future Plant Facilities TABLE OF CONTENTS_V3.DOCX i
4 TABLE OF CONTENTS Tables Table ES 1 Anticipated Regulatory Discharge Limits per Regulation 85...ES 1 Table ES 2 Capital Cost Estimates...ES 5 Table ES 3 Operation and Maintenance Cost Estimates...ES 5 Table ES 4 Total Present Worth Cost Estimates...ES 6 Table ES 5 Non Monetary Alternatives Comparison...ES 6 Table ES 6 Biowin Diurnal Modeling Results...ES 8 Table ES 7 Air Requirement Comparison...ES 8 Table 1 1 Wastewater Characterization Model Input Table 1 2 Existing Plant Running Monthly Analysis Input Parameters Table 1 3 Model Validation Results Table 1 4 Current Permit Effluent Ammonia Limits Table 1 5 Anticipated Regulatory Discharge Limits per Regulation Table 1 6 Raw Wastewater Seasonal Average Values from Data Analysis Table 1 7 Raw Wastewater 18 Day Running Average Values from Data Analysis Table 1 8 Theoretical Minimum SRT for Nitrification (days) Table 1 9 Operating SRT for Nitrification (days) Table 1 10 A2O Alternative Modeling Results Table 1 11 A2O Relative Zone Sizes Table 1 12 JHB Alternative Modeling Results Table 1 13 JHB Relative Zone Sizes Table 1 14 Step Feed Alternative Modeling Results Table 1 15 Step Feed Relative Zone Sizes Table 2 1 A2O Alternative Plant Modification Details and Sizing Table 2 2 JHB Alternative Plant Modification Details and Sizing Table 2 3 Step Feed Alternative Plant Modification Details and Sizing Table 2 4 A2O Cost Estimate Table 2 5 JHB Cost Estimate Table 2 6 Step Feed Cost Estimate Table 2 7 Capital Cost Estimates Table 2 8 Operation and Maintenance Cost Estimates Table 2 9 Total Present Worth Cost Estimates Table 2 10 Non Monetary Alternatives Comparison Table 3 1 Influent Wastewater Characterization for BioWin Model Table 3 2 Biowin Diurnal Modeling Results Table 3 3 Air Requirement Comparison Table Stage Bardenpho Process Plant Modification Details and Sizing ii TABLE OF CONTENTS_V3.DOCX
5 TABLE OF CONTENTS Figures Figure ES-1 A2O Process Schematic... ES-3 Figure ES-2 JHB Process Schematic... ES-3 Figure ES-3 Step-Feed Process Schematic... ES-4 Figure ES-4 Benefit/Cost Comparison... ES-7 Figure ES-5 5-Stage Bardenpho Process... ES-9 Figure ES-6 Loveland WWTP Facilities Expansion Aerial View... ES-10 Figure ES-7 Project Implementation Schedule... ES-11 Figure 1-1 Figure 9.9 from Biological Wastewater Treatment (Grady, Daigger, and Lim, 1999) Figure 1-2 A2O Process Schematic Figure 1-3 JHB Process Schematic Figure 1-4 Step-Feed Process Schematic Figure 2-1 A2O Process Schematic Figure 2-2 JHB Process Schematic Figure 2-3 Step-Feed Process Schematic Figure 2-4 Non-Monetary Alternative Comparison Figure 2-5 Benefit/Cost Comparison Figure Stage Bardenpho Process Schematic Figure 3-2 Project Implementation Schedule TABLE OF CONTENTS_V3.DOCX iii
6
7 Executive Summary Introduction The City of Loveland (City) is required to comply with nutrient removal requirements at its wastewater treatment plant (WWTP). The Colorado Department of Public Health and Environment (CDPHE) is in the process of issuing new wastewater nutrient standards. CDPHE is revising in stream water quality standards (revised Regulation 31) and creating new end of pipe wastewater standards (new Regulation 85) which will impact wastewater dischargers across the State. The anticipated Regulation 85 discharge limits are as shown in Table ES 1 below. TABLE ES 1 Anticipated Regulatory Discharge Limits per Regulation 85 Annual Median a 95 th Percentile b Parameter Effluent Limit per Reg. 85 Effluent Limit per Reg. 85 Total Phosphorus (mg/l) Total Inorganic Nitrogen as N (mg/l) a Running Annual Median: The median of all samples taken in the most recent 12 calendar months. b 95th Percentile: The 95 th percentile of all samples taken in the most recent 12 calendar months. The City has proactively planned for modifications to the WWTP for nutrient removal based upon previous studies including the Wastewater Utility Plan and annual updates to the Wastewater Utility capital improvement plan (CIP). In addition, expansion of the plant s organic capacity due to future growth needs is also included in the CIP projects and is most effectively addressed in parallel with the nutrient improvements. The City will receive effluent limits for total inorganic nitrogen (TIN) and total phosphorus (TP) in the next discharge permit renewal (Colorado Wastewater Discharge Permit System Permit Number CO ). The current permit expires October 31, The purpose of this study is to review capital and operational requirements for implementing nutrient removal at the plant including capital costs, operations and maintenance costs, and footprint requirements. Process Modeling of Nutrient Removal Alternatives A model of the existing treatment facility was originally developed in support of the Step Feed Aeration Project in The model was again used in the development of the Wastewater Utility Plan (March 2010). The model was developed using CH2M HILL s Pro2D whole plant computer simulator. The existing plant model was modified to include the results of 2013 comprehensive wastewater characterization analysis completed by the City of Loveland. This characterization identified typical fractionation of the wastewater into different chemical oxygen demand (COD) components. In addition, the wastewater has been analyzed to determine typical volatile fatty acid (VFA) components, which are important for biological nutrient removal processes. This information was incorporated into the base process model to allow calibration of the model relative to the specific wastewater process performance parameters observed during the data collection period. In order to validate the model, plant data from 2013 was analyzed to establish running monthly average wastewater characteristics as well as plant operating conditions. A monthly running average was used as it dampens the normal daily variations in the observed data, and it is considered more representative of the response of the plant to longer term influent and operational conditions. From this data set, seven (7) EXECUTIVE SUMMARY_V3.DOCX ES-1
8 EXECUTIVE SUMMARY monthly snapshots were entered into the base process model to determine how well the model predicted the observed plant performance. The results of the validation process clearly illustrate that the Pro2D model predicts the actual plant performance within an acceptable degree of accuracy. For future conditions, the assumed maximum month flow and Biochemical Oxygen Demand (BOD) load for the future permit condition was defined as 12.0 mgd and 27,800 lb/day of BOD. Three seasonal conditions were modeled for each of the process alternatives: Winter: January March Spring/fall: April June and October December Summer: July September Three different secondary treatment process configurations were selected at a workshop with City staff on December 3, These configurations were selected with the following constraints in mind: Incorporation of existing secondary treatment facilities (basins and clarifiers) Emphasis on biological nitrogen and phosphorus removal using suspended growth, but with chemical addition if needed to meet phosphorus limits Potential to meet or exceed treatment targets under all three seasonal periods Similarity in operational complexity and reliability to the existing step feed process The three alternatives selected for analysis were: A2O Process Johannesburg (JHB) Process Step Feed Process All three alternatives consist of a series of bioreactor basin stages with differing oxygen availability (anaerobic, anoxic, and aerobic) to create conditions conducive to biological nutrient removal. Once the basic configurations of the three alternatives were determined, the base process model was modified to evaluate and size process facilities for the three alternatives. In addition, the alternatives were modeled with the future scenario of digested sludge dewatering centrate recycle return flow, as there is the potential that this process may be added in the future. Sludge dewatering is significant with respect to nutrient removal as the recycle from the process adds a relatively large increased loading of ammonia and phosphorus to the secondary treatment system. As such, the modeling was done both with and without sludge dewatering to ascertain the potential worst case impacts of dewatering without separate sidestream treatment. The three process alternatives are shown schematically below in Figures ES 1, ES 2, and ES 3. ES-2 EXECUTIVE SUMMARY_V3.DOCX
9 EXECUTIVE SUMMARY FIGURE ES 1 A2O Process Schematic FIGURE ES 2 JHB Process Schematic EXECUTIVE SUMMARY_V3.DOCX ES-3
10 EXECUTIVE SUMMARY FIGURE ES 3 Step Feed Process Schematic The goal of the modeling exercise was to develop a common process configuration and sizing that would accommodate all of these operating conditions. For all three alternatives, the process was initially sized and configured based on the existing available tankage, although the relative sizes of the various zones were adjusted as needed, assuming such modifications could be implemented within the existing basin structures. Based on this evaluation, it was then determined whether additional basin tankage and/or clarifiers would be needed. The modeling was an iterative process that was carried out until a process configuration and zone sizing was determined that would best meet the target effluent concentrations for all of the evaluated seasonal conditions. Since sludge dewatering may or may not be implemented in the future, different process sizing and configurations were determined for each of those two conditions, for all three seasons and for average and peak 18 day operating conditions to match the future permit limit basis. The modeling demonstrates that all three process alternatives are capable of meeting the anticipated permit limits for nutrients at the design flows and loadings. The A2O and JHB alternatives would require the addition of a third bioreactor train. Step Feed would not require a third bioreactor train, although offsetting that would be a slightly higher air requirement and the need for a sludge fermenter to assist with the biological phosphorus removal process. A fourth secondary clarifier is recommended for each of the alternatives to provide redundancy and meet CDPHE criteria with one clarifier out of service. Future addition of digested sludge dewatering could have a significant impact on the secondary treatment facilities if the recycle stream is returned to the secondary process. Modeling shows that a third bioreactor train is required for any of the process alternatives with dewatering recycle. While the A2O and JHB process alternatives include a train that would accommodate the recycled dewatering flows, it would need to be added for the Step Feed alternative. In addition, chemical feed (ferric chloride) is required for all alternatives to assist with phosphorus removal from dewatering sidestreams. Should the dewatering recycle stream be treated with a separate sidestream process, impacts on the secondary treatment process would be reduced. This option should be investigated in the future if sludge dewatering is to be implemented. Regardless, modeling shows that the three train configuration for any of the alternatives can accommodate dewatering recycle and meet nutrient limits. ES-4 EXECUTIVE SUMMARY_V3.DOCX
11 EXECUTIVE SUMMARY Nutrient Removal Alternative Development and Comparison Following the process modeling, the three alternatives were developed and compared. In developing the physical configuration of the plant modifications, each alternative was evaluated in terms of implementation in an operating plant, capital and relative operating costs, and non monetary considerations. The estimated capital costs for the alternatives are listed in Table ES 2 for comparison. TABLE ES 2 Capital Cost Estimates Alternative Total Estimated Capital Cost A2O $10,772,300 JHB $10,898,700 Step Feed $12,260,400 As shown, the estimated capital costs for the A2O and JHB alternatively are relatively close in magnitude, while the Step Feed alternative would be substantially more expensive to implement. Although the Step Feed alternative avoids the cost of a new third bioreactor train, that savings is offset by the gravity thickener/fermenter (and associated pump station and biofilter facility) and the requirement to replace all of the existing blowers. In order to assist in evaluating the potential annual cost impacts of the three alternatives, operating and maintenance costs were estimated for the alternatives. These costs are not intended to represent entire plant operation and maintenance costs, but rather are intended to reflect the differences among the alternatives. The costs were assessed over a 20 year operating period starting in 2013, with a discount rate of 3 percent (difference between inflation and potential earnings). The average annual plant flows over the 20 year period were assumed to vary from 6.45 mgd for 2013 to 9.13 mgd in 2033, based on population based flow projections used in the City s Capital Improvements Plan. The following annual cost components were included in each of the alternatives: Blower operating cost Mixed liquor recycle (MLR) pump operating cost (A2O and JHB only) Mixer operating cost Thickener/fermenter and associated pumping systems operating costs (Step Feed only) Facilities maintenance (assumed at 2 percent of construction cost) Most of these costs would vary with the annual plant flow, with the exception of the mixer cost and maintenance. The present worth of the annual costs for each alternative is shown in Table ES 3. TABLE ES 3 Operation and Maintenance Cost Estimates Alternative Present Worth of Annual Cost A2O $7,004,000 JHB $7,248,000 Step Feed $7,463,000 As shown, the O&M costs are relatively the same for the three alternatives, with the highest cost for the Step Feed alternative. EXECUTIVE SUMMARY_V3.DOCX ES-5
12 EXECUTIVE SUMMARY The total present worth cost for each alternative is summarized in Table ES 4. As shown, the total present worth cost for the Step Feed alternative is about $1.6 to 2.0M higher than that for the other two alternatives. This is primarily the result of capital cost being higher for that alternative, and to a lesser extent the annual costs being higher as well. TABLE ES 4 Total Present Worth Cost Estimates Alternative Present Worth Cost A2O $17,776,300 JHB $18,146,700 Step Feed $19,723,400 In addition to the development of comparative costs for the alternatives, non monetary comparisons were also developed. Table ES 5 summarizes the results of the non monetary comparison of alternatives, adjusted based on City input at a workshop. In this table, the alternatives are ranked relative to each non monetary issue. TABLE ES 5 Non Monetary Alternatives Comparison Issue A2O JHB Step Feed 1. Constructability; negative impacts on plant operations during construction 2. Ability to accommodate higher than projected future flows/loads Additional facilities required for future dewatering recycle Robustness of process Impacts on need for third primary clarifier Energy usage Impacts on operations (process control and additional facilities/processes) Total Score Note: Alternatives are rated from 1 to 5 relative to each non monetary aspect. A score of 5 is the most favorable for the specific alternative relative to the particular issue. As shown in Table ES 5, Step Feed comes in third place with respect to non monetary considerations. A benefit/cost ratio was developed for each alternative. This ratio is the non monetary score divided by the present worth cost estimate in $M. Figure ES 4 shows the benefit/cost ratio plotted along with the nonmonetary ranking for the alternatives. As shown, the benefit/cost ratio for the Step Feed alternative is much lower than for the other two alternatives. The JHB and A2O alternatives are approximately equal in terms of benefit/cost. Local experience (Fort Collins, Colorado Springs), however, seems to favor the JHB alternative, as there have been difficulties achieving low TP concentrations using the A2O process without supplemental carbon addition. Although the modeling does not necessarily indicate that difficulty occurring at the Loveland plant, future changes in wastewater characteristics may make that an issue in the future. Other local experience (Sand Creek WRF, Aurora) has shown the value of the RAS anoxic zone (included in the JHB process) in encouraging VFA formation in the downstream anaerobic zone to assist in the bio P process. ES-6 EXECUTIVE SUMMARY_V3.DOCX
13 EXECUTIVE SUMMARY FIGURE ES 4 Benefit/Cost Comparison The Step Feed process may be eliminated on the basis of cost alone. There are no overriding non monetary issues that would warrant the additional cost of that alternative. These are reflected in the benefit/cost ratio for this alternative, which is unfavorable. The A2O and JHB processes are essentially equal in terms of calculated capital and annual costs. Based on experience at other facilities, the JHB process is recommended over the A2O process due to the stability that the RAS anoxic zone brings with very little cost impact. Preferred Alternative Implementation In a workshop held on February 26, 2014, the JHB alternative was selected as the preferred alternative for meeting anticipated nutrient permits limits per the CDPHE Regulation 85. This selection was based on a consideration of both monetary and non monetary aspects of the alternative. Additional analysis of the preferred nutrient removal alternative was performed. Hydraulic Impacts Hydraulic profile modeling of the WWTP shows that it is feasible to implement the JHB process alternative and not adversely impact the plant hydraulic capacity. Results of Dynamic Modeling of the Preferred Alternative In order to provide better assurance of the ability of the proposed facility modifications and additions to reliably meet existing and upcoming permit limits, dynamic modeling of the preferred alternative (JHB) was performed. Although Pro2D has dynamic modeling capabilities, BioWin (Envirosim Associates) was instead used at the request of the City to allow comparison to previous dynamic modeling of the plant using BioWin completed in This allowed for direct input of wastewater characterization values used in the City s EXECUTIVE SUMMARY_V3.DOCX ES-7
14 EXECUTIVE SUMMARY BioWin model, and provided a check against the results of the Pro2D steady state modeling. The primary focus of the dynamic modeling of the diurnal flow and loads was to confirm the ability of the proposed alternative configuration and sizing to meet the anticipated TIN and TP permits limits, and to assess the air requirements for the bioreactors. The results of the BioWin modeling of the JHB alternative support the conclusions of the Pro2D modeling. Table ES 6 shows the results of the modeling relative to TIN and TP. TABLE ES 6 Biowin Diurnal Modeling Results Parameter/Condition Model Results Permit Limits TIN, mg/l Annual median 95 th percentile TP, mg/l Annual median 95 th percentile As shown, both permit conditions are met for both nutrients. This supports the conclusions of the Pro2D modeling. The other issue of interest from the diurnal modeling is related to air requirements. Table ES 7 lists the air requirements for various conditions determined through Pro2D modeling and BioWin modeling. TABLE ES 7 Air Requirement Comparison Condition Air Required (Pro2D Results), scfm Air Required (BioWin Results), scfm Average annual 9,400 9,800 Peak 18 day 11,600 11,200 As shown, the air requirements are relatively close for the two modeling efforts for average and peak 18 day conditions. The actual firm blower capacity should be based on meeting peak day average air requirements while maintaining a dissolved oxygen level of at least 2.0 mg/l. This can be extrapolated from modeling results based on relative BOD loadings. Overall, the dynamic modeling of the plant under simulated design conditions was a valuable exercise and confirmed the ability of the preferred alternative to meet the anticipated nutrient removal limits. Facilities Modifications to Meet Anticipated Potential Future More Stringent Effluent Requirements The preferred alternative is configured and sized to meet the anticipated regulatory discharge limits for TIN and TP per CDPHE Regulation 85. Future permit limits under the proposed Regulation 31 for total nitrogen or TN, which includes both organic and inorganic nitrogen and TP may be much more stringent, requiring modifications and additions to the plant treatment facilities. Although the exact values for the future limits are not specifically known, it is anticipated that they may be set at the limits of current treatment technology, or the following values: TN 3.0 mg/l permit limit TP 0.1 mg/l permit limit A typical bioreactor configuration that can be used to meet low TIN targets is the 5 Stage Bardenpho process. This process is shown in a schematic in Figure ES 5. ES-8 EXECUTIVE SUMMARY_V3.DOCX

15 EXECUTIVE SUMMARY FIGURE ES 5 5 Stage Bardenpho Process The 5 Stage Bardenpho Process was modeled using the same approach as for the other treatment alternatives for Regulation 85 in order to establish approximate sizing for the facilities. The first stage nutrient removal bioreactors would need to be modified to provide the configuration described above for the 5 Stage process. A methanol (or other carbon source) feed facility would be needed to provide supplemental carbon to the second anoxic zone. Filtration would be provided by a filtration facility containing approximately 2,000 ft 2 of filter area. Figure ES 6 shows a conceptual site plan for the future facilities. Implementation Schedule A schedule for project implementation is presented below in Figure ES 6. A request for preliminary effluent limits (PELs) should be made in late 2014 so that the effluent limits for nutrient removal which will appear in the next permit cycle can be confirmed prior to commencement of design. Design is scheduled to occur in 2015 with bidding of the construction project in early Construction is scheduled to occur over approximately 18 months during 2016 and EXECUTIVE SUMMARY_V3.DOCX ES-9
16
17 ' CH2M HILL
18 FIGURE ES-7 Project Implementation Schedule EXECUTIVE SUMMARY_V4.DOCX ES-11
19 The City has obtained a $1,000,000 design and construction grant for the nutrient removal project which must be spent by May 31, Most of the grant can be utilized for project design in 2015 and the remainder of the grant can be utilized for the initial construction activities in Should the City decide to delay construction of the nutrient removal facilities, the remainder of the grant could be utilized to purchase known equipment or materials which would be required for the project (e.g. blowers) to maximize the grant funding. From an operational standpoint, the nutrient removal facilities will add a new process (biological phosphorus removal) and an enhanced existing process (denitrification). Additional structural, mechanical, and electrical components will be added to the plant which will require additional operation and maintenance attention. Also, additional laboratory analyses will be required for both operation and compliance needs. It is estimated that additional full-time WWTP staff positions will be required for the combined needs of operations, maintenance, and laboratory. Training for nutrient removal operations is also recommended prior to startup of the new facilities. EXECUTIVE SUMMARY_V4.DOCX ES-12
20
21 Section 1 Modeling and Evaluation of Nutrient Removal Alternatives This section discusses the procedures and results of process modeling in support of evaluating alternatives for modifying the Loveland Wastewater Treatment Plant (WWTP) to achieve nutrient removal for upcoming effluent limits to effluent total inorganic nitrogen (TIN) and total phosphorus (TP). It describes the development, calibration, and validation of the base model of the existing plant, and the use of that model to evaluate and size selected plant modification alternatives. 1.1 Plant Model Development, Calibration and Validation A model of the existing treatment facility was originally developed in support of the Step Feed Project in The model was again used in the development of the Utility Plan (March 2010). The model was developed using CH2M HILL s Pro2D whole plant computer simulator. This simulator uses the commonly accepted mathematical model ASM2D developed by the International Water Association (IWA). It is the standard mathematical model used by all major process simulators, including GPS X by Hydromantis, and BioWin by EnviroSim Associates. The Pro2D simulator is preferred by CH2M HILL as it is associated with a cost estimating tool CPES, also developed by CH2M HILL, which facilitates development of facility cost estimates based on the plant model contained in Pro2D. It is also easily customizable, using Microsoft Excel as the underlying mathematical engine. The existing plant model, in its most recent form as used for the Utility Plan, was modified to include the results of recent wastewater characterization completed by the City of Loveland. This characterization, completed in 2013, identified typical fractionation of the wastewater into different chemical oxygen demand (COD) components. In addition, the wastewater has been analyzed to determine typical volatile fatty acid (VFA) components, which are important for biological nutrient removal processes. This information was incorporated into the base model. Table 1 1 lists the influent parameters that were targeted in model calibration. The Pro2D simulator, like other process simulators, includes various kinetic and stoichiometric parameters that are based on a wide range of experience in the wastewater industry. Other than adjustments made necessary to provide wastewater characteristics similar to those noted above, the default parameters were unchanged in the modeling. In order to validate the model, plant data from 2013 was analyzed to establish running monthly average wastewater characteristics as well as plant operating conditions. A monthly running average was used as it dampens the normal daily variations in the observed data, and it is more representative of the response of the plant to longer term influent and operational conditions. From this data set, seven (7) monthly snapshots were entered into the base model to determine how well the model predicted the observed plant performance. The specific 30 day periods tested were (ending date for each period): January 31, 2013 February 25, 2013 March 17, 2013 May 5, 2013 September 3, 2013 October 29, 2013 November 5, 2013 SECTION 1_MODELING AND EVALUATION OF NUTRIENT REMOVAL ALTERNATIVES_V4.DOCX 1-1
22 SECTION 1 MODELING AND EVALUATION OF NUTRIENT REMOVAL ALTERNATIVES TABLE 1 1 Wastewater Characterization Model Input Parameter Value COD, Nitrogen and Phosphorus fractionation: Readily biodegradable (g COD/g total COD) [Fbs] Acetate (g COD/g readily biodegradable COD) [Fac] Non colloidal slowly biodegradable (g COD/g of slowly degradable COD) [Fxsp] Unbiodegradable soluble (g COD/g of total COD) [Fus] Unbiodegradable particulate (g COD/g of total COD) [Fup] Ammonia (gnh3-n/gtkn( [Fna] Particulate organic nitrogen (gn/g Organic N) [Fnox] Soluble unbiodegradable TKN (gn/gtkn) [Fnus] N:COD ratio for unbiodegradable particulate COD (gn/gcod) FupN) Phosphate (gpo4-p/gtp) [Fpo4] P:COD ratio for unbiodegradable particulate COD (gp/gcod) [FupP] Soluble unbiodegradable TKN (gn/gtkn) [Fnus] Volatile Fatty Acids (VFA) Acetic (C2), mg/l 15.9 Propionic (C3), mg/l 3.5 Butyric (C4), mg/l 1.5 VFA equivalent COD, mg/l VSS, percent of TSS 94 % TKN, percent of NH 3 N 150 % Notes: 1 Based on plant data; COD equivalent = 1.07*C *C *C4 These dates were randomly selected, although the period of flooding on September 12, 2013 was avoided due to its unusual impact on wastewater characteristics and flows. The influent characteristics and key operating parameters entered into the model for each period are summarized in Table 1 2. An assumption that was made is that the influent Total Kjeldahl Nitrogen (TKN) concentration is 1.5 times the ammonia (NH3 N) concentration, the latter of which is recorded on a daily basis in the plant data. This ratio is supported by limited plant testing and is typical of most municipal wastewaters. Regarding plant operations, such parameters as dissolved oxygen level in the aeration basins, return activated sludge flow and calculated sludge age were obtained from the data. However, there are no records regarding the primary effluent (PE) flow split among the three Step Feed stages in the existing plant, although it is possible to apportion the PE among the various stages using adjustable weirs. Anecdotally, it is understood that the plant does adjust the flow split at various times throughout the year, but the specific flow split ratios are not certain. For the modeling, it was assumed that the flow was split among the stages in accordance with the recommendations in the Step Feed Operations and Maintenance (O&M) Manual. 1-2 SECTION 1_MODELING AND EVALUATION OF NUTRIENT REMOVAL ALTERNATIVES_V4.DOCX
23 SECTION 1 MODELING AND EVALUATION OF NUTRIENT REMOVAL ALTERNATIVES TABLE 1 2 Existing Plant Running Monthly Analysis Input Parameters Input Parameters Reference Date Avg Flow, mgd CBOD, mg/l TSS, mg/l NH3 N, mg/l TKN, mg/l TP, mg/l Temp, deg F Total SRT, days PC TSS Removal, % Basin DO, mg/l 1/31/ /25/ /17/ /5/ /3/ /29/ /5/ Note: Reference date is the day at the end of the 30 day running period. Another parameter of importance in the model setup is the percent TSS removal in the primary clarifiers. Based on the wastewater characteristics, there is an associated BOD removal (in various forms) that is determined based on the TSS removal rate, which in turn impacts secondary treatment loadings. Some limited data obtained for the plant indicates a removal rate of 70 percent TSS. This level of removal is atypical (unusually high) and is generally limited to plants that use chemical addition to achieve enhanced primary treatment. However, since this is recorded data, it was assumed for the modeling. Process modeling, even using the widely accepted and comprehensive mathematical ASM2D model as in the Pro2D simulator, is limited in its ability to predict actual plant performance. This is primarily the result of variations in wastewater characteristics that extend well beyond those indicated by simple measures such as CBOD and TSS, and even fractionated COD. In addition, the collected plant data can be subject to sampling and testing errors, and often certain data is not available and must be assumed. In validating a process model, therefore, it is not expected that the model will predict exactly the performance characteristics actually observed. The model is considered to be validated, however, if on the average over several cases the operational results are indicated reasonably well by the modeling. The analysis of the Loveland data is no exception to this common observation. The key operating parameters that were checked were mixed liquor suspended solids (MLSS), effluent ammonia, and effluent nitrate. The MLSS concentration reflects the sludge inventory, which is important in that it will form the basis of sizing future facilities in subsequent alternatives analysis. Among other things, basin sizing determines the MLSS concentration under a given set of operating conditions, which in turn establishes secondary clarifier loadings. The MLSS predicted by the model, averaged over the secondary treatment system, was compared with the plant operating data. This eliminated variations due to the Step Feed process, and reflected the total sludge inventory. Effluent ammonia and nitrate reflect the nitrification and denitrification processes, and these are critical effluent permit values for future alternatives evaluations. Since the existing plant both nitrifies and denitrifies, these are valid parameters to check against existing plant operation. Effluent TP was also checked, although the plant is not operated to remove phosphorus. There is a certain level of phosphorus removal inherent in biological treatment, however. An aspect of plant operation that could not be validated is that of clarifier performance in removing TSS (and the accompanying BOD). In all cases, the existing secondary clarifiers are currently underloaded, and it is only when clarifiers have been loaded to failure that the clarifier performance can be validated with a modeling exercise. However, Pro2D had a linked program called P Clarifier that was used during the subsequent alternative evaluation to assess potential SECTION 1_MODELING AND EVALUATION OF NUTRIENT REMOVAL ALTERNATIVES_V4.DOCX 1-3
24 SECTION 1 MODELING AND EVALUATION OF NUTRIENT REMOVAL ALTERNATIVES performance under future operating conditions using particle settling theory and empirical observations regarding the impacts of sludge settleability on clarifier performance. The results of the validation process are summarized in Table 1 3. With respect to MLSS concentration, the model prediction is both higher and lower than that observed in the data across the case studies. The overall average predicted by the model, however, is within about 7 percent of the observed data, which represents a reasonably good correlation. It is noted, however, that if a more typical primary clarifier TSS removal of 65 percent is assumed, the MLSS concentration would be within less than 1 percent of the data. The ammonia concentration is within 0.11 mg/l on average, which also represents excellent correlation. The existing plant only partially denitrifies, as evident in the effluent nitrate concentrations. The effluent nitrate concentration predicted by the modeling is within 2.6 mg/l on average of the observed data. While this represents reasonable correlation, it could also mean that the actual plant influent TKN was modestly higher than the values used, which was based on a ratio of TKN:NH3 N estimated from plant data. Alternatively, as noted by the operations staff, it is suspected that some backflow of aerated mixed liquor may be occurring from the Oxic zones back into the anoxic (ANX) zones. If a DO of 0.1 to 0.2 mg/l is assumed in the ANX zones, the effluent nitrate matches closely the nitrate observed. The effluent TP was within about 0.5 mg/l on average of the observed data. In summary, it appears that the base model of the existing plant does a good job of predicting actual plant performance in key areas, and it can be relied upon to predict performance of future plant modification alternatives. TABLE 1 3 Model Validation Results Effluent Ammonia, mg/l Validation Results Average MLSS, mg/l Effluent Nitrate, mg N/L Effluent Total Phosphorus, mg/l Reference Date Data Model Delta, mg/l Data Model Delta, mg/l Data Model Delta, mg/l Data Model Delta, mg/l 1/31/ /25/ /17/ /5/ /3/ /29/ /5/ N/D 11.7 Average Note: Reference date is the day at the end of the 30 day running period. 1.2 Data Analysis and Wastewater Parameter Development for Alternative Analysis Modeling As described above, the model validation procedure involved modeling of specific cases of historical data and comparing the model results with the actual plant performance. Sizing and analyzing future plant expansion/modification alternatives, on the other hand, requires that potential future flows and influent characteristics be determined so that the alternatives can be assessed relative to future critical operating conditions. The modified facilities must be able to reliably meet permit requirements while accommodating critical flows and loads that could occur. 1-4 SECTION 1_MODELING AND EVALUATION OF NUTRIENT REMOVAL ALTERNATIVES_V4.DOCX
25 SECTION 1 MODELING AND EVALUATION OF NUTRIENT REMOVAL ALTERNATIVES The current plant effluent permit includes limitations on ammonia for both 30 day average and daily maximum values. In addition, the permitted limits vary throughout the year. Table 1 4 lists the effluent ammonia limits in the existing permit. TABLE 1 4 Current Permit Effluent Ammonia Limits Month 30 Day Average, mg N/L 30 Day Target, mg N/L Daily Maximum, mg N/L Daily Max Target, mg N/L January February March April May June July August September October November December In order to meet the 30 day average limits, the plant must be operated to nitrify year round. The daily maximum values, particularly during the months of November through March, are relatively close to the 30 day limits and will require that reliable nitrification be provided. In order to allow for variations in plant operation and wastewater characteristics, target ammonia concentrations that are lower than the permit limits must be assumed. The allowable permit limits were adjusted to long term target values using the ratio of mean plant performance (treatment target) to the maximum allowable (permit limit) for various permit frequencies, as presented in Figure 9.9 in Biological Wastewater Treatment (Grady, Daigger, and Lim, 1999), included as Figure 1 1 herein. This figure suggests that a monthly permit limit should be multiplied by 0.6 to establish a long term treatment target under peak month conditions. This results in the 30 day ammonia targets as shown in Table 1 4. Likewise, for a daily maximum limit, a factor of 0.4 is applied resulting in the values list in Table 1 4. It is interesting to note that for December through February, the daily maximum target concentrations are approximately the same as the target values for the 30 day limit. SECTION 1_MODELING AND EVALUATION OF NUTRIENT REMOVAL ALTERNATIVES_V4.DOCX 1-5
26 SECTION 1 MODELING AND EVALUATION OF NUTRIENT REMOVAL ALTERNATIVES FIGURE 1 1 Figure 9.9 from Biological Wastewater Treatment (Grady, Daigger, and Lim, 1999) The upcoming limits for TIN and TP as per Colorado Department of Health and Environment Regulation 85 are listed in Table 1 5: TABLE 1 5 Anticipated Regulatory Discharge Limits per Regulation 85 Running Annual Median a 95 th Percentile b Parameter Effluent Limit per Reg. 85 Effluent Limit per Reg. 85 Total Phosphorus (mg/l) Total Inorganic Nitrogen as N (mg/l) a Running Annual Median: The median of all samples taken in the most recent 12 calendar months. b 95th Percentile: The 95 th percentile of all samples taken in the most recent 12 calendar months. 1-6 SECTION 1_MODELING AND EVALUATION OF NUTRIENT REMOVAL ALTERNATIVES_V4.DOCX
27 SECTION 1 MODELING AND EVALUATION OF NUTRIENT REMOVAL ALTERNATIVES The statistical basis for these limits is different from the current ammonia limits. The running annual median, although approximately the same value as the annual average for the Loveland WWTP data, is different from an annual average in that it is the middle daily value in a consecutive listing of daily values from low to high. As such, extreme individual data points at either end of the spectrum do not affect the median value against which the permit is applied. This is a relatively forgiving limit basis. The 95 th percentile limit, on the other hand, means that only 5 percent of the daily values collected throughout the year may exceed the limit. This is effectively like an 18 day running maximum. In support of this, an analysis of influent BOD loading data from 2010 through 2013 shows that the 95 th percentile loading value is only 3 percent higher than the maximum 18 day loading. Although the 18 day values are somewhat higher than peak monthly values, it was assumed that the 18 day frequency would be used for process modeling of various alternatives in order to address both monthly and 95 th percentile permit limitations in order to limit the numbers of analyses. This approach is conservative relative to the 30 day ammonia limits. In light of the basis for the permit limits, the plant influent data from 2010 through October 2013 was analyzed to determine relationships between flows and influent loadings of various frequencies. In addition, the plant data was broken into the following seasonal groups: Winter: January March Spring/fall: April June and October December Summer: July September These periods were selected based on similar previous studies, which show variations in wastewater temperatures and flow/loads that differentiate these periods of the year. The intent of the data analysis was to develop flows and loads to input to the plant model for each of the three seasonal conditions. The assumed maximum month flow and BOD load for the future permit condition are defined as 12.0 mgd and 27,800 lb/day of BOD. The maximum month flow was assumed to occur during the summer period as observed in plant data, whereas the maximum month BOD loading was assumed to potentially occur during any of the three seasonal periods. Indeed, plant data shows no particular seasonal pattern in BOD loading. In order to determine corresponding flows, and pollutant loadings for each season, plant data was analyzed to determine relationships of 18 day maximum flows for the various seasons. Relationships of BOD, TSS, and NH 3 N were developed both seasonally and as 18 day maximums. The values for TSS and NH3 N were based on an analysis of ratios to BOD loading, assuming those same ratios would occur during the peak BOD loading event. Wastewater temperature was likewise analyzed in this manner. Minimum temperature was determined for each season since that represents the most critical operating condition for the secondary treatment process, particularly nitrification. Tables 1 6 and 1 7 summarize the influent conditions that resulted for use in the process modeling. TABLE 1 6 Raw Wastewater Seasonal Average Values from Data Analysis Parameter Winter Spring/Fall Summer Avg flow, mgd Avg BOD load, lb/day 26,721 26,034 25,560 Avg BOD conc, mg/l Avg TSS conc, mg/l Avg NH3 N conc, mg/l Avg TKN conc, mg/l Avg Temp, deg F SECTION 1_MODELING AND EVALUATION OF NUTRIENT REMOVAL ALTERNATIVES_V4.DOCX 1-7
28 SECTION 1 MODELING AND EVALUATION OF NUTRIENT REMOVAL ALTERNATIVES TABLE 1 7 Raw Wastewater 18 Day Running Average Values from Data Analysis Parameter Winter Spring/Fall Summer Peak flow, mgd Peak BOD load, lb/day 28,407 28,706 29,019 Peak BOD conc, mg/l Peak TSS conc, mg/l Peak NH3 N conc, mg/l Peak TKN conc, mg/l Min Temp, deg F The effluent parameters of BOD5 and TSS are generally attainable if the secondary clarifiers are not overloaded. Effluent ammonia, however, is directly impacted by the operating sludge age, or solids retention time (SRT). The operating SRT for secondary treatment is primarily driven by the requirement to nitrify. Since the nitrifying organisms are affected by temperature more than the other organisms involved in secondary treatment, the SRT must be sufficient to accommodate the growth rate of the nitrifiers in the system. The theoretical minimum SRT for nitrification can be determined based on temperature, ph and dissolved oxygen (DO) level using the following equation (derived from Table 12 8, Wastewater Engineering: Treatment, Disposal Reuse, 1979):, 0.098( T 15) MinSludgeAge days (0.47)*( where: 1 )*( DO/(1.3 DO))*(1 (0.833*(7.2 ph))) 0.47 = Theoretical maximum specific growth rate for nitrifiers, day 1 T =Mixed liquor temperature (deg F) DO = Dissolved oxygen concentration (mg/l) [Note that the ph correction in the above equation only applies if the ph is less than 7.2. If the ph is greater than 7.2, the ph correction factor becomes 1.0.] The DO is the one parameter that the plant has control over through the aeration process. The ph is dependent on the influent alkalinity and the particular process configuration (whether the alkalinity adding benefit of denitrification occurs ahead of the nitrification process). The temperature, of course, is dependent solely on the influent wastewater characteristics. At the minimum 18 day temperature and an assumed ph of 7.0 (average, per the data), the minimum SRT for nitrification is shown in Table 1 8 for each season for two different DO levels. 1-8 SECTION 1_MODELING AND EVALUATION OF NUTRIENT REMOVAL ALTERNATIVES_V4.DOCX
29 SECTION 1 MODELING AND EVALUATION OF NUTRIENT REMOVAL ALTERNATIVES TABLE 1 8 Theoretical Minimum SRT for Nitrification (days) Season Dissolved Oxygen, mg/l Winter Spring/Fall Summer Seasonal Average Peak 18 Day Note: Assumes ph = 7.0 As shown, operating at a higher DO reduces the minimum SRT, but that adds significant operating cost. It is important to understand that these SRTs are theoretical only. Operating a plant at these SRTs under the corresponding conditions would leave no margin for error and would not accommodate diurnal variations and other naturally occurring imperfections in the process. In practice, an operating factor (OF) is applied to the minimum SRT values, whose value depends on the degree of nitrification needed. An analysis of data from the Metro Wastewater Reclamation District s Robert W. Hite Plant (Denver) done for the CTP Facility Plan (2003) found that to reliably meet an effluent ammonia of 2.5 mg/l (minimum 30 day target value as shown in Table 1 4), an OF of 1.70 is needed. That results in the operating SRT values shown in Table 1 9. TABLE 1 9 Operating SRT for Nitrification (days) Season Dissolved Oxygen, mg/l Winter Spring/Fall Summer Seasonal Average Peak 18 Day Note: Based on an Operating Factor (OF) of The OF values associated with the operating SRTs reported in the plant data from 2010 through 2013 are generally equal to, or higher than, the target value of 1.70, and generally greater than that necessary to meet the effluent ammonia permit limits. The average effluent ammonia concentration for the plant has ranged from 0.1 to 0.3 mg/l, far below the minimum effluent ammonia limit of 4.0 mg/l shown in Table 1 4. The longer the SRT that is used, the higher the sludge inventory that must be held under aeration, which directly impacts the MLSS concentration. This, in turn, directly affects the clarifier loadings. If a longer SRT than is needed is maintained, it increases the required tankage for future plant expansion alternatives. It is therefore important to minimize the assumed operating SRT to that needed to reliably nitrify, but no higher. For this reason, the operating SRTs determined above are assumed for the alternatives analysis and sizing. It is important to understand that these operating SRTs are selected to reliably meet the target effluent SECTION 1_MODELING AND EVALUATION OF NUTRIENT REMOVAL ALTERNATIVES_V4.DOCX 1-9
30 SECTION 1 MODELING AND EVALUATION OF NUTRIENT REMOVAL ALTERNATIVES ammonia concentrations. As such, the effluent ammonia concentrations that result from modeling may be significantly lower than the target effluent concentrations, However, since nitrification is a sensitive process that is affected by several operating conditions, including dissolved oxygen concentration, ph and temperature, it is important to operate the model at the determined SRT rather than attempt to dial in a specific ammonia concentration. It was necessary to assume certain other operational parameters to be applied to all of the modeling conditions. As discussed above, observed data indicates a primary clarifier TSS removal of 70 percent. However, this is unusually high, and a more conservative value of 65 percent TSS removal was assumed for the alternative evaluations. This was done in light of the higher design flows (12.0 mgd peak month) as compared to the much lower flows (5.3 to 7.0 mgd) associated with the model validation runs. The dissolved oxygen (DO) level in the aeration basins was assumed to be at 2.0 mg/l. Again, plant operating data shows that higher concentrations have often been maintained, but the use of a lower DO level is more conservative with respect to nitrification. Regarding nutrients, the 18 day average wastewater characteristics and operating parameters were assumed for complying with the future 95 th percentile limits for TIN and TP. For the peak 18 day condition, a safety factor of 1.75 was applied to the permit limits 95 th percentile concentrations for TIN and TP listed in Table 1 5. This results in 95 th percentile treatment targets of 1.40 mg/l and 11.4 mg/l for TP and TIN, respectively, under peak 18 day operation. For the annual median limits, a safety factor of 1.30 was assumed for the median limits, resulting in treatment targets of 0.77 mg/l and 11.5 mg/l for TP and TIN, respectively. The model was run under average conditions for each of the three seasons and a weighted average computed in order to assess the ability of the proposed plant modification alternatives to meet the annual median future permit limits CDHE Design Criteria The current wastewater design criteria (Colorado Design Criteria for Domestic Wastewater Treatment Works, WPC DR 1, September 2012) has specific requirements related to secondary clarifiers. Table 7 3 of the Criteria includes both hydraulic and solids loading rate limitations for secondary clarifiers. For the subject plant modifications, the hydraulic loading rate, or surface overflow rate (SOR) for peak month is 600 gpd/ft 2 (effluent TP = 1 mg/l). The solids loading rate (SLR) for peak month conditions is 29 lb/day ft 2. At a peak month flow of 12.0 mgd, the SOR with the existing three clarifiers in service would be 628 gpd/ft 2, exceeding the CDPHE criteria. Compliance with the SLR is dependent on the modeling results, discussed below. Another criteria relates to redundancy. With three clarifiers, the remaining two clarifiers must have at least 75 percent of the design capacity if one is off line. In other words, the SOR cannot exceed 800 gpd/ft 2, and the SLR cannot exceed 39 lb/day ft 2. The peak month SOR for two clarifiers would be 943 gpd/ft 2, which would significantly exceed the allowable SOR of 800 gpd/ft 2. On this basis alone, a fourth secondary clarifier would be required. The CDPHE criteria also address primary clarifiers. Table 6 1 of the Criteria lists an SOR range of 800 to 1,200 gpd/ft2 for primary clarifiers. The SOR for the two existing primary clarifiers at 12.0 mgd slightly exceeds this range at 1,256 gpd/ft2. Rather than assume adding a third primary clarifier, it may be possible to obtain a variance for this 5 percent exceedance. This may be justified in particular if a primary sludge thickener/fermenter is included in the plant modifications for nutrient removal, as discussed below. Use of a thickener allows for thin sludge primary clarifier operation, which is a proven approach to improving primary clarifier capacity /performance. Without a variance, the capacity of the primary clarifiers is 11.4 mgd per CDPHE design criteria SECTION 1_MODELING AND EVALUATION OF NUTRIENT REMOVAL ALTERNATIVES_V4.DOCX
31 1.2.2 Plant Modification Alternatives SECTION 1 MODELING AND EVALUATION OF NUTRIENT REMOVAL ALTERNATIVES Three different secondary treatment process configurations were selected at a workshop with City staff on December 3, These configurations were selected with the following constraints in mind: Incorporation of existing secondary treatment facilities (basins and clarifiers) Emphasis on biological nitrogen and phosphorus removal using suspended growth, but with chemical addition if needed to meet phosphorus limits Potential to meet or exceed treatment targets under all three seasonal periods Similarity in operational complexity and reliability to the existing Step Feed process The following paragraphs describe each of these three alternatives Alternative 1 A2O Process The A2O process, shown schematically in Figure 1 2, derives its acronym from Anaerobic/Anoxic/Oxic, which describes the basic treatment train. The wastewater (primary effluent, PE) is combined with return activated sludge (RAS) from the secondary clarifiers in the first zone (anaerobic or ANA), which is mixed but not aerated. This zone serves as a critical part of the biological phosphorus removal (bio P) process, where phosphorus accumulating organisms release phosphorus to gain stored energy and accumulate readily biodegradable organic material. In addition, more complex organic material is broken down by microorganisms into volatile fatty acids (VFAs), such as acetic acid, which are accumulated by the bio P organisms. In addition, any nitrate that is recycled along with the RAS is denitrified to nitrogen gas and released. The second zone (Anoxic) receives the flow from the anaerobic zone, and also a recycle flow stream (mixed liquor recycle, or MLR) from the end of the oxic zone. This recycled flow is rich in nitrate, and the anoxic zone is also mixed but not aerated so that the nitrate is reduced to nitrogen gas and released. The MLR is generally 300 to 400 percent of the PE flow, so that a large percentage of the nitrate is sent back through the Anoxic zone. The third zone (oxic) is aerated. In this zone organic material in the wastewater is oxidized and also incorporated into microorganism cell mass ( activated sludge ). In addition ammonia from the raw wastewater is nitrified to nitrate. As such, the ammonia concentration is reduced prior to discharge to the secondary clarifiers. FIGURE 1 2 A2O Process Schematic SECTION 1_MODELING AND EVALUATION OF NUTRIENT REMOVAL ALTERNATIVES_V4.DOCX 1-11
32 SECTION 1 MODELING AND EVALUATION OF NUTRIENT REMOVAL ALTERNATIVES This alternative would use the existing two train Step Feed tankage, and supplement it if necessary with a third parallel train. Modifications would be necessary to the existing tankage to provide the appropriately sized cells for the various zones. Likewise, the process would discharge to the three existing secondary clarifiers and to a fourth new clarifier Alternative 2 Johannesburg (JHB) Process The JHB process, shown in Figure 1 3, is similar to the A2O process, in that there are consecutive anaerobic/anoxic/oxic zones, with mixed liquor recycle from the oxic zone to the anoxic zone. The same basic functions of nutrient removal occur in each of these zones as described above for the A2O process. The major difference in the JHB process is the RAS anoxic zone. This zone, which receives only RAS, is mixed and not aerated to allow denitrification of the RAS. By reducing the oxygen and nitrate concentrations in the RAS before it is combined with the PE in the anaerobic zone, the anaerobic zone is more efficient in terms of producing VFAs for the bio P organisms and uptake of the same by the bio P microorganisms. This improves the performance of the bio P process by encouraging the growth of the bio P microorganisms. Plants with only the A2O process often need to add supplemental readily degradable organic material (such as methane) to achieve the same benefit. As with the A2O process, this alternative would use the existing two train Step Feed tankage, and supplement it if necessary with a third parallel train. Modifications would be necessary to the existing tankage to provide the appropriately sized cells for the various zones. Likewise, it would discharge to the three existing secondary clarifiers and to a fourth new clarifier. FIGURE 1 3 JHB Process Schematic Alternative 3 Step-Feed Process This alternative would retain much of the existing Step Feed basin configuration, but would add an anaerobic zone near the upstream end for the bio P process, as shown in Figure 1 4. The existing Step Feed process includes 3 stages. Each stage includes an anoxic zone followed by an oxic zone. In the revised first stage, RAS and PE would combine in an expanded anoxic zone. In this zone, the RAS would be denitrified and some fermentation would occur. In the next zone, overflow from a new primary sludge fermenter (basically a gravity thickener designed to hold sludge) would be combined with the mixed liquor from the first zone. This overflow would be rich in VFAs to help drive the bio P process in this anaerobic zone. The anaerobic zone would be configured in two stages, with the capability to add the fermenter overflow (FO) to 1-12 SECTION 1_MODELING AND EVALUATION OF NUTRIENT REMOVAL ALTERNATIVES_V4.DOCX
33 SECTION 1 MODELING AND EVALUATION OF NUTRIENT REMOVAL ALTERNATIVES either of the two zones. This would be followed by an oxic zone, where phosphorus uptake, BOD removal, and nitrification would occur. At the downstream end of the oxic zone, a small unaerated zone would be provided to reduce dissolved oxygen content before flowing into the next stage. The second and third stages would retain the existing configuration, with an anoxic zone followed by an oxic zone, although the relative sizes of the zones would be determined through process modeling. In addition, a small unaerated zone would be provided at the downstream end of the second stage similar to the first stage. The PE flow distribution among the three stages would be determined through modeling to best achieve the ammonia, TIN and TP effluent goals. As with the other two alternatives, a fourth secondary clarifier would be added to comply with CDPHE criteria. FIGURE 1 4 Step Feed Process Schematic Modification Alternative Modeling and Sizing With the basic configurations of the three alternatives determined, the base model was modified in order to be used to evaluate and size the three alternatives. The alternatives were evaluated for the average and peak 18 day flows and loads, and for the winter, spring fall and summer seasonal conditions for each of these loading scenarios as described above. In addition, the alternatives were also modeled with digested sludge dewatering implemented. The existing plant does not include sludge dewatering, although there is the potential that may be added in the future. Sludge dewatering is significant with respect to nutrient removal as the recycle from the process adds a relatively large increased loading of ammonia and phosphorus to the secondary treatment system. As such, the modeling was done both with and without sludge dewatering to ascertain the potential impacts of dewatering. The recycle from the sludge dewatering system was assumed to be added prior to the primary clarifiers. Alternatively, the recycle could be added ahead of the bioreactors, or could be treated separately. The latter should be considered if dewatering is to be implemented, although it was beyond the scope of the modeling effort to determine the optimum location for recycle from the dewatering process. The goal of the modeling exercise was to develop a common process configuration and sizing that would accommodate all of these operating conditions. For all three alternatives, the process was initially sized and SECTION 1_MODELING AND EVALUATION OF NUTRIENT REMOVAL ALTERNATIVES_V4.DOCX 1-13
34 SECTION 1 MODELING AND EVALUATION OF NUTRIENT REMOVAL ALTERNATIVES configured based on the existing available tankage, although the relative sizes of the various zones were adjusted as needed, assuming such modifications could be implemented within the existing basin structures. Based on this evaluation, it was then determined whether additional basin tankage and/or clarifiers would be needed. The modeling was an iterative process that was carried out until a process configuration and zone sizing was determined that would best meet the target effluent concentrations for all conditions. Since sludge dewatering may or may not be implemented in the future, different process sizing and configurations were determined for each of those two conditions, for all three seasons and for average and peak 18 day operating conditions. In order to determine compliance with the annual median condition, the weighted average model results for the three seasons were determined. A weighted average was used since spring fall encompasses 6 months. For the peak 18 day condition, each seasonal model result was compared with the effluent targets for TIN and TP to assess compliance during that season. The targets had to be met under all three seasons. The results of the evaluations are discussed for each alternative in the following Alternative 1 -- A2O Process As discussed above, the process evaluation and sizing for the A2O process was first done assuming no dewatering of digested sludge. The peak 18 day condition was evaluated first, and then the average condition was checked against the same process sizing. If issues were encountered with the average condition, the configuration was adjusted and rechecked against the peak 18 day condition. Although a fourth secondary clarifier was determined to be necessary to meet CDPHE redundancy criteria, the modeling results are reported both with the existing three clarifiers, and with a new fourth clarifier, in case a decision is made to request a variance for meeting the redundancy criteria. Table 1 10 summarizes the results of the modeling. As shown, the permit limit target concentrations for NH3 N, TIN and TP would be met under all conditions with the sizing and configuration developed for the A2O process. The A2O alternative was modeled both with two trains (assuming conversion of the existing two trains) and with a parallel third train. The first segment of the table is with two converted trains. With two trains and the three existing clarifiers, the solids loading rate (SLR) for the secondary clarifiers would exceed the CDPHE design criteria for peak month (similar to peak 18 day) of a maximum of 29 lb/ft 2 day as discussed above, even though modeling using PClarifier shows that the clarifiers would be able to accommodate the SLRs determined by the process model, assuming reasonable sludge settleability (SVI = 150 ml/g). If a clarifier is out of service, or sludge bulking occurs, however, the clarifiers would be overloaded with SLRs of lb/ft 2 day. This would also violate the 75 percent capacity requirement of CDPHE with one clarifier out of service. Adding a fourth clarifier, as shown in the table, would significantly reduce the clarifier loadings, pushing them below the CDPHE criteria with all clarifiers in service, and retaining reasonable loadings with one clarifier out of service while also meeting CDPHE redundancy criteria. Another approach to reducing clarifier loadings would be to add a third bioreactor train, which would reduce the MLSS concentration due to the additional basin volume. The result of this is shown in the second segment of the table. This approach would eliminate the need for a fourth clarifier based on SLR, with the loadings in a reasonable range even with one clarifier out of service, and CDPHE redundancy criteria limitation (38.0 lb/day ft 2 ) met under all conditions. However, the clarifier hydraulic loading rate with one clarifier out of service would exceed the CDPHE criteria, requiring a fourth clarifier regardless. The third segment of the table shows the impacts of digested sludge dewatering under the worst case scenario of treating the entire sidestream in the main bioreactor basins and assuming no separate sidestream treatment. This approach is a check on the maximum loading and required tankage for the secondary process. Under this scenario, the recycle from the dewatering process would be returned to the plant flow upstream of the primary clarifiers. The impact of the BOD, TSS ammonia and phosphorus contained in that recycle stream is evident in the modeling results. When compared with the second segment of the table (3 trains but with no dewatering), the mixed liquor concentration and clarifier loadings increase, as would be expected. In addition, a significant amount of ferric chloride was added in the model 1-14 SECTION 1_MODELING AND EVALUATION OF NUTRIENT REMOVAL ALTERNATIVES_V4.DOCX
35 SECTION 1 MODELING AND EVALUATION OF NUTRIENT REMOVAL ALTERNATIVES to assist with phosphorus removal. The ferric chloride was added to the primary clarifier influent, and ranged from 7 to 13 mg/l (500 to 1,300 lb/day) as ferric chloride. It was not possible to meet the effluent TP target without the addition of ferric chloride. The chemical addition would add a significant operating cost to this alternative if sludge dewatering is implemented in the future. It would also be necessary to provide 3 trains and a fourth clarifier to comply with CDPHE criteria when dewatering sludge. TABLE 1 10 A2O Alternative Modeling Results Effluent Results, mg/l Condition No. Trains/Clars NH3 N TIN TP MLSS, mg/l Sec Clar SLR, lb/ft 2 day Air, scfm No Dewatering (2 Trains) 4 Peak 18 Day Winter Spring Fall Summer 2/ ,300 4,100 3, (46.5) (53.9) 29.4 (44.1) 13,400 13,000 12,500 Peak 18 Day Winter Spring Fall Summer 2/ (31.0) 26.6 (35.4) 22.1 (29.4) Average Winter Spring Fall Summer Weighted Avg 2/ ,900 3,100 2, (41.1) (34.1) 20.2 (30.3) 11,700 10,500 9,700 Average Winter Spring Fall Summer 2/ (27.4) 17.0 (22.7) 15.2 (20.2) No Dewatering (3 Trains) 4 Peak 18 Day Winter Spring Fall Summer 3/ ,900 2,800 2, (36.2) 20.7 (31.1) 19.6 (29.4) 11,200 10,900 10,600 Peak 18 Day Winter Spring Fall Summer 3/ (24.1) 15.5 (20.7) 14.7 (19.6) Average Winter Spring Fall Summer Weighted Avg 3/ ,600 2,100 1, (27.6) 15.2 (22.8) 13.5 (20.3) 9,900 9,000 8,400 Average Winter Spring Fall Summer 3/ (18.4) 11.4 (15.2) 10.1 (13.5) SECTION 1_MODELING AND EVALUATION OF NUTRIENT REMOVAL ALTERNATIVES_V4.DOCX 1-15
36 SECTION 1 MODELING AND EVALUATION OF NUTRIENT REMOVAL ALTERNATIVES TABLE 1 10 A2O Alternative Modeling Results Effluent Results, mg/l Condition No. Trains/Clars NH3 N TIN TP MLSS, mg/l Sec Clar SLR, lb/ft 2 day Air, scfm Dewatering Ferric Chloride Addition (3 Trains) 4 Peak 18 Day Winter (7.0) 3 Spring Fall (10.0) Summer (13.0) 3/ ,100 3,900 3, (44.9) 34.0 (51.0) 30.0 (45.0) 14,000 13,500 12,900 Peak 18 Day Winter (7.0) Spring Fall (10.0) Summer (13.0) 3/ (29.9) 25.5 (34.0) 22.5 (30.0) Average Winter (10.0) Spring Fall (10.0) Summer (10.0) Weighted Avg 3/ ,600 3,000 2, (38.9) 22.1 (33.2) 21.1 (31.7) 11,700 10,800 9,900 Average Winter (10.0) Spring Fall (10.0) Summer (10.0) 3/ (25.9) 16.6 (22.1) 15.8 (21.1) Notes: 1 Value in parentheses is with one of three clarifiers out of service. 2 Values unchanged with 4 th clarifier 3 Ferric chloride dose added to primary clarifiers 4 RAS rate: 75% Table 1 11 lists the basin sizes that resulted from the modeling. The volumes are listed both for no sludge dewatering and for sludge dewatering being implemented. As noted, the relative sizes of the various zones were maintained for both the 2 train and 3 train options, although the relative sizes were changed for the sludge dewatering option as needed to achieve the necessary treatment. TABLE 1 11 A2O Relative Zone Sizes Condition ANA ANX OXIC Total No Dewatering Percent Volume Volume, mgal 2 Trains 3 Trains Dewatering Percent Volume Volume, mgal 3 Trains 8.0 % % % % % % % % SECTION 1_MODELING AND EVALUATION OF NUTRIENT REMOVAL ALTERNATIVES_V4.DOCX
37 Alternative 2 -- JHB Process SECTION 1 MODELING AND EVALUATION OF NUTRIENT REMOVAL ALTERNATIVES The approach to evaluating the JHB process was very similar to that used for the A2O process. The process evaluation and sizing for the JHB process was first done assuming no dewatering of digested sludge. The peak 18 day condition was evaluated first, and then the average condition was checked against the same process sizing. If issues were encountered with the average condition, the configuration was adjusted and rechecked against the peak 18 day condition. Although a fourth secondary clarifier was determined to be necessary to meet CDPHE redundancy criteria, the modeling results are reported both with the existing three clarifiers, and with a new fourth clarifier, in case a decision is made to request a variance for meeting the redundancy criteria. Table 1 12 summarizes the results of the modeling of the JHB process. As shown, the permit limit targets for NH3 N, TIN and TP would be met under all conditions with the sizing and configuration developed for the JHB process. The JHB alternative was modeled both with two trains (assuming conversion of the existing two trains) and with a parallel third train. The first segment of the table is with two converted trains. As with the A2O alternative, with two trains and the three existing clarifiers, the solids loading rate (SLR) for the secondary clarifiers would exceed the CDPHE design criteria for peak month of a maximum of 29 lb/ft 2 day, even though modeling using PClarifier shows that the clarifiers would be able to accommodate the SLRs determined by the process model, assuming reasonable sludge settleability (SVI = 150 ml/g). If a clarifier is out of service, or sludge bulking occurs, however, the clarifiers would be overloaded with SLRs of lb/ft 2 day. This would also violate the 75 percent capacity requirement of CDPHE with one clarifier out of service. Adding a fourth clarifier, as shown in the table, would significantly reduce the clarifier loadings, pushing them below the CDPHE criteria with all clarifiers in service, and retaining reasonable loadings with one clarifier out of service while also meeting the CDPHE redundancy criteria. As with A2O, the potential exists to reduce clarifier loadings by adding a third bioreactor train, which would reduce the MLSS concentration due to the additional basin volume. The result of this is shown in the second segment of the table. This approach could eliminate the need for a fourth clarifier based on SLR, with the loadings in a reasonable range even with one clarifier out of service, although the CDPHE redundancy criteria limitation (38 lb/day ft 2 ) would be exceeded in some cases. However, the clarifier hydraulic loading rate with one clarifier out of service would exceed the CDPHE criteria, requiring a fourth clarifier regardless. The third segment of the table shows the impacts of digested sludge dewatering. The recycle from that process would be returned to the plant flow upstream of the primary clarifiers. The impact of the BOD, TSS ammonia and phosphorus contained in that recycle stream is evident in the modeling results. When compared with the second segment of the table (3 trains but with no dewatering), the mixed liquor concentration and clarifier loadings increase, similar to that seen with the A2O process. In addition, a significant amount of ferric chloride was added in the model to assist with phosphorus removal. The ferric chloride was added to the primary clarifier influent, and ranged from 7 to 13 mg/l (500 to 1,300 lb/day) as ferric chloride. It was not possible to meet the effluent TP target without the addition of ferric chloride. As with A2O, the chemical addition would add a significant operating cost to this alternative if sludge dewatering is implemented in the future. It would also be necessary to provide 3 trains and a fourth clarifier to comply with CDPHE criteria when dewatering sludge. SECTION 1_MODELING AND EVALUATION OF NUTRIENT REMOVAL ALTERNATIVES_V4.DOCX 1-17
38 SECTION 1 MODELING AND EVALUATION OF NUTRIENT REMOVAL ALTERNATIVES TABLE 1 12 JHB Alternative Modeling Results Effluent Results, mg/l Condition No. Trains/Clars NH3 N TIN TP MLSS, mg/l Sec Clar SLR, lb/ft 2 day Air, scfm No Dewatering (2 Trains) 4 Peak 18 Day Winter Spring Fall Summer 2/ ,500 4,300 3, (48.6) (56.4) 33.6 (50.4) 13,900 13,600 13,100 Peak 18 Day Winter Spring Fall Summer 2/ (32.4) 28.2 (37.6) 25.2 (33.6) Average Winter Spring Fall Summer Weighted Avg 2/ ,100 3,300 2, (43.1) 23.8 (35.7) 23.2 (34.8) 12,200 11,000 10,100 Average Winter Spring Fall Summer 2/ (28.7) 17.9 (23.8) 17.4 (23.2) No Dewatering (3 Trains) 4 Peak 18 Day Winter Spring Fall Summer 3/ ,000 2,900 2, (32.6) 25.2 (37.8) 22.5 (33.8) 11,600 11,400 11,000 Peak 18 Day Winter Spring Fall Summer 3/ (21.7) 18.9 (25.2) 16.9 (22.5) Average Winter Spring Fall Summer Weighted Avg 3/ ,700 2,200 1, (28.8) 16.0 (24.0) 15.5 (23.3) 10,200 9,300 8,700 Average Winter Spring Fall Summer 3/ (21.7) 18.9 (25.2) 16.9 (22.5) Dewatering Ferric Chloride Addition (3 Trains) 4 Peak 18 Day Winter (7.0) Spring Fall (10.0) Summer (13.0) Peak 18 Day Winter (7.0) 3/3 3/ ,800 3,600 3, (41.3) 31.2 (46.8) 27.7 (41.6) 13,700 13,200 12, (27.5) 1-18 SECTION 1_MODELING AND EVALUATION OF NUTRIENT REMOVAL ALTERNATIVES_V4.DOCX
39 SECTION 1 MODELING AND EVALUATION OF NUTRIENT REMOVAL ALTERNATIVES TABLE 1 12 JHB Alternative Modeling Results Effluent Results, mg/l Condition Spring Fall (10.0) Summer (13.0) Average Winter (10.0) Spring Fall (10.0) Summer (10.0) Weighted Avg Average Winter (10.0) Spring Fall (10.0) Summer (10.0) No. Trains/Clars 3/3 3/4 NH3 N TIN TP MLSS, mg/l Sec Clar SLR, lb/ft 2 day Notes: 1 Value in parentheses is with one of three clarifiers out of service. 2 Values unchanged with 4th clarifier 3 Ferric chloride dose added to primary clarifiers 4 RAS rate: 75% ,400 3,200 2, (31.2) 20.8 (27.7) 23.8 (35.7) 23.4 (35.1) 19.4 (29.1) 17.9 (23.8) 17.6 (23.4) 14.6 (19.4) Air, scfm 10,500 10,000 8,900 Table 1 13 lists the basin sizes that resulted from the modeling. The volumes are listed both for no sludge dewatering and for sludge dewatering being implemented. As noted, the relative sizes of the various zones were maintained for both the 2 train and 3 train options, although the relative sizes were adjusted for the sludge dewatering option as needed to achieve the necessary treatment. TABLE 1 13 JHB Relative Zone Sizes Condition RAS ANX ANA ANX OXIC Total No Dewatering Percent Volume Volume, mgal 2 Trains 3 Trains Dewatering Percent Volume Volume, mgal 3 Trains 3.0 % % % % % % % % % Alternative 3 Step-Feed Process The approach to evaluating the Step Feed process was very similar to that used for the A2O and JHB processes. The process evaluation and sizing for the Step Feed process was first done assuming no dewatering of digested sludge. The peak 18 day condition was evaluated first, and then the average condition was checked against the same process sizing. If issues were encountered with the average condition, the configuration was adjusted and rechecked against the peak 18 day condition. Although a fourth secondary clarifier was determined to be necessary to meet CDPHE redundancy criteria, the modeling results are reported both with the existing three clarifiers, and with a new fourth clarifier, in case a decision is made to request a variance for meeting the redundancy criteria. SECTION 1_MODELING AND EVALUATION OF NUTRIENT REMOVAL ALTERNATIVES_V4.DOCX 1-19
40 SECTION 1 MODELING AND EVALUATION OF NUTRIENT REMOVAL ALTERNATIVES Table 1 14 summarizes the results of the modeling of the Step Feed process. Since the Step Feed process more efficiently utilizes the bioreactor tankage, it was hoped that this process might be able to meet the treatment needs with only the two existing trains, modified to add bio P and improve the denitrification process. In addition, a primary sludge fermenter would be used with this alternative to assist with the bio P process. The overflow from this process would be directed into the ANA zone to augment the incoming soluble BOD. With the Step Feed process, all of the RAS is discharged into the upstream end of the bioreactor, but the primary effluent is distributed among the three stages. In order to improve bio P and denitrification, more flow was shifted to the second and, in particular, the third stage. The flow distribution among the stages was set at 20/30/50. By reducing the volumetric flow through the first two stages, the detention time in the ANA and ANX zones was increased. The trade off is that a certain amount of ammonia washout would occur from the third stage, resulting in the higher effluent ammonia concentrations for this configuration. This does not reflect relative instability of the nitrification process, as the same aerobic SRT was used as was determined for the alternatives analysis described earlier. The effluent ammonia concentrations were all below the target value in spite of the partial washout from the flow distribution. As shown, the permit limits for NH3 N, TIN and TP would be met under all conditions with the sizing and configuration developed for the Step Feed process. The Step Feed alternative was modeled both with two trains (assuming conversion of the existing two trains) and with a parallel third train. The first segment of the table is with two converted trains. Unlike the A2O and JHB alternatives, with two trains and the three existing clarifiers, and no digested sludge dewatering, the solids loading rate (SLR) for the secondary clarifiers would come close to meeting the CDPHE design criteria for peak month (similar to peak 18 day) of a maximum of 29 lb/ft 2 day. Alternatively the flow distribution could be adjusted modestly to feed more to the third Step Feedeed point when a secondary clarifier is out of service to further lower the bioreactor effluent MLSS concentration and the clarifier solids loading rate. Adding a fourth clarifier, as shown in the table, would significantly reduce the clarifier loadings, but does not appear necessary to provide reliable treatment. However, per CDPHE redundancy criteria, a fourth clarifier would be needed regardless. Adding a third parallel train would reduce clarifier loadings, as shown in second segment of the table, and would allow for CDPHE redundancy criteria to be met with the existing three clarifiers based on SLR. However, the clarifier hydraulic loading rate with one clarifier out of service would exceed the CDPHE criteria, requiring a fourth clarifier regardless. The third segment of the table shows the impacts of digested sludge dewatering. As with the other alternatives, the recycle from that process would be returned to the plant flow upstream of the primary clarifiers. The impact of the BOD, TSS ammonia and phosphorus contained in that recycle stream is evident in the modeling results. When compared with the second segment of the table (3 trains but with no dewatering), the mixed liquor concentration and clarifier loadings increase, similar to that seen with the A2O and JHB processes. In addition, a significant amount of ferric chloride was added in the model to assist with phosphorus removal. The ferric chloride was added to the primary clarifier influent, and ranged from 7 to 10 mg/l (500 to 1,000 lb/day) as ferric chloride. A somewhat lesser amount of ferric chloride was indicated for certain conditions with the Step Feed process. It was not possible to meet the effluent TP target without the addition of ferric chloride, even with the primary sludge fermenter in service. As with the A2O and JHB processes, the chemical addition would add a significant operating cost to this alternative if sludge dewatering is implemented in the future. It would also be necessary to provide 3 trains and a fourth clarifier to comply with CDPHE criteria when dewatering sludge SECTION 1_MODELING AND EVALUATION OF NUTRIENT REMOVAL ALTERNATIVES_V4.DOCX
41 SECTION 1 MODELING AND EVALUATION OF NUTRIENT REMOVAL ALTERNATIVES TABLE 1 14 Step Feed Alternative Modeling Results Effluent Results, mg/l Condition No. Trains/Clars NH3 N TIN TP MLSS, mg/l Sec Clar SLR, lb/ft 2 day Air, scfm No Dewatering (2 Trains) 4 Peak 18 Day Winter Spring Fall Summer 2/ ,600 3,500 2, (36.0) (41.6) 24.8 (37.2) 14,400 14,200 13,800 Peak 18 Day Winter Spring Fall Summer 2/ (24.0) 20.8 (27.7) 18.6 (24.8) Average Winter Spring Fall Summer Weighted Avg 2/ ,300 2,600 2, (32.0) 17.8 (26.7) 17.2 (25.8) 12,400 11,300 10,500 Average Winter Spring Fall Summer 2/ (21.3) 13.4 (17.8) 12.9 (17.2) No Dewatering (3 Trains) 4 Peak 18 Day Winter Spring Fall Summer 3/ ,400 2,300 2, (24.5) 18.7 (28.1) 16.8 (25.2) 12,700 12,500 12,100 Peak 18 Day Winter Spring Fall Summer 3/ (16.3) 14.0 (18.7) 12.6 (16.8) Average Winter Spring Fall Summer Weighted Avg 3/ ,200 1,800 1, (21.6) 12.1 (18.2) 11.7 (17.8) 11,000 9,900 9,200 Average Winter Spring Fall Summer 3/ (14.4) 9.1 (12.1) 8.8 (11.7) Dewatering Ferric Chloride Addition (3 Trains and 3 Clarifiers) 5 Peak 18 Day Winter (9.0) Spring Fall (8.0) Summer (8.0) Peak 18 Day Winter (9.0) 3/3 3/ ,400 3,300 2, (37.4) 27.8 (41.7) 25.1 (37.7) 16,100 16,000 15, (24.9) SECTION 1_MODELING AND EVALUATION OF NUTRIENT REMOVAL ALTERNATIVES_V4.DOCX 1-21
42 SECTION 1 MODELING AND EVALUATION OF NUTRIENT REMOVAL ALTERNATIVES TABLE 1 14 Step Feed Alternative Modeling Results Effluent Results, mg/l Condition Spring Fall (8.0) Summer (8.0) Average Winter (8.0) Spring Fall (10.0) Summer (10.0) Weighted Avg Average Winter (8.0) Spring Fall (10.0) Summer (10.0) No. Trains/Clars 3/3 3/4 NH3 N TIN TP MLSS, mg/l Sec Clar SLR, lb/ft 2 day Notes: 1 Value in parentheses is with one of three clarifiers out of service. 2 Values unchanged with 4 th clarifier 4 RAS rate: 60% 5 RAS rate: 75% ,200 3,000 2, (27.8) 18.8 (25.1) 22.9 (34.4) 22.4 (33.6) 18.7 (28.1) 17.2 (22.9) 16.8 (22.4) 14.0 (18.7) Air, scfm 13,200 12,500 11,200 Table 1 15 lists the basin sizes that resulted from the modeling. The volumes are listed both for no sludge dewatering and for sludge dewatering being implemented. With no dewatering, only the 2 train option is shown since it does not appear necessary to provide a third train for this option. TABLE 1 15 Step Feed Relative Zone Sizes Stage 1 Stage 2 Stage 3 Condition ANX ANA OXIC ANX OXIC ANX OXIC Total No Dewatering Percent Volume Volume, mgal 2 Trains Dewatering Percent Volume Volume, mgal 3 Trains 5.0 % % % % % % % % % % % % Note: Primary effluent flow split among the step feed stages assumed to be 20/30/50 for Stages 1/2/ % % % % 4.24 An alternate approach to the Step Feed alternative would be to add an anaerobic zone upstream of the existing basins in lieu of the primary sludge fermenter. This zone would potentially create the VFAs necessary for the bio P process. Such an approach would require modifications to the Influent Structure at the west end of the existing trains to deliver a portion of the primary effluent to the basin, and return the mixed liquor to the upstream end of the existing trains. This would require significant structural modifications, both for the elevated wastewater level and for the flow splitting. Alternatively, the PE pipe could be intercepted in the yard and the flow split accomplished at the new basin. The Aeration Lift Pump Station (ALPS) pumps would likely need to be replaced to accommodate a higher hydraulic grade line, necessary to convey flow through the new ANA basin and back to the existing trains. The RAS flow would be 1-22 SECTION 1_MODELING AND EVALUATION OF NUTRIENT REMOVAL ALTERNATIVES_V4.DOCX
43 SECTION 1 MODELING AND EVALUATION OF NUTRIENT REMOVAL ALTERNATIVES redirected to the new basin. The effluent from the ANA basin would be returned to the east side of the influent structure and the flow conveyed from there to the existing trains as is currently done. Modeling shows that this concept could meet the treatment targets for nutrients, although mixed liquor recycle would be required from the first OXIC zone to the first ANX zone (upstream end of the existing trains) in order to meet the effluent TIN target. Although this alternative could potentially meet the treatment requirements, a major drawback is that without the fermenter it would be highly dependent on influent wastewater characteristics to assure adequate VFA formation in the biological phosphorus removal process, and would therefore not be as reliable as the other processes. Also, it would not easily accommodate the addition of a third parallel train in the future that would be necessary if sludge dewatering is implemented with recycle to the bioreactors. For these reasons, it was not considered further for the Step Feed alternative Impact of Higher Influent TKN As noted above, the calibrated model underestimated the observed effluent nitrate nitrogen by an average of 2.6 mg/l. This could be because actual influent TKN concentrations are slightly higher than the value of 1.5 x influent ammonia nitrogen used in this analysis, which was based on a limited amount of actual data. As noted above, the effluent TIN values predicted for each of the three alternatives evaluated were consistently less than the target values. Thus, even if actual effluent TIN values are higher than predicted by this amount, the plant would still be in compliance with effluent TIN goals Summary and Recommendations The modeling demonstrates that all three process alternatives are capable of meeting the anticipated permit limits for nutrients at the design flows and loadings. The A2O and JHB alternatives would require the addition of a third bioreactor train. Step Feed would not require a third bioreactor train, although offsetting that would be a slightly higher air requirement. A fourth secondary clarifier is recommended for any of the alternatives to provide redundancy and ensure that CDPHE criteria are not exceeded with one clarifier out of service. Future addition of digested sludge dewatering could have a significant impact on the secondary treatment facilities if the recycle stream is returned to the secondary process. Modeling shows that a third bioreactor train would be required for any of the process alternatives with dewatering recycle. While the A2O and JHB processes would already have that train in place, it would need to be added for the Step Feed alternative. In addition, chemical feed (ferric chloride) would be needed for all alternatives to assist with phosphorus removal. On the other hand, if the dewatering recycle stream is treated with a separate sidestream process, impacts on the secondary treatment process would be minimized. This option should be investigated in the future if sludge dewatering is to be implemented. Regardless, modeling shows that the three train configuration for any of the alternatives could accommodate dewatering recycle and meet nutrient limits. With all of the alternatives, it was found that the effluent TP target of 0.75 mg/l, for the annual median condition, is just met or is slightly exceeded. Even though all of the processes would virtually eliminate the soluble phosphorus components, the effluent TSS from the secondary clarifiers directly impacts the TP concentration due to the phosphorus that is bound up in the microorganisms that comprise the TSS. The modeling assumed a relatively conservative value of 15 mg/l for secondary effluent TSS. Plant records, however, show a history of lower TSS concentrations. The average secondary effluent TSS concentration for the period from 2010 through 2013 was 6 to 7 mg/l. The average peak 18 day concentration was 11 mg/l. These concentrations can significantly affect the effluent TP. For example, a secondary effluent TSS concentration of 11.0 mg/l (versus 15.0 mg/l) is shown by the modeling to reduce effluent TP for one case from 0.75 mg/l to 0.60 mg/l. A TSS concentration of 7.0 mg/l would further reduce the effluent TP to 0.45 mg/l, per the model. On the other hand, an effluent TSS concentration of 25.0 mg/l, although within permits limits, would result in an effluent TP concentration of 1.1 mg/l. Although this does not exceed the peak 18 day (95 th percentile) target of 1.4 mg/l, it nonetheless demonstrates the importance of clarifier performance. As a result, good secondary clarifier performance is essential for reliably meeting effluent TP concentrations less than 1.0 mg/l. SECTION 1_MODELING AND EVALUATION OF NUTRIENT REMOVAL ALTERNATIVES_V4.DOCX 1-23
44
45 Section 2 Nutrient Removal Alternatives Development and Comparison This section discusses the development and comparison of nutrient removal alternatives to achieve compliance with the future nutrient limits at the Loveland WWTP. In developing the physical configuration of the plant modifications, each alternative was evaluated in terms of implementation in an operating plant, capital and relative operating costs, and non monetary considerations. The objective of this section is to recommend a plant modification project to meet upcoming nutrient limits that provides the most value to the City. The design flow and loading values for this study are: 12.0 mgd peak month flow 27,800 lb/day peak month BOD loading The future permit limits for total inorganic nitrogen (TIN) and total phosphorus (TP) are listed in Section 1, and are not repeated here. These permit limits required consideration of both the annual average and peak 18 day flows and loads, as discussed in detail in Section 1. The facility modifications described herein were determined through process modeling to be necessary and adequate for meeting future permit limits under design flows and loads. 2.1 Alternatives Development and Descriptions In order to compare plant modification alternatives, it was necessary to develop and define the physical characteristics of each alternative. The three process alternatives that were identified and evaluated in Section 1 were: 1. A2O 2. Johannesburg, or JHB 3. Step Feed The following describes the layouts and the facilities additions and modifications required for each of the alternatives Alternative 1 A2O Process The basic configuration of the A2O process alternative is shown in Figure 2 1. Drawing markups showing the physical plant modifications necessary to convert to the A2O process and expand the plant treatment capacity are included in Appendix A. Sizes and capacities of key facilities and components are listed in Table 2 1. The A2O process alternative was determined in Section 1 to require the addition of a third bioreactor train equal in volume to each of the two existing bioreactor trains, with a volume of about 1.41 million gallons (mgal). The total bioreactor volume would be about 4.24 mgal. The existing bioreactor trains would need to be modified to provide the A2O process configuration. This would require demolishing some existing baffle walls and constructing new baffle walls to provide the various operating conditions determined through process modeling, as shown in the drawing markups in Appendix A. Although the existing membrane aeration diffusers were determined to be sufficient in number and capacity to accommodate the future aeration requirements for the A2O process, it was assumed that the diffusers would be replaced due to their age. This would involve replacement of the diffuser membrane only, as the existing piping manifold and diffuser assemblies could be reused. The new bioreactor train would be located to the west of the existing Aeration Basin Nos. 5 and 6 structure and the Blower Building as shown on the site plan markup in Appendix A. The overall basin size would be about 55 ft by 220 ft. The basin would be configured as a single train, with SECTION 2_NUTRIENT REMOVAL ALTERNATIVES DEVELOPMENT AND COMPARISON_V4.DOCX 2-1
46 SECTION 2 NUTRIENT REMOVAL ALTERNATIVES DEVELOPMENT AND COMPARISON baffle walls spaced along the length of the train to create the various zones. The new bioreactor would have the same relative zone sizes throughout the length of the train as in the modified existing bioreactor trains. A walkway would be provided around the basin perimeter, and stairway access would be included at two locations similar to that for the existing trains. FIGURE 2 1 A2O Process Schematic Mixed liquor recycle (MLR) pumping systems would be added to the existing bioreactors and included in the new train. Submersible pumps would be used to convey mixed liquor from the last OXIC zone to the anoxic (ANX) zone located near the upstream end of the train. A spare pump would be provided in each train to ensure firm capacity. The required MLR pumping rate, estimated at 300 percent of the forward flow under peak 18 day conditions, would require relatively large capacity pumps. For the purposes of developing the cost estimate, it was assumed that submersible pumps would be used. Alternate pump types could be considered during design of the modifications. Due to the physical layout of the basins, a horizontal propeller type pump may not be appropriate, and would need to be evaluated during design if desired. The firm blower capacity was based on meeting the peak day average air requirement. This was conservatively determined from the ratio of peak day BOD loading to peak 18 day loading, and applying that ratio to the model prediction for the peak 18 day air requirement. This ratio was determined to be 1.45:1 from plant data. Applying this ratio to the peak 18 day air requirement of 11,200 scfm (as determined in Section 1 of the Report), results in an estimated peak day air requirement of 16,200 scfm. In order to meet the air requirements estimated for peak day average conditions, one blower would need to be added, and two additional blowers replaced, at the existing Blower Building. These blowers would be equal in capacity to the larger existing blowers (4,200 scfm). The new blower would be installed in the space allotted for it in the Blower Room. The two existing 3,000 scfm blowers would be replaced with 4,200 scfm blowers. It was assumed that these blowers would be multi stage centrifugal type blowers similar to the existing blowers since they would be connected to the common blower discharge header. Although high speed turbo blowers are becoming more popular, the manufacturers do not recommend mixing blower types when discharging to the same header. With this additional blower, the facility would have a firm capacity (largest blower out of service) of 16,800 scfm, sufficient to meet the estimated air requirement on the peak day (16,200 scfm). The system would also have sufficient capacity to maintain a dissolved oxygen (DO) level of 2.0 mg/l for the diurnal peak during the peak month condition (15,900 scfm) which is required by Colorado Department of 2-2 SECTION 2_NUTRIENT REMOVAL ALTERNATIVES DEVELOPMENT AND COMPARISON_V4.DOCX
47 SECTION 2 NUTRIENT REMOVAL ALTERNATIVES DEVELOPMENT AND COMPARISON Public Health and Environment (CDPHE) design standards. The latter was estimated from an analysis of plant data relative to BOD loading to extrapolate air requirements from the modeling results. In addition, a fourth secondary clarifier would be needed to comply with CDPHE design criteria for redundancy. This clarifier would be sized the same as the existing clarifiers (90 foot diameter), with integral return activated sludge (RAS) and secondary scum (SSM) pump stations, similar to the existing Secondary Clarifier No. 3. The blower additions, along with the additional power feeds for the new secondary clarifier and RAS/SSM pumping systems, could not be served from the existing motor control center at the Blower Building. It was assumed that the Electrical Room would be expanded to accommodate additional electrical equipment. Yard piping requirements are depicted in the site drawing markup in Appendix A. The following major pipes would be required: 20 RAS to new bioreactor train from Primary Effluent Distribution Structure 18" RAS from new secondary clarifier to Primary Effluent Distribution Structure 24" SE from new secondary clarifier to UV facility 24" PE to new bioreactor train from Primary Effluent Distribution Structure 20" ML to new secondary clarifier from ML Distribution Structure 6" SSM from new secondary clarifier to existing SSM piping 20" SST air piping from blower header to new bioreactor train These pipes would all be buried ductile iron pipes with the exception of the SST air piping, which would be above grade similar to the existing air piping. Although not specifically indicated by process modeling to be necessary, a chemical feed system should be included to provide backup to the biological process for phosphorus removal. This system would include chemical storage tank(s) and a pair of chemical feed pumps. Although alum could potentially be used, ferric chloride is a better selection in light of its ability to reduce hydrogen sulfide odors from the process flow where added. It is recommended that the chemical be added to the primary clarifier influent, and only used when needed to meet effluent phosphorus limits in the event of a problem with the biological phosphorus removal (bio P) process. It is estimated that a peak 18 day pumping rate of about 470 gallon/day of 30 percent ferric chloride solution would be required to fully backup the bio P process. A total chemical storage capacity of 4,000 gallons would provide about 1 week of net storage under this condition. This system could be located in an existing structure such as the old Blower Building at the north end of the plant. This is near the primary clarifiers facilitating feeding of the chemical. If a new building was required for this chemical feed system, the cost of providing the system would increase substantially. It is possible that a ferric chloride system could be combined with a similar system in the upcoming digester improvements. From a capital planning perspective, the chemical feed system was assumed in the cost estimates for all the alternatives. SECTION 2_NUTRIENT REMOVAL ALTERNATIVES DEVELOPMENT AND COMPARISON_V4.DOCX 2-3
48 SECTION 2 NUTRIENT REMOVAL ALTERNATIVES DEVELOPMENT AND COMPARISON TABLE 2 1 A2O Alternative Plant Modification Details and Sizing Feature Existing bioreactor modifications Total volume, mgal No. membrane diffusers to replace Mixers Type No. Hp MLR pumps Type No. Capacity, gpm Net capacity Hp New bioreactor Total volume, mgal Mixers Type No. Hp MLR pumps Type No. Capacity, gpm Net capacity Hp Blowers Total air required, peak day, scfm Number added Type Capacity, scfm Total blower system capacity, scfm (firm) Bioreactor zones relative sizing (typical all 3 trains) ANA ANX OXIC Secondary clarifier Diameter, ft Sidewater depth, ft RAS pumps Type No. Capacity, gpm Secondary scum pump Type No. Capacity, gpm Ferric chloride feed system Value ,366 Submersible Submersible 4 (1 standby each train) 8, percent of peak month (24 mgd total) Submersible Submersible 2 (1 standby) 8, percent of peak month (12 mgd) 50 16,200 3 (replace two 3,000 scfm blowers) Multi stage centrifugal 4,200 16, % 14.0 % 78.0 % Submersible 2 4,000 Screw induced flow submersible gpm 2-4 SECTION 2_NUTRIENT REMOVAL ALTERNATIVES DEVELOPMENT AND COMPARISON_V4.DOCX
49 SECTION 2 NUTRIENT REMOVAL ALTERNATIVES DEVELOPMENT AND COMPARISON TABLE 2 1 A2O Alternative Plant Modification Details and Sizing Feature System dosage, mg/l Chemical strength Tank(s) Total working volume, gal Capacity Chemical feed pumps Type Number Capacity, gal/hr Value percent 4,000 1 week at peak month Peristaltic 2 (1 standby) Alternative 2 JHB Process The basic configuration of the JHB process alternative is shown in Figure 2 2. FIGURE 2 2 JHB Process Schematic Drawing markups showing the physical plant modifications necessary to convert to the JHB process and expand the plant treatment capacity are included in Appendix B. Sizes and capacities of key facilities and components are listed in Table 2 2. The JHB process alternative requires many of the same modifications described above for the A2O process, with some relative sizing variations. It was determined in Section 1 that the JHB process would require the addition of a third bioreactor train equal in volume to each of the two existing bioreactor trains, with a volume of about 1.41 million gallons (mgal). The total bioreactor volume would be about 4.24 mgal. The existing bioreactor trains would need to be modified to provide the JHB process configuration. This would require demolishing some existing baffle walls and constructing new baffle walls to provide the various operating conditions determined through process modeling, as shown in the drawing markups in Appendix B. Although the existing membrane aeration diffusers were determined to be sufficient in number and capacity to accommodate the future aeration requirements for the A2O process, it was assumed that the diffusers would be replaced due to their age. This would involve replacement of the diffuser membrane SECTION 2_NUTRIENT REMOVAL ALTERNATIVES DEVELOPMENT AND COMPARISON_V4.DOCX 2-5
50 SECTION 2 NUTRIENT REMOVAL ALTERNATIVES DEVELOPMENT AND COMPARISON only, as the existing piping manifold and diffuser assemblies could be reused. The new bioreactor train would be located to the west of the existing Aeration Basin Nos. 5 and 6 structure and the Blower Building as shown on the site plan markup in Appendix B. The overall basin size would be about 55 ft by 220 ft. The basin would be configured as a single train, with baffle walls spaced along the length of the train to create the various zones. The new bioreactor would have the same relative zone sizes throughout the length of the train as in the modified existing bioreactor trains. A walkway would be provided around the basin perimeter, and stairway access would be included at two locations similar to that for the existing trains. Mixed liquor recycle (MLR) pumping systems would be added to the existing bioreactors and included in the new train. Submersible pumps would be used to convey mixed liquor from the last OXIC zone to the anoxic (ANX) zone located near the upstream end of the train. A spare pump would be provided in each train to ensure firm capacity. The required MLR pumping rate, estimated at 300 percent of the forward flow under peak 18 day conditions, would require relatively large capacity pumps. For the purposes of developing the cost estimate, it was assumed that submersible pumps would be used. Alternate pump types could be considered during design of the modifications. Due to the physical layout of the basins, a horizontal propeller type pump may not be appropriate, and would need to be evaluated during design if desired. The firm blower capacity was based on meeting the peak day average air requirement. This was conservatively determined from the ratio of peak day BOD loading to peak 18 day loading, and applying that ratio to the model prediction for the peak 18 day air requirement. This ratio was determined to be 1.45:1 from plant data. Applying this ratio to the peak 18 day air requirement of 11,600 scfm (as determined in Section 1 of the Report), results in an estimated peak day air requirement of 16,800 scfm. In order to meet the air requirements estimated for peak day average conditions, one blower would need to be added, and two additional blowers replaced, at the existing Blower Building. These blowers would be equal in capacity to the larger existing blowers (4,200 scfm). The new blower would be installed in the space allotted for it in the Blower Room. The two existing 3,000 scfm blowers would be replaced with 4,200 scfm blowers. It was assumed that these blowers would be multi stage centrifugal type blowers similar to the existing blowers since they would be connected to the common blower discharge header. Although high speed turbo blowers are becoming more popular, the manufacturers do not recommend mixing blower types when discharging to the same header. With this additional blower, the facility would have a firm capacity (largest blower out of service) of 16,800 scfm, sufficient to meet the estimated peak average air requirement (16,800 scfm). The system would also have sufficient capacity to maintain a dissolved oxygen (DO) level of 2.0 mg/l for the diurnal peak during the peak month condition (16,500 scfm) which is required by CDPHE design standards.. The latter was estimated from an analysis of plant data relative to BOD loading to extrapolate air requirements from the modeling results. In addition, a fourth secondary clarifier would be needed to comply with CDPHE design criteria for redundancy. This clarifier would be sized the same as the existing clarifiers (90 foot diameter), with integral return activated sludge (RAS) and secondary scum (SSM) pump stations, similar to the existing Secondary Clarifier No. 3. The blower additions, along with the additional power feeds for the new secondary clarifier and RAS/SSM pumping systems, could not be served from the existing motor control center at the Blower Building. It was assumed that the Electrical Room would be expanded to accommodate additional electrical equipment. Yard piping requirements are depicted in the site drawing markup in Appendix B. The piping would be essentially identical to that required for the A2O alternative. The following major pipes would be required: 20 RAS to new bioreactor train from Primary Effluent Distribution Structure 18" RAS from new secondary clarifier to Primary Effluent Distribution Structure 24" SE from new secondary clarifier to UV facility 24" PE to new bioreactor train from Primary Effluent Distribution Structure 20" ML to new secondary clarifier from ML Distribution Structure 2-6 SECTION 2_NUTRIENT REMOVAL ALTERNATIVES DEVELOPMENT AND COMPARISON_V4.DOCX
51 SECTION 2 NUTRIENT REMOVAL ALTERNATIVES DEVELOPMENT AND COMPARISON 6" SSM from new secondary clarifier to existing SSM piping 20" SST air piping from blower header to new bioreactor train These pipes would all be buried ductile iron pipes with the exception of the SST air piping, which would be above grade similar to the existing air piping. As with the A2O alternative, a chemical feed system should be included to provide backup to the biological process for phosphorus removal. This system would include chemical storage tank(s) and a pair of chemical feed pumps. Although alum could potentially be used, ferric chloride is a better selection in light of its ability to reduce hydrogen sulfide odors from the process flow where added. It is recommended that the chemical be added to the primary clarifier influent, and only used when needed to meet effluent phosphorus limits in the event of a problem with the biological phosphorus removal (bio P) process. It is estimated that a peak 18 day pumping rate of about 470 gallon/day of 30 percent ferric chloride solution would be required to fully backup the bio P process. A total chemical storage capacity of 4,000 gallon would provide about 1 week of net storage under this condition. This system could be located in an existing structure such as the old Blower Building at the north end of the plant. This is near the primary clarifiers facilitating feeding of the chemical. If a new building was required for this chemical feed system, the cost of providing the system would increase substantially. It is possible that a ferric chloride system could be combined with a similar system in the upcoming digester improvements. TABLE 2 2 JHB Alternative Plant Modification Details and Sizing Feature Existing bioreactor modifications Total volume, mgal No. membrane diffusers to replace Mixers Type No. Hp MLR pumps Type No. Capacity, gpm Net capacity Hp New bioreactor Total volume, mgal Mixers Type No. Hp MLR pumps Type No. Capacity, gpm Net capacity Hp Blowers Total air required, peak day, scfm Number added Type Value ,366 Submersible Submersible 4 (1 standby each train) 8, percent of peak month (24 mgd total) Submersible Submersible 2 (1 standby) 8, percent of peak month (12 mgd) 50 16,800 3 (replace two 3,000 scfm blowers) Multi stage centrifugal SECTION 2_NUTRIENT REMOVAL ALTERNATIVES DEVELOPMENT AND COMPARISON_V4.DOCX 2-7
52 SECTION 2 NUTRIENT REMOVAL ALTERNATIVES DEVELOPMENT AND COMPARISON TABLE 2 2 JHB Alternative Plant Modification Details and Sizing Feature Capacity, scfm Total blower system capacity, scfm (firm) Bioreactor zones relative sizing (typical all 3 trains) RAS ANX ANA ANX OXIC Secondary clarifier Diameter, ft Sidewater depth, ft RAS pumps Type No. Capacity, gpm Secondary scum pump Type No. Capacity, gpm Ferric chloride feed system System dosage, mg/l Chemical strength Tank(s) Total working volume, gal Capacity Chemical feed pumps Type Number Capacity, gal/hr Value 4,200 16, % 10.0 % 14.0 % 73.0 % Submersible 2 4,000 Screw induced flow submersible gpm percent 4,000 1 week at peak month Peristaltic 2 (1 standby) Alternative 3 Step-Feed Process The basic configuration of the Step Feed process alternative is shown in Figure 2 3. Drawing markups showing the physical plant modifications necessary to convert to the Step Feed process and expand the plant treatment capacity are included in Appendix C. Sizes and capacities of key facilities and components are listed in Table 2 3. The Step Feed process alternative differs from the A2O and JHB alternatives primarily in that a new bioreactor train would not be required. Instead, the two existing bioreactor trains would provide sufficient volume to accommodate the design conditions and meet the configuration requirements of the Step Feed process. Although the existing trains are already configured as a Step Feed process, modifications would be necessary to provide for adequate nutrient removal. This would require demolishing some existing baffle walls and constructing new baffle walls to provide the various operating conditions determined through process modeling, as shown in the drawing markups in Appendix C. A unique feature in the Step Feed alternative is a small non aerated baffled section at the downstream end the first stages, just upstream of the isolation gates between the stages, which is intended to reduce oxygen carryover into the downstream 2-8 SECTION 2_NUTRIENT REMOVAL ALTERNATIVES DEVELOPMENT AND COMPARISON_V4.DOCX
53 SECTION 2 NUTRIENT REMOVAL ALTERNATIVES DEVELOPMENT AND COMPARISON ANX zone. This stilling area would not be needed in the second stage in light of the long conveyance channels to the third stage. The Step Feed process would require a much higher aeration rate in the OXIC zones than for the existing process, requiring the complete replacement of the existing diffuser and piping system in the basins. FIGURE 2 3 Step Feed Process Schematic Mixed liquor recycle pumping systems are not required for the Step Feed process, as the nitrate from the first and second OXIC zones is denitrified in the downstream ANX zone(s). The firm blower capacity was based on meeting the peak day average air requirement. This was conservatively determined from the ratio of peak day BOD loading to peak 18 day loading, and applying that ratio to the model prediction for the peak 18 day air requirement. This ratio was determined to be 1.45:1 from plant data. Applying this ratio to the peak 18 day air requirement of 14,400 scfm (as determined in Section 1 of the Report), results in an estimated peak day air requirement of 20,900 scfm. In order to meet this air requirement for the peak day average condition, a major change to the blower system would be required for this alternative. The air requirements for Step Feed are higher than the other two alternatives due to the loading from the gravity thickener/fermenter overflow, and also the significantly higher MLSS concentrations in the Step Feed process. Adding a fifth multi stage centrifugal blower as in the A2O and JHB alternatives would not meet the peak air requirements of the Step Feed process of 20,900 scfm. If four blowers were to be sized to meet the peak air requirements of the Step Feed process, a blower capacity of 5,225 scfm each would be required. An additional fifth blower would also be required for redundancy. Since this would require replacement of all of the blowers in the existing Blower Building, the option would exist to either install multi stage centrifugal blowers (similar to the existing blowers) or another blower type such as high speed turbo blowers. The latter would have a higher efficiency than the multi stage centrifugal type blowers, but a higher initial cost. For this study it was assumed that high speed turbo blowers would be installed. Per one of the major manufacturers of high speed turbo blowers (Neuros), 3 pairs of blowers (each pair combined in a single cabinet) would be required at 4,200 scfm each. The larger capacity blower system would have higher horsepower requirements, requiring significant modifications to the existing plant electrical system. The existing blowers are fed from MCC 7 in the Blower Building, which would have the SECTION 2_NUTRIENT REMOVAL ALTERNATIVES DEVELOPMENT AND COMPARISON_V4.DOCX 2-9
54 SECTION 2 NUTRIENT REMOVAL ALTERNATIVES DEVELOPMENT AND COMPARISON capacity and space to only feed a portion of the new blowers. The other blowers would need to be fed from a new MCC, which would have to be powered using the future spare feeder at the main switchgear. Since there is no room in the existing Blower Building Electrical Room for an additional MCC, an expansion of the existing building would be required. It was assumed that the existing Electrical Room would be expanded 20 feet to the west to house the new MCC. In addition, an electrical analysis of the system may determine that a new transformer would be required to accommodate the additional load. This was not assumed in the cost analysis, but could be determined if this alternative was to actually be implemented. With the above modifications, the facility would have a firm capacity (largest blower out of service) of 21,000 scfm, sufficient to meet the estimated average air requirement on the peak day (20,900 scfm). The system would also have sufficient capacity to maintain a dissolved oxygen (DO) level of 2.0 mg/l for the diurnal peak during the peak month condition (20,500 scfm) per CDPHE design standards. As with the other two alternatives, a fourth secondary clarifier would be needed to comply with CDPHE design criteria for redundancy. This clarifier would be sized the same as the existing clarifiers (90 foot diameter), with integral return activated sludge (RAS) and secondary scum (SSM) pump stations, similar to the existing Secondary Clarifier No. 3. These facilities would be fed with power from either the existing MCC 7 or from the new MCC added for the blowers. The Step Feed alternative would require the addition of a gravity thickener/fermenter to create a recycle stream rich in volatile fatty acids (VFAs) to assist in the bio P process. The addition of the thickener/ fermenter to the Step Feed alternative reduces the anaerobic volume and leaves more volume available for anoxic and aerobic zones. The gravity thickener/fermenter would be located in an open area on the site, east of the old Chlorine Building as shown on the site plan markup in Appendix C. A below grade thickened sludge pump station would be located adjacent to the thickener/fermenter. Thickened sludge pumps would withdraw sludge from the thickener/fermenter and send it to the existing anaerobic digesters. A submersible pumping system would be located in a pit on the side of the thickener/fermenter to pump overflow from the thickener to the upstream end of the existing bioreactor trains. Since the thickener/fermenter would produce odors, it would need to be covered and an odor treatment system, such as a biofilter, would need to be included to treat the off gasses. These facilities would be powered from the existing WAS Thickening Building. Yard piping requirements are depicted in the site drawing markup in Appendix C. Since the Step Feed alternative would not require a new bioreactor train, several of the pipes required by the other two alternatives would not be needed. The following major pipes would be required: 18" RAS from new secondary clarifier to Primary Effluent Distribution Structure 24" SE from new secondary clarifier to UV facility 20" ML to new secondary clarifier from ML Distribution Structure 6" SSM from new secondary clarifier to existing SSM piping 6 PSD from primary sludge pump station to thickener/fermenter 6 TSL from thickener/fermenter to anaerobic digesters 2 FO from thickener/fermenter to bioreactors The above pipes would all be buried ductile iron pipes. It was determined that the existing air piping to the bioreactor trains is oversized relative to existing airflows and would not require replacement or augmentation to accommodate the higher airflows of the Step Feed process. As with the other two alternatives, a chemical feed system should be included to provide backup to the biological process for phosphorus removal. This system would include chemical storage tank(s) and a pair of chemical feed pumps. Although alum could potentially be used, ferric chloride is a better selection in light of its ability to reduce hydrogen sulfide odors from the process flow where added. It is recommended that the chemical be added to the primary clarifier influent, and only used when needed to meet effluent phosphorus limits in the event of a problem with the biological phosphorus removal (bio P) process. It is 2-10 SECTION 2_NUTRIENT REMOVAL ALTERNATIVES DEVELOPMENT AND COMPARISON_V4.DOCX
55 SECTION 2 NUTRIENT REMOVAL ALTERNATIVES DEVELOPMENT AND COMPARISON estimated that a peak 18 day pumping rate of about 470 gallon/day of 30 percent ferric chloride solution would be required to fully backup the bio P process. A total chemical storage capacity of 4,000 gallon would provide about 1 week of net storage under this condition. This system could be located in an existing structure such as the old Blower Building at the north end of the plant. This is near the primary clarifiers facilitating feeding of the chemical. If a new building was required for this chemical feed system, the cost of providing the system would increase substantially. As with the other alternatives, it is possible that a ferric chloride system could be combined with a similar system in the upcoming digester improvements. TABLE 2 3 Step Feed Alternative Plant Modification Details and Sizing Feature Existing bioreactor modifications Total volume, mgal Mixers Type No. Hp Blowers Total air required, diurnal peak on peak day, scfm Number added Type Capacity each, scfm Total aeration capacity, scfm Bioreactor zones relative sizing (typical all 3 trains) 1 Stage 1 ANX ANA OXIC Stage 2 ANX OXIC Stage 3 ANX OXIC Secondary clarifier Diameter, ft Sidewater depth, ft RAS pumps Type No. Capacity, gpm Secondary scum pump Type No. Capacity, gpm Gravity thickener/fermenter Diameter, ft Sidewater depth, ft Sludge retention time, days Primary sludge loading rate, lb/ft2 day Odor control system Value 2.83 Submersible ,900 6 (1 standby) High Speed Turbo 4,200 21, % 10.0 % 18.3 % 6.0 % 27.3 % 7.0 % 26.3 % Submersible 2 4,000 Screw induced flow submersible gpm Biofilter SECTION 2_NUTRIENT REMOVAL ALTERNATIVES DEVELOPMENT AND COMPARISON_V4.DOCX 2-11
56 SECTION 2 NUTRIENT REMOVAL ALTERNATIVES DEVELOPMENT AND COMPARISON TABLE 2 3 Step Feed Alternative Plant Modification Details and Sizing Feature Thickened sludge pumps No. Type Capacity, gpm Fermenter overflow pumps No. Type Capacity, gpm Ferric chloride feed system System dosage, mg/l Chemical strength Tank(s) Total working volume, gal Capacity Chemical feed pumps Type Number Capacity, gal/hr Value 2 (1 standby) Rotary lobe 25 2 (1 standby) Submersible percent 4,000 1 week at peak month Peristaltic 2 (1 standby) 9.0 Notes: 1 Stage volumes match existing basin stages, 33.3 % each. 2.2 Alternatives Implementation All of the alternatives involve significant modifications and additions to the existing operating WWTP. An important consideration when planning for plant modifications is the ability to implement the changes while continuing to operate the existing plant facilities and meet permit. The following paragraphs discuss the important considerations relative to the implementation of each plant modification alternative A2O and JHB The A2O and JHB alternatives are virtually identical in terms of implementation issues. Since both of these alternatives include the addition of a third bioreactor train, the new train could be completed prior to removing either of the existing trains from service to modify for the new treatment process. Special construction procedures would be needed for the various tie ins for PE and ML to existing structures, including potentially bulkheading and/or temporary bypass pumping, although these are common when modifying existing treatment facilities. In both cases a new facility extension would be constructed and all associated piping completed, followed by removal of an existing wall section to complete the tie in. The details of these structural modifications are left to the design phase, but there are no fatal flaws evident in implementing such tie ins. The existing trains may be removed from service one at a time to complete internal modifications, essentially retaining the current treatment capacity during construction. Likewise, for the new secondary clarifier, most of the piping and clarifier construction would be completed off line, with final piping connections for ML, SE, RAS and SSM completed with temporary shutdowns or bypass pumping required. As such, there are no fatal flaws evident for this facility as well. The Blower Building modifications are relatively simple for these two alternatives, as a space was retained, along with piping and electrical accommodations, for the future addition of a fifth blower as required for these alternatives. Replacement of the two existing 3,000 scfm blowers would likewise be relatively straightforward. The Blower Building electrical service expansion would require a building addition as noted previously SECTION 2_NUTRIENT REMOVAL ALTERNATIVES DEVELOPMENT AND COMPARISON_V4.DOCX
57 SECTION 2 NUTRIENT REMOVAL ALTERNATIVES DEVELOPMENT AND COMPARISON The chemical feed system construction would have very minimal impact on the operating facility Step-Feed The Step Feed process alternative varies significantly from the A2O and JHB processes in terms of incorporation into the operating plant. Step Feed was originally recommended as a cost effective means of retrofitting the prior complete mix aeration basins to meet changing ammonia standards in the late 1990 s and was implement in The Step Feed system helped to reduce the volume required for the aeration improvements at that time and was to be flexible for future modifications when nutrient limits were enacted. This alternative does not include a new bioreactor train, requiring modifications to the existing trains to be completed by removing one stage (one third of a train) from service at a time to make the necessary physical modifications. The existing structure includes the capability to bypass flows around a particular stage while keeping the rest of the train in service. While this will impact the plant secondary treatment capacity, the impact will be limited to about a 16 percent reduction of capacity at one time. Although a greater impact than for the other two alternatives, this level of capacity reduction is not a fatal flaw in terms of implementation. This alternative would not have the tie ins necessary for the other two alternatives, although modifications to the ML Splitter Structure at the downstream end of Basins 5 and 6 would still be required to provide flow to the new secondary clarifier. The impacts of adding the new clarifier would be identical to those for the A2O and JHB alternatives. The Blower Building impacts would be far greater for the Step Feed alternative. As described above, this alternative would require complete replacement of the existing blower system. Due to increased horsepowers of the blowers, major electrical modifications would be needed. Also, if the blower types were changed to high speed turbo blowers, a step wise blower replacement would be necessary to be able to switch to the new blowers with a minimum of disruption. The replacement of the existing blowers would have to be accomplished by working from one end to the other, removing the smaller two of the existing blowers from service first to install two new turbo blowers, and switching over to the new blowers during a shutdown to be able to continue to provide air to the bioreactors. A greater issue, however, would be the electrical modifications necessary to accommodate 6 new blowers with increased horsepower requirements. The Step Feed alternative includes a gravity thickener/fermenter and associated pumping system that would also have to be tied into the existing plant facilities. However, these facilities would be constructed offline, with final piping connections made during a relatively short shutdown of the primary sludge pumping system. As with the other alternatives, the chemical feed system construction would have very minimal impact on the operating facility. 2.3 Alternatives Comparison and Recommendations The alternatives were compared on both monetary and non monetary bases. Estimates of capital cost and present worth of annual costs were prepared for each of the alternatives. The capital cost estimates were based on the physical characteristics of the alternatives as described above and as shown in the drawing markups included in the appendices. The annual costs are specific to the alternatives and are comparative only. In other words, they do not represent the entire cost of operation and maintenance for the alternatives, but rather are intended to capture the differences among the alternatives Alternatives Capital Cost Estimates Capital cost estimates were prepared based on the physical characteristics of the facilities modifications and additions as described above. The cost estimate for the A2O alternative is summarized in Table 2 4. SECTION 2_NUTRIENT REMOVAL ALTERNATIVES DEVELOPMENT AND COMPARISON_V4.DOCX 2-13
58 SECTION 2 NUTRIENT REMOVAL ALTERNATIVES DEVELOPMENT AND COMPARISON TABLE 2 4 A2O Cost Estimate Facilities Costs: Item New Bio Reactor $1,591,200 New Secondary Clarifier & RAS/SSM Pumping $1,819,700 Existing Bioreactor Modifications $644,300 Bioreactor Effluent Distribution Modifications $48,700 Aeration Basin Influent Distribution Modifications $15,600 Blower $863,200 Ferric Chloride Feed System $69,200 Yard Piping $370,700 Subtotal $5,422,600 Allowance for Misc Items (5%) $271,200 Subtotal $5,693,800 Contractor Markups: Overhead (10%) $569,400 Subtotal $6,263,200 Profit (5%) $313,200 Subtotal $6,576,400 Mob/Bonds/Insurance (5%) $328,900 Subtotal $6,905,300 Contingency (30%) $2,071,600 Subtotal with Markups $8,976,900 Engineering (20%) $1,795,400 Total Capital Cost $10,772,300 Cost The cost estimate for the JHB alternative is summarized in Table 2 5. TABLE 2 5 JHB Cost Estimate Facilities Costs: Item Cost New Bio Reactor $1,599,500 New Secondary Clarifier & RAS/SSM Pumping $1,819,700 Existing Bioreactor Modifications $699,600 Bioreactor Effluent Distribution Modifications $48,700 Aeration Basin Influent Distribution Modifications $15,600 Blower Addition $863,200 Ferric Chloride Feed System $69,200 Yard Piping $370,700 Subtotal $5,486,200 Allowance for Misc Items (5%) $274, SECTION 2_NUTRIENT REMOVAL ALTERNATIVES DEVELOPMENT AND COMPARISON_V4.DOCX
59 SECTION 2 NUTRIENT REMOVAL ALTERNATIVES DEVELOPMENT AND COMPARISON TABLE 2 5 JHB Cost Estimate Item Cost Subtotal $5,760,600 Contractor Markups: Overhead (10%) $576,100 Subtotal $6,336,700 Profit (5%) $316,900 Subtotal $6,653,600 Mob/Bonds/Insurance (5%) $332,700 Subtotal $6,986,300 Contingency (30%) $2,095,900 Subtotal with Markups $9,082,200 Engineering (20%) $1,816,500 Total Capital Cost $10,898,700 The cost estimate for the Step Feed alternative is summarized in Table 2 6. TABLE 2 6 Step Feed Cost Estimate Item Cost Facilities Costs: New Secondary Clarifier & RAS/SSM Pumping $1,819,700 Existing Bioreactor Modifications $756,300 Bioreactor Effluent Distribution Modifications $49,600 Blower Replacement/Building Expansion $1,997,200 Ferric Chloride Feed System $69,200 Gravity Thickener/Fermenter/Odor Control $907,000 Thickened Sludge Pump Station $275,700 Yard Piping $297,000 Subtotal $6,171,700 Allowance for Misc Items (5%) $308,600 Subtotal $6,480,300 Contractor Markups: Overhead (10%) $648,100 Subtotal $7,128,400 Profit (5%) $356,500 Subtotal $7,484,900 Mob/Bonds/Insurance (5%) $374,300 SECTION 2_NUTRIENT REMOVAL ALTERNATIVES DEVELOPMENT AND COMPARISON_V4.DOCX 2-15
60 SECTION 2 NUTRIENT REMOVAL ALTERNATIVES DEVELOPMENT AND COMPARISON TABLE 2 6 Step Feed Cost Estimate Item Cost Subtotal $7,859,200 Contingency (30%) $2,357,800 Subtotal with Markups $10,217,000 Engineering (20%) $2,043,400 Total Capital Cost $12,260,400 The estimated capital costs for the alternatives are listed in Table 2 7 for comparison. TABLE 2 7 Capital Cost Estimates Alternative Total Estimated Capital Cost A2O $10,772,300 JHB $10,898,700 Step Feed $12,260,400 As shown, the estimated capital costs for the A2O and JHB alternatively are relatively close in magnitude, while the Step Feed alternative would be substantially more expensive to implement. Although the Step Feed alternative avoids the cost of a new third bioreactor train, that savings is offset by the gravity thickener/fermenter (and associated pump station and biofilter) and the requirement to replace all of the existing blowers Cost Estimate Caveat The cost estimates presented in this study are "Class 4" estimates, as defined by the Association for the Advancement of Cost Engineering International (AACE International). It is normally expected that estimates of this type would be accurate within plus 50 percent or minus 30 percent. This range shows that there is the potential for significant variation of the final project cost from that presented herein. A 30 percent contingency has been included in these cost estimates as a provision for unforeseeable, additional costs within the general bounds of the project scope; particularly where previous experience has shown that unforeseeable events that will increase costs are likely to occur. The contingency is used as a means to reduce the risk of possible cost overruns. The contingency in this estimate consists of two components: Bid Contingency and Scope Contingency. Bid Contingency covers the unknown costs associated with constructing a given project scope, such as adverse weather conditions, strikes by material suppliers, geotechnical unknowns, and unfavorable market conditions for a particular project scope. Scope Contingency covers scope changes that invariably occur during final design and implementation. The cost estimate has been prepared for guidance in project evaluation and implementation from the information available at the time of the estimate. The final cost for the project will depend on such criteria as actual labor and material costs, competitive market conditions, actual site conditions, final project scope, and other variables. As a result, the final project cost will vary from this estimate. The proximity to actual costs will depend on how close the assumptions of this estimate match final project conditions. Because of this, project feasibility and funding needs must be carefully reviewed prior to making specific financial decisions to help assure proper project evaluation and adequate funding SECTION 2_NUTRIENT REMOVAL ALTERNATIVES DEVELOPMENT AND COMPARISON_V4.DOCX
61 2.3.2 Alternatives Annual Cost Estimates SECTION 2 NUTRIENT REMOVAL ALTERNATIVES DEVELOPMENT AND COMPARISON In order to assist in evaluating the potential annual cost impacts of the three alternatives, operating and maintenance costs were estimated for the alternatives. These costs are not intended to represent entire plant operation and maintenance costs, but rather are intended to reflect the differences among the alternatives. The costs were assessed over a 20 year operating period starting in 2013, with a discount rate of 3 percent (difference between inflation and potential earnings). The average annual plant flows over the 20 year period were assumed to vary from 6.45 mgd for 2013 to 9.13 mgd in 2033, based on population projections as used in the City s Capital Improvements Plan. The following annual cost components were included in each of the alternatives: Blower operating cost Mixed liquor recycle (MLR) pump operating cost (A2O and JHB only) Mixer operating cost Thickener/fermenter and associated pumping systems operating costs (Step Feed only) Facilities maintenance (assumed at 2 percent of construction cost) Most of these costs would vary with the annual plant flow, with the exception of the mixer cost and maintenance. The present worth of the annual costs for each alternative is shown in Table 2 8. TABLE 2 8 Operation and Maintenance Cost Estimates Alternative Present Worth of Annual Cost A2O $7,004,000 JHB $7,248,000 Step Feed $7,463,000 As shown, the O&M costs are relatively the same for the three alternatives, with the highest cost for the Step Feed alternative. The total present worth cost for each alternative is summarized in Table 2 9. As shown, the total present worth cost for the Step Feed alternative is about $1.6 to 2.0M higher than that for the other two alternatives. This is primarily the result of capital cost being higher for that alternative, and to a lesser extent the annual costs being higher as well. TABLE 2 9 Total Present Worth Cost Estimates Alternative Present Worth Cost A2O $17,776,300 JHB $18,146,700 Step Feed $19,723, Alternatives Non-Monetary Considerations In addition to the development of comparative costs for the alternatives, non monetary comparisons were also developed. Table 2 10 summarizes the results of the non monetary comparison of alternatives, adjusted based on City input at a workshop. In this table, the alternatives are ranked relative to each non monetary issue. These results are also shown graphically in Figure 2 4. The following paragraphs explain the issues and the relative ratings. SECTION 2_NUTRIENT REMOVAL ALTERNATIVES DEVELOPMENT AND COMPARISON_V4.DOCX 2-17
62 SECTION 2 NUTRIENT REMOVAL ALTERNATIVES DEVELOPMENT AND COMPARISON Constructability Both A2O and JHB would have a reduced impact on secondary treatment during construction as a result of the third bioreactor train. Modifying the existing basins for the Step Feed alternative would require many shutdowns and operational changes. However, tying the new third train into the existing plant flow stream for A2O and JHB would present construction difficulties that would not exist for Step Feed. Overall, the A2O and JHB alternatives rank higher Accommodate Higher than Projected Flows and Loads The Step Feed alternative would have little accommodation for higher than projected flows and loads due to its limited bioreactor volume. With the third equal train for A2O and JHB, modeling shows that the system would be relatively lightly loaded and could easily accommodate somewhat higher flows and loads Future Dewatering Recycle Impacts The most significant differentiator relative to future solids dewatering recycle is that the Step Feed alternative would require the addition of the third train, which is already included for A2O and JHB. This would make the most expensive alternative (Step Feed) even more expensive and would add another construction project in the future which would not be required for the other two alternatives Robustness of Treatment Process The JHB process would hold a slight edge over the other alternatives due to the RAS anoxic zone. This would provide a measure of stability to the bio P process that the A2O process would not have. The Step Feed process would also have stability from the fermenter, although proper apportionment of flows among the stages would have to be controlled to ensure treatment results Impacts on Need for Third Primary Clarifier In the Step Feed alternative, with the ability to convert to thin sludge pumping to the thickener/fermenter from the existing primary clarifiers, the capacity of those clarifiers would be increased and potentially delay the need for a third primary clarifier. Since the loading on the existing clarifiers would exceed CDPHE criteria, justification would be needed for a variance, which could be justified by the change in operation of the primary clarifiers Energy Usage Based on the modeling, the A2O process may have a slight edge on energy efficiency over the JHB process, resulting in a slightly lower score for the latter on this issue. The Step Feed alternative, although using more air than the other alternatives, would actually have about 14 to 18 percent lower total annual energy cost due to the use of more efficient high speed turbo blowers and the absence of mixed liquor pumping. As noted earlier, since blower replacement would be required for that alternative, it was assumed that the replacement blower system would use more efficient high speed turbo blowers Impact on Operations The Step Feed alternative would increase the impact on operations in two ways. First, a new facility (thickener/fermenter and pumping systems) would be added and would have to be operated and controlled. Secondly, the step feed process would require operation decisions on the flow split among the stages in order to meet permit requirements. With the addition of TIN and TP permit limits, a higher level of control over the Step Feed process would be required as compared to current operations. On the plus side, there is operational familiarity with the Step Feed process SECTION 2_NUTRIENT REMOVAL ALTERNATIVES DEVELOPMENT AND COMPARISON_V4.DOCX

63 SECTION 2 NUTRIENT REMOVAL ALTERNATIVES DEVELOPMENT AND COMPARISON TABLE 2 10 Non Monetary Alternatives Comparison Issue A2O JHB Step Feed 1. Constructability; negative impacts on plant operations during construction 2. Ability to accommodate higher than projected future flows/loads Additional facilities required for future dewatering recycle Robustness of process Impacts on need for third primary clarifier Energy usage Impacts on operations (process control and additional facilities/processes) Total Score Note: Alternatives are rated from 1 to 5 relative to each non monetary aspect. A score of 5 is the most favorable for the specific alternative relative to the particular issue. FIGURE 2 4 Non Monetary Alternative Comparison SECTION 2_NUTRIENT REMOVAL ALTERNATIVES DEVELOPMENT AND COMPARISON_V4.DOCX 2-19

64 SECTION 2 NUTRIENT REMOVAL ALTERNATIVES DEVELOPMENT AND COMPARISON Summary As shown in Table 2 10, Step Feed comes in third place with respect to non monetary considerations. A benefit/cost ratio was developed for each alternative. This ratio is the non monetary score divided by the present worth cost estimate in $M. Figure 2 5 shows the benefit/cost ratio plotted along with the nonmonetary ranking for the alternatives. As shown, the benefit/cost ratio for the Step Feed alternative is lower than for the other two alternatives. The JHB and A2O alternatives are approximately equal in terms of benefit/cost. Local experience (Fort Collins, Colorado Springs), however, seems to favor the JHB alternative, as there have been difficulties achieving low TP concentrations using the A2O process without supplemental carbon addition. Although the modeling does not necessarily indicate that difficulty occurring at the Loveland plant, future changes in wastewater characteristics may make that an issue in the future. Other local experience (Sand Creek WRF, Aurora) has shown the value of the RAS anoxic zone (included in the JHB process) in encouraging VFA formation in the downstream anaerobic zone to assist in the bio P process. The actual decision on whether to implement A2O or JHB can be deferred, however, since the costs are relatively similar. FIGURE 2 5 Benefit/Cost Comparison Recommendations The Step Feed process may be eliminated on the basis of cost alone. There are no overriding non monetary issues that would warrant the additional cost of that alternative. These are reflected in the benefit/cost ratio for this alternative, which is unfavorable. The A2O and JHB processes are essentially equal in terms of calculated capital and annual costs. Based on experience at other facilities, the JHB process is recommended over the A2O process due to the stability that the RAS anoxic zone brings with very little cost impact. There is no evident reason not to include that feature and implement the JHB process at the Loveland WWTP to meet future nutrient requirements SECTION 2_NUTRIENT REMOVAL ALTERNATIVES DEVELOPMENT AND COMPARISON_V4.DOCX
65 Section 3 Modeling and Evaluation of Nutrient Removal Alternatives This section presents the results of some additional analysis of the preferred nutrient removal alternative recommended in Section 2, Nutrient Removal Alternatives Development and Comparison. In a workshop following the development of Section 2, the Johannesburg (JHB) alternative was selected as the preferred alternative for meeting anticipated nutrient permits limits per the Colorado Department of Public Health and Environment (CDPHE) Regulation 85. This selection was based on a consideration of both monetary and non monetary aspects of the alternative. The following paragraphs address the following issues relative to the JHB alternative: 1. Hydraulic impacts of the implementation of the preferred alternative. 2. Results of dynamic modeling of the preferred alternative. 3. Solids balance for preferred alternative. 4. Facilities modifications of the preferred alternative necessary to meet anticipated potential future more stringent effluent requirements resulting from CDPHE Regulation Implementation schedule for the preferred alternative. 3.1 Hydraulic Impacts of Preferred Alternative As described in Section 2, the JHB alternative makes the following modifications and additions to the existing plant facilities that impact plant flow through hydraulics: Adds a third bioreactor train operating in parallel with the two existing trains Adds a fourth secondary clarifier operating in parallel with the existing three clarifiers The design flows for the existing facilities are Aeration System peak month 10.9 mgd Peak hour 20.7 mgd The above ratio of peak hour to peak month is Applying this peaking factor to the design peak month flow of 12.0 mgd yields a design peak hour flow of 22.8 mgd. The RAS flow rate was assumed to equal the peak month flow of 12.0 mgd. This is slightly more than a 50 percent return rate at peak hour, which is reasonable. Hence, the peak hour mixed liquor flow was assumed to be 34.8 mgd. This flow will be distributed over three bioreactor trains and four secondary clarifiers, versus 2 bioreactor trains and three secondary clarifiers in the previous hydraulic analyses for the current system. In order to meet CDPHE design criteria, peak hour flow must pass with one unit out of service. This was assumed to be either one secondary clarifier, or one bioreactor train out of service. For one clarifier out of service, The water surface elevation (WSEL) downstream of the flow splitting weir at the Mixed Liquor Splitter Box (adjacent to existing Basins 5 and 6) would still be below the weir crest, at elevation ft (versus weir at ft). The WSEL at the upstream end of the existing bioreactors would only be 0.2 ft higher than for the previous design condition, and well below top of wall. With one bioreactor train out of service, the WSEL at the upstream end of the existing bioreactors would increase by 0.4 ft, but still well below top of wall. Modeling shows that it is feasible to implement the preferred process alternative and not adversely impact the plant hydraulic capacity. 3.2 Dynamic Process Modeling of Preferred Alternative The process alternative development and analysis was done using the steady state CH2M HILL Pro2D process simulator, as described earlier in this Report. Both average (for median limits) and peak 18 day SECTION 3_PREFERRED NUTRIENT REMOVAL ALTERNATIVE ADDITIONAL ANALYSIS_V3.DOCX 3-1
66 MODELING AND EVALUATION OF NUTRIENT REMOVAL ALTERNATIVES (for 95 th percentile limits) conditions were evaluated for each process alternative. Diurnal impacts on process performance were accommodated through the application of an operating factor to the solids retention time (SRT) for nitrification, and through targets for nutrients that were at a fraction of the permit limits based on observations at other treatment facilities (Figure 9.9 in in Biological Wastewater Treatment (Grady, Daigger, and Lim, 1999). In order to provide better assurance of the ability of the proposed facility modifications and additions to reliably meet existing and upcoming permit limits, dynamic modeling of the preferred alternative (JHB) was done. Although Pro2D has dynamic modeling capabilities, BioWin (Envirosim Associates) was instead used at the request of the City in light of previous dynamic modeling of the plant using BioWin completed in This allowed for direct input of wastewater characterization values used in the City s BioWin model, and provided a check against the results of the Pro2D steady state modeling. The primary focus of the diurnal modeling was to confirm the ability of the proposed alternative configuration and sizing to meet the anticipated TIN and TP permits limits, and to assess the air requirements for the bioreactors. Appendix D includes a depiction of the BioWin model and various plots of modeling results. The plant model that was developed in BioWin was based on the same model developed for Pro2D in terms of physical characteristics, such as basin sizes and flow patterns. The operating conditions (i.e., SRT, DO) were the same as used in the Pro2D model. The wastewater characterization values used in the City s BioWin model were used in this BioWin model and are listed in Table 3 1. These are the same values that were also used in the Pro2D models. TABLE 3 1 Influent Wastewater Characterization for BioWin Model Parameter Value Fbs - Readily biodegradable (including Acetate) [gcod/g of total COD] Fac - Acetate [gcod/g of readily biodegradable COD] Fxsp - Non-colloidal slowly biodegradable [gcod/g of slowly degradable COD] Fus - Unbiodegradable soluble [gcod/g of total COD] Fup - Unbiodegradable particulate [gcod/g of total COD] Fna - Ammonia [gnh3-n/gtkn] Fnox - Particulate organic nitrogen [gn/g Organic N] Fnus - Soluble unbiodegradable TKN [gn/gtkn] FupN - N:COD ratio for unbiodegradable part. COD [gn/gcod] Fpo4 - Phosphate [gpo4-p/gtp] FupP - P:COD ratio for unbiodegradable part. COD [gp/gcod] FZbh - OHO COD fraction [gcod/g of total COD] FZbm - Methylotroph COD fraction [gcod/g of total COD] 1.000E-4 FZaob - AOB COD fraction [gcod/g of total COD] 1.000E-4 FZnob - NOB COD fraction [gcod/g of total COD] 1.000E-4 FZamob - ANAMMOX COD fraction [gcod/g of total COD] 1.000E-4 FZbp - PAO COD fraction [gcod/g of total COD] 1.000E-4 FZbpa - Propionic acetogens COD fraction [gcod/g of total COD] 1.000E-4 FZbam - Acetoclastic methanogens COD fraction [gcod/g of total COD] 1.000E-4 FZbhm - H2-utilizing methanogens COD fraction [gcod/g of total COD] 1.000E-4 FZe - Endogenous products COD fraction [gcod/g of total COD] SECTION 3_PREFERRED NUTRIENT REMOVAL ALTERNATIVE ADDITIONAL ANALYSIS_V3.DOCX
67 MODELING AND EVALUATION OF NUTRIENT REMOVAL ALTERNATIVES Since the permit limits of greatest interest (TIN and TP) will be based on a one year window, it was decided to develop a one year diurnal input for the BioWin model. The plant data from 2012 was selected in order to avoid the flood condition that occurred in The diurnal flow pattern for the year was developed from an extensive data file of instantaneous flow values at 5 minute intervals. This data was reduced down to hourly values to facilitate the simulation runs, resulting in 8,784 separate entries for influent flow. A diurnal pattern for BOD, TSS, and TKN was developed based on a COD peak load factor of 1.65 as observed in the BioWin model prepared by the City, and a diurnal pattern for loadings derived from the City s BioWin model. The load diurnal variation was then applied to the flow diurnal pattern to develop concentrations of the parameters in the influent. In order to reflect the design condition of a peak month flow of 12.0 mgd and peak month loading of 27,800 lb/day, the daily data values from the plant database (Dlypar data file) were adjusted by the ratio of the actual 2012 peak month flow (6.5 mgd) and load (16,297 lb/day) to the design peak month flow and load. As a result, a factor of 1.85 was applied to the diurnal flow values for 2012, and a factor of 1.71 was applied to the daily average BOD, TSS, and NH3 N load values for Using the diurnal load variation and the adjusted daily average loads, diurnal values of BOD, TSS, and NH3 N concentrations were developed for input to the model. The resulting peak monthly flow and load values from the model input are 12.0 mgd and 27,800 lb/day, respectively, matching the design values. Temperature was entered as a daily average since that parameter does not typically vary on a diurnal basis. In effect, this data analysis created a diurnal flow and load (i.e., concentration) input to the BioWin model based on the patterns that occurred in 2012, but ramped up to the design condition. This approach captured both the diurnal variations but also the seasonal variations. The results of the BioWin modeling of the JHB alternative support the conclusions of the Pro2D modeling. Table 3 2 shows the results of the modeling relative to TIN and TP. TABLE 3 2 Biowin Diurnal Modeling Results Parameter/Condition Model Results Permit Limits TIN, mg/l Annual median 95 th percentile TP, mg/l Annual median 95 th percentile As shown, both permit conditions are met for both nutrients. This supports the conclusions of the Pro2D modeling. In addition to the TIN and TP concentrations in the effluent, the monthly and 7 day average effluent ammonia (NH3 N) values were determined from the model output to be 0.47 and 0.58 mg/l, respectively. This confirms that the operating factor (OF) assumed for the process in the Pro2D modeling will ensure stable nitrification and comply with current permitted limits. The other issue of interest from the diurnal modeling is related to air requirements. Table 3 3 lists the air requirements for various conditions determined through Pro2D modeling and BioWin modeling. SECTION 3_PREFERRED NUTRIENT REMOVAL ALTERNATIVE ADDITIONAL ANALYSIS_V3.DOCX 3-3
68 MODELING AND EVALUATION OF NUTRIENT REMOVAL ALTERNATIVES TABLE 3 3 Air Requirement Comparison Condition Air Required (Pro2D Results), scfm Air Required (BioWin Results), scfm Average annual 9,400 9,800 Peak 18 day 11,600 11,200 As shown, the air requirements are relatively close for the two modeling efforts for average and peak 18 day conditions. The peak day air requirement for sizing the blower system was conservatively based in Section 1 of this report on the ratio of peak day BOD loading to the peak 18 day BOD loading. A ratio of 1.45 was determined through an analysis of plant data. Since a slightly higher peak 18 day air requirement was determined using the Pro2D model, it is conservative to use that value as a basis for estimating the peak day air requirement, or required firm blower capacity. It is recommended that the higher air demand should be assumed and then verified during actual design. Overall, the dynamic modeling of the plant under simulated design conditions was a valuable exercise and confirmed the ability of the preferred alternative to meet the anticipated nutrient removal limits. 3.3 Solids Balance for Preferred Alternative A solids balance is prepared as part of the Pro2D modeling output. For the JHB process alternative, the highest sludge production results from the summer seasonal conditions. A solids balance for the peak 18 day condition is included in Appendix E. This solids balance tracks primary sludge (PSD) and waste activated sludge (WAS) production, WAS thickening, anaerobic digestion, and final biosolids to disposal. 3.4 Plant Modifications to Meet Potential Future Regulation 31 Permit Limits The preferred alternative is configured and sized to meet the anticipated regulatory discharge limits for TIN and TP per CDPHE Regulation 85. Future permit limits under the proposed Regulation 31 may be much more stringent, requiring modifications and additions to the plant treatment facilities. Although the exact values for the future limits are not specifically known, it is anticipated that they may be set at the limits of current treatment technology, or near to the following values: TN 3.0 mg/l permit limit TP 0.1 mg/l permit limit The frequency to which these limits may apply is not known, but could potentially be assumed to be on a 95 th percentile basis similar to the current limits. It is important to note that the regulation refers to total nitrogen (TN), not total inorganic nitrogen (TIN) as with the Regulation 85 limits. This is an important distinction, as TN adds in organic nitrogen, which is significant at the low concentrations being targeted. As discussed in previous sections of the Report, a factor of 0.6 is applied to the peak 18 day permit limits to determine treatment targets, resulting in the following values: TN 1.8 mg/l treatment target TP 0.06 mg/l treatment target These are aggressive treatment targets, and augmentation/modification of the recommended alternative (JHB) for meeting the near term nutrient requirements would be needed. A typical bioreactor configuration that can be used to meet low TIN targets is the 5 Stage Bardenpho process. This process, shown in a schematic in Figure 3 1, includes five separate zones. The first zone, anaerobic, functions in the same way as in the A2O and JHB alternatives considered in this Report for meeting the Regulation 85 permits limits, by encouraging the growth of bio P organisms. It is fed both 3-4 SECTION 3_PREFERRED NUTRIENT REMOVAL ALTERNATIVE ADDITIONAL ANALYSIS_V3.DOCX
 from Zone 3 to Zone 2 to dentrify nitrate formed")
69 MODELING AND EVALUATION OF NUTRIENT REMOVAL ALTERNATIVES primary effluent (PE) and return activated sludge (RAS). The second and third zones, anoxic and oxic, also function in a similar manner as in the A2O and JHB processes, including mixed liquor recycle (MLR) from Zone 3 to Zone 2 to dentrify nitrate formed in the oxic zone. The fourth and fifth zones are unique to the Bardenpho process. Nitrate formed in the first oxic zone that is not recycled with the MLR is denitrified in the fourth zone. Since there is little carbon available at that point in the process it help drive denitrification, it is necessary to add a supplemental carbon source, such as methanol, to that zone. The fifth zone, which is the second oxic zone, is intended as a polishing zone to oxidize excess carbon that leaves the upstream anoxic zone. FIGURE Stage Bardenpho Process Schematic By providing denitrification of the nitrate that is not recycled from the first oxic zone, this process can achieve very low concentrations of effluent nitrate. With thorough nitrification, the effluent is low in TIN, comprised of ammonia, nitrate, and nitrite. The 5 Stage Bardenpho Process can achieve relatively low concentrations of total phosphorus (TP), comparable to those from the three process considered for the Regulation 85 limits in this Report. Additional treatment is required to meet such low TP levels as may result from Regulation 31. Following secondary clarification, the remaining phosphorus is mostly in particulate form, but of a particle size that will not settle effectively in a secondary clarifier. Removal of the remaining particulates can be accomplished by a filtration system following the secondary clarifiers. A filtration system would thoroughly remove remaining particulates and allow meeting the TP target of 0.06 mg/l. The 5 Stage Bardenpho Process was modeled using the same approach as for the other treatment alternatives for Regulation 85 in order to establish approximate sizing for the facilities. The peak 18 day operating criteria and flows/loads were assumed, and all three seasons were evaluated. The modeling determined that the treatment targets could be met with a total bioreactor volume of 6.0 mgal, or approximately 1.76 mgal additional volume to that provided with the JHB process. The near term expansion bioreactors would need to be modified to provide the configuration described above for the 5 Stage process. A methanol (or other carbon source) feed facility would be needed to provide supplemental carbon to the second anoxic zone. Filtration would be provided by a filtration facility containing approximately 2,000 ft 2 of filter area. Since a fourth secondary clarifier would be constructed with the near term expansion, and the flow increase for the future limits would be nominal (12.0 mgd to 13.3 mgd peak month), it would not be necessary to add a fifth clarifier. Table 3 4 lists the sizes and criteria for the new facilities. SECTION 3_PREFERRED NUTRIENT REMOVAL ALTERNATIVE ADDITIONAL ANALYSIS_V3.DOCX 3-5
70 MODELING AND EVALUATION OF NUTRIENT REMOVAL ALTERNATIVES Appendix F shows a conceptual site plan for the new facilities. As shown, the additional future bioreactor could be located on the west side of the site near the third train. This would facilitate conveyance of mixed liquor from the upstream trains to the new bioreactor. A lift pump station may be needed to lift the mixed liquor to the new bioreactor, although hydraulic modeling indicates that there may be sufficient head available to incorporate the new bioreactor into the hydraulic profile. This would need to be investigated during planning for this future expansion. An expansion of the existing Blower Building is shown to accommodate the increased air demand. It may be possible to provide the required air in the existing building, however, particularly if the existing blowers were to be replaced with high speed turbo blowers. As noted above, an additional secondary clarifier (beyond the fourth clarifier added in the near term) does not appear to be necessary and is not shown. However, a new third primary clarifier is shown, located where one of the existing abandoned trickling filter structures resides. This is necessary to meet CDPHE criteria. A methanol (or other chemical) feed facility is shown to the south of the future bioreactor. As noted above, methanol feed would be needed to meet the effluent TN target. It is certain that a lift station would be needed to lift the secondary effluent to the filter facility, which is shown near the UV Facility. The effluent from the filters would be conveyed back to the existing UV Facility for disinfection. As per the recent laboratory study, a water quality lab facility is shown to the south of the new filter facility. The site plan indicates that sufficient site space is available to incorporate all of the necessary facilities TABLE Stage Bardenpho Process Plant Modification Details and Sizing Feature Bioreactors Total existing volume, mgal (future) Additional volume required, mgal Total bioreactor volume, mgal Zone 1 (ANA) volume, mgal (%) Zone 2 (ANX) volume, mgal (%) Zone 3 (OX) volume, mgal (%) Zone 4 (ANX) volume, mgal (%) Zone 5 (OX) volume, mgal (%) MLR pump capacity Methanol feed, gpd (peak 18 day) Air Requirements, scfm Peak 18 day average Winter Spring/Fall Summer Peak day average 2 Winter Spring/Fall Summer Filter Facility Total filter area, ft 2 Filter loading rate, peak 18 day, gpm/ft 2 Winter Spring/Fall Summer Value (10%) 0.9 (15%) 3.0 (50%) 1.2 (20%) 0.3 (5%) 300 percent of peak month (24 mgd total) ,800 17,800 14,400 22,900 25,800 20,900 2, Notes: 1 Methanol requirement varies by season. 2 Diurnal peak on peak month air requirement (CDPHE requirement) is less than for peak day average. 3-6 SECTION 3_PREFERRED NUTRIENT REMOVAL ALTERNATIVE ADDITIONAL ANALYSIS_V3.DOCX
71 3.5 Implementation Plan MODELING AND EVALUATION OF NUTRIENT REMOVAL ALTERNATIVES A schedule for project implementation is presented below in Figure 3 2. A request for preliminary effluent limits (PELs) should be made in late 2014 so that the effluent limits for nutrient removal which will appear in the next permit cycle can be confirmed prior to commencement of design. Design is scheduled to occur in 2015 with bidding of the construction project in early Construction is scheduled to occur over approximately 18 months during 2016 and The City has obtained a $1,000,000 design and construction grant for the nutrient removal project which must be spent by May 31, Most of the grant can be utilized for project design in 2015 and the remainder of the grant can be utilized for the initial construction activities in Should the City decide to delay construction of the nutrient removal facilities, the remainder of the grant could be utilized to purchase known equipment or materials which would be required for the project (e.g. blowers). From an operational standpoint, the nutrient removal facilities will add a new process (biological phosphorus removal) and an enhanced existing process (denitrification). Additional structural, mechanical, and electrical components will be added to the plant which will require additional operation and maintenance attention. Also, additional laboratory analyses will be required for both operation and compliance needs. It is estimated that additional full time WWTP staff position will be required for the combined needs of operations, maintenance, and laboratory. Training for nutrient removal operations is also recommended prior to startup of the new facilities. SECTION 3_PREFERRED NUTRIENT REMOVAL ALTERNATIVE ADDITIONAL ANALYSIS_V3.DOCX 3-7
72
73 FIGURE 3 2 Project Implementation Schedule SECTION 3_PREFERRED NUTRIENT REMOVAL ALTERNATIVE ADDITIONAL ANALYSIS_V3.DOCX 3-8
74
75 SECTION 3_PREFERRED NUTRIENT REMOVAL ALTERNATIVE ADDITIONAL ANALYSIS_V1_ERD.DOCX Appendix A Drawing Markups for A2O
76
77 S "W F D C E E E E B N E E Q K J L P 4910 T S G G G NPW C N "E N Scale In Feet FUTURE CONTRACTOR ANAEROBIC DEWATERING STAGING AREA SLUDGE DRYING BASINS SLUDGE DRYING BASINS WAS THICKENING DIGESTERS BUILDING FACILITY A OIL STORAGE SHED B C S "W S "W S "W SS AEROBIC DIGESTERS (ABANDONED) R= L=5.45 DELTA= " CB=N "E C. DIST.=5.45 R = L = 5.45 DELTA = " C.DOST = 5.45 INFLUENT STRUCTURE (ABANDONED) PAVEMENT REPLACEMENT BLOWER BUILDING NO. 1 EXISTING DAF SLUDGE THICKENER TO BE DEMOLISHED, SEE DWG 005-C-1001 PARKING AREA FERRIC CHLORIDE FEED SYSTEM GATE CP N PLANT N E ELEV BIOFILTER HEADWORKS BUILDING MANHOLE "A" SS GATE 2.5 DIAM. TREE STUMP CO 4917 GARAGE EMERGENCY SLUDGE HOLDING FACILITY PAVEMENT REPLACEMENT 4916 DIGESTER PIPING MODIFICATIONS CO COCO CO CO CO CO CO CO CO SS TUXHORN BLVD ADMINISTRATION BUILDING N "E MANHOLE "1" EXISITING BENCHMARK SEE NOTE 7 BENCHMARK 2 2" ALUM. CAP ELEV = TRICKLING PRIMARY FILTER NO. 1 CLARIFIER NO. 2 (NOT IN SERVICE) PRIMARY TRICKLING CLARIFIER NO. 1 FILTER NO. 2 (NOT IN SERVICE) ADMINISTRATION BUILDING/ CONTROL BUILDING BASEMENT WAS PUMP/PIPING MODIFICATIONS N "E MAINTENANCE SHOP AND NON POTABLE WATER PUMP STATION MANHOLE "2" SLUDGE DRYING BASINS AERATION LIFT PUMP STATION UV BENCHMARK 3 BUILDING 2" ALUM. CAP STAND BY ELEVATION = CLARIFIER (ABANDONED & BUIRED) SECONDARY SECONDARY CLARIFIER NO. 1 CLARIFIER NO. 2 VORTEX GRIT CHAMBER/ GRIT PUMP STATION 20" SST AIR AERATION BASIN NO. 5 AND 6 NORTH AERATION BASIN " PE ODOR CONTROL FACILITY HEADWORKS SCREW PUMPS BENCHMARK 1 BUILDING (ABANDONED) 2" ALUM. CAP ELEVATION = CP W PLANT (ADJUSTED) N E ELEV " RAS H G SPEED LIMIT 30 TRAIN 3 CO CO BLOWER ELECTRIC BUILDING NO. 2 SS CHLORINE CONTACT BASIN (ABANDONED) NPW 18" RAS SECONDARY CLARIFIER NO. 3 6" SSM CO ELECTRICAL 4910 ROOM EXPANSION 20" ML DISINFECTION SOUTH ACCESS GATE EXISTING FIRE HYDRANT, SEE NOTE SEC NO " SE CLARIFIER CO N "E C C C AC PAVING CP OUTLET-RESET N E ELEV APPROX 100 YR FLOOD PLAIN SS SS GATE PROJECT SIGN N "E CP SW PLANT N E ELEV /2012 RECORD DRAW ING CRC APP W W TP W AS THICKENING FACILITY LOVELAND W W TP CITY OF LOVELAND NO. DATE REVISION BY APVD DSGN DR CHK APVD LOVELAND, COLORADO A PAQUET A PAQUET C SCHNEE K FOSS REUSE OF DOCUMENTS: THIS DOCUMENT, AND THE IDEAS AND DESIGNS INCORPORATED HEREIN, AS AN INSTRUMENT OF PROFESSIONAL SERVICE, IS THE PROPERTY OF c CH2M HILL ALL RIGHTS RESERVED. CH2M HILL AND IS NOT TO BE USED, IN W HOLE OR IN PART, FOR ANY OTHER PROJECT W ITHOUT THE W RITTEN AUTHORIZATION OF CH2MHILL S "W S "W S "E SOUTH BOISE AVE S "W S "W FLOW METER VAULT CHEMICAL TRUCK COUNTY ROAD 11H N "E N "E CONSTRUCTION ACCESS GATE LOADOUT SLAB INFLUENT PUMP STATION CIVIL SITE PLAN D OVERALL SITE PLAN VERIFY SCALE BAR IS ONE INCH ON ORIGINAL DRAWING. 0 1" DATE PROJ DWG SHEET RECORD DRAW INGS FILENAME: PLOT DATE: PLOT TIME: $FILENAME $PLOTDATE $PLOTTIME
78
79
80
81
82
83
84
85 SECTION 3_PREFERRED NUTRIENT REMOVAL ALTERNATIVE ADDITIONAL ANALYSIS_V1_ERD.DOCX Appendix B Drawing Markups for JHB
86
87 S "W F D C E E E E B N E E Q K J L P 4910 T S G G G NPW C N "E N Scale In Feet FUTURE CONTRACTOR ANAEROBIC DEWATERING STAGING AREA SLUDGE DRYING BASINS SLUDGE DRYING BASINS WAS THICKENING DIGESTERS BUILDING FACILITY A OIL STORAGE SHED B C S "W S "W S "W SS AEROBIC DIGESTERS (ABANDONED) R= L=5.45 DELTA= " CB=N "E C. DIST.=5.45 R = L = 5.45 DELTA = " C.DOST = 5.45 INFLUENT STRUCTURE (ABANDONED) PAVEMENT REPLACEMENT BLOWER BUILDING NO. 1 EXISTING DAF SLUDGE THICKENER TO BE DEMOLISHED, SEE DWG 005-C-1001 PARKING AREA FERRIC CHLORIDE FEED SYSTEM GATE CP N PLANT N E ELEV BIOFILTER HEADWORKS BUILDING MANHOLE "A" SS GATE 2.5 DIAM. TREE STUMP CO 4917 GARAGE EMERGENCY SLUDGE HOLDING FACILITY PAVEMENT REPLACEMENT 4916 DIGESTER PIPING MODIFICATIONS CO COCO CO CO CO CO CO CO CO SS TUXHORN BLVD ADMINISTRATION BUILDING N "E MANHOLE "1" EXISITING BENCHMARK SEE NOTE 7 BENCHMARK 2 2" ALUM. CAP ELEV = TRICKLING PRIMARY FILTER NO. 1 CLARIFIER NO. 2 (NOT IN SERVICE) PRIMARY TRICKLING CLARIFIER NO. 1 FILTER NO. 2 (NOT IN SERVICE) ADMINISTRATION BUILDING/ CONTROL BUILDING BASEMENT WAS PUMP/PIPING MODIFICATIONS N "E MAINTENANCE SHOP AND NON POTABLE WATER PUMP STATION MANHOLE "2" SLUDGE DRYING BASINS AERATION LIFT PUMP STATION UV BENCHMARK 3 BUILDING 2" ALUM. CAP STAND BY ELEVATION = CLARIFIER (ABANDONED & BUIRED) SECONDARY SECONDARY CLARIFIER NO. 1 CLARIFIER NO. 2 VORTEX GRIT CHAMBER/ GRIT PUMP STATION 20" SST AIR AERATION BASIN NO. 5 AND 6 NORTH AERATION BASIN " PE ODOR CONTROL FACILITY HEADWORKS SCREW PUMPS BENCHMARK 1 BUILDING (ABANDONED) 2" ALUM. CAP ELEVATION = CP W PLANT (ADJUSTED) N E ELEV " RAS H G SPEED LIMIT 30 TRAIN 3 CO CO BLOWER ELECTRIC BUILDING NO. 2 SS CHLORINE CONTACT BASIN (ABANDONED) NPW 18" RAS SECONDARY CLARIFIER NO. 3 6" SSM CO ELECTRICAL 4910 ROOM EXPANSION 20" ML DISINFECTION SOUTH ACCESS GATE EXISTING FIRE HYDRANT, SEE NOTE SEC NO " SE CLARIFIER CO N "E C C C AC PAVING CP OUTLET-RESET N E ELEV APPROX 100 YR FLOOD PLAIN SS SS GATE PROJECT SIGN N "E CP SW PLANT N E ELEV /2012 RECORD DRAW ING CRC APP W W TP W AS THICKENING FACILITY LOVELAND W W TP CITY OF LOVELAND NO. DATE REVISION BY APVD DSGN DR CHK APVD LOVELAND, COLORADO A PAQUET A PAQUET C SCHNEE K FOSS REUSE OF DOCUMENTS: THIS DOCUMENT, AND THE IDEAS AND DESIGNS INCORPORATED HEREIN, AS AN INSTRUMENT OF PROFESSIONAL SERVICE, IS THE PROPERTY OF c CH2M HILL ALL RIGHTS RESERVED. CH2M HILL AND IS NOT TO BE USED, IN W HOLE OR IN PART, FOR ANY OTHER PROJECT W ITHOUT THE W RITTEN AUTHORIZATION OF CH2MHILL S "W S "W S "E SOUTH BOISE AVE S "W S "W FLOW METER VAULT CHEMICAL TRUCK COUNTY ROAD 11H N "E N "E CONSTRUCTION ACCESS GATE LOADOUT SLAB INFLUENT PUMP STATION CIVIL SITE PLAN D OVERALL SITE PLAN VERIFY SCALE BAR IS ONE INCH ON ORIGINAL DRAWING. 0 1" DATE PROJ DWG SHEET RECORD DRAW INGS FILENAME: PLOT DATE: PLOT TIME: $FILENAME $PLOTDATE $PLOTTIME
88
89
90
91
92
93
94
95 SECTION 3_PREFERRED NUTRIENT REMOVAL ALTERNATIVE ADDITIONAL ANALYSIS_V1_ERD.DOCX Appendix C Drawing Markups for Step-Feed
96
97 S "W F D C E E E E B N E E Q K J L P 4910 T S G G G NPW C N "E N Scale In Feet A AEROBIC DIGESTERS (ABANDONED) B C S "W S "W S "W SS R= L=5.45 DELTA= " CB=N "E C. DIST.=5.45 R = L = 5.45 GATE FUTURE CONTRACTOR ANAEROBIC DEWATERING STAGING AREA SLUDGE DRYING BASINS SLUDGE DRYING BASINS WAS THICKENING DIGESTERS BUILDING FACILITY DELTA = " C.DOST = 5.45 INFLUENT STRUCTURE (ABANDONED) PAVEMENT REPLACEMENT BLOWER BUILDING NO. 1 EXISTING DAF SLUDGE THICKENER TO BE DEMOLISHED, SEE DWG 005-C-1001 CP N PLANT N E ELEV BIOFILTER HEADWORKS BUILDING MANHOLE "A" C-2002 GARAGE EMERGENCY SLUDGE HOLDING FACILITY PARKING AREA FERRIC CHLORIDE FEED SYSTEM SS GATE 2.5 DIAM. TREE STUMP CO 4916 DIGESTER PIPING MODIFICATIONS 6" PSD CO COCO CO CO CO CO CO CO CO SS TUXHORN BLVD ADMINISTRATION BUILDING N "E MANHOLE "1" EXISITING BENCHMARK 6" TSL SEE NOTE 7 BENCHMARK 2 2" ALUM. CAP ELEV = TRICKLING PRIMARY FILTER NO. 1 CLARIFIER NO. 2 (NOT IN SERVICE) 2" FO PRIMARY TRICKLING CLARIFIER NO. 1 FILTER NO. 2 (NOT IN SERVICE) ADMINISTRATION BUILDING/ CONTROL BUILDING BASEMENT WAS PUMP/PIPING MODIFICATIONS VORTEX GRIT CHAMBER/ GRIT PUMP STATION NORTH AERATION BASIN 1-4 ODOR CONTROL FACILITY HEADWORKS SCREW PUMPS BUILDING (ABANDONED) N "E C C C C-2003 PAVEMENT REPLACEMENT OIL STORAGE SHED H G MAINTENANCE SHOP AND NON POTABLE WATER PUMP STATION GRAVITY THICKENER/ FERMENTER AND BIOFILTER MANHOLE "2" SLUDGE DRYING BASINS AERATION LIFT PUMP STATION UV BENCHMARK 3 BUILDING 2" ALUM. CAP STAND BY ELEVATION = CLARIFIER (ABANDONED & BUIRED) SECONDARY SECONDARY CLARIFIER NO. 1 CLARIFIER NO. 2 BLOWER ELECTRIC BUILDING NO. 2 AERATION BASIN NO. 5 AND 6 20" ML BENCHMARK 1 2" ALUM. CAP ELEVATION = ELEV " RAS CO CO CHLORINE CONTACT BASIN (ABANDONED) SECONDARY CLARIFIER NO. 3 6" SSM DISINFECTION SOUTH ACCESS GATE EXISTING FIRE HYDRANT, SEE NOTE 6 CP W PLANT (ADJUSTED) TEMPORARY POWER HOOKUP, N COORDINATE WITH CITY OF E LOVELAND POWER UTILITY SPEED LIMIT C-2006 SS NPW CO ELECTRICAL 4910 ROOM EXPANSION SEC NO " SE CLARIFIER CO N "E 05-C C-2009 C C C AC PAVING CP OUTLET-RESET N E ELEV APPROX 100 YR FLOOD PLAIN SS SS GATE PROJECT SIGN N "E CP SW PLANT N E ELEV /2012 RECORD DRAW ING CRC APP W W TP W AS THICKENING FACILITY LOVELAND W W TP CITY OF LOVELAND NO. DATE REVISION BY APVD DSGN DR CHK APVD LOVELAND, COLORADO A PAQUET A PAQUET C SCHNEE K FOSS REUSE OF DOCUMENTS: THIS DOCUMENT, AND THE IDEAS AND DESIGNS INCORPORATED HEREIN, AS AN INSTRUMENT OF PROFESSIONAL SERVICE, IS THE PROPERTY OF c CH2M HILL ALL RIGHTS RESERVED. CH2M HILL AND IS NOT TO BE USED, IN W HOLE OR IN PART, FOR ANY OTHER PROJECT W ITHOUT THE W RITTEN AUTHORIZATION OF CH2MHILL S "W S "W S "E SOUTH BOISE AVE S "W S "W FLOW METER VAULT CHEMICAL TRUCK COUNTY ROAD 11H N "E N "E CONSTRUCTION ACCESS GATE LOADOUT SLAB INFLUENT PUMP STATION CIVIL SITE PLAN D OVERALL SITE PLAN VERIFY SCALE BAR IS ONE INCH ON ORIGINAL DRAWING. 0 1" DATE JANUARY 2011 PROJ DWG 005-C-2001 SHEET 19 RECORD DRAW INGS FILENAME: PLOT DATE: PLOT TIME: $FILENAME $PLOTDATE $PLOTTIME
98
99
100
101
102
103 Appendix D Dynamic Modeling Output and Results SECTION 3_PREFERRED NUTRIENT REMOVAL ALTERNATIVE ADDITIONAL ANALYSIS_V1_ERD.DOCX
104
105 25 20 Flow /01/ /03/ /05/ /07/2012 8/09/2012 7/11/2012 Raw Sewage Flow Monthly Avg
106 60,000 40,000 20, /01/ /03/ /05/ /07/2012 8/09/2012 7/11/2012 Raw Sewage Total Carbonaceous BOD Mass rate Monthly Avg
107 /01/ /03/ /05/ /07/2012 Raw Sewage Total Carbonaceous BOD 8/09/2012 7/11/2012 Raw Sewage Total suspended solids
108 /01/ /03/ /05/ /07/2012 Raw Sewage Total Kjeldahl Nitrogen Raw Sewage Total P 8/09/2012 Raw Sewage Ammonia N 7/11/2012
109 14,000 12,000 10,000 8,000 6,000 4,000 2, /01/ /03/ /05/ /07/2012 8/09/2012 7/11/2012 Total Airflow Rate Avg Daily Airflow
110 4 3 95th Percentile Effluent Limit /01/ /03/ /05/ /07/2012 8/09/2012 7/11/2012 Effluent Total P Effluent Composite Total P (flow weighted)
111 th Percentile Effluent Limit /01/ /03/ /05/ /07/2012 8/09/2012 7/11/2012 Effluent Total inorganic N Effluent Composite Total inorganic N (flow weighted)
112 /01/ /03/ /05/ /07/2012 8/09/2012 7/11/2012 Raw Sewage Temperature
113 Bioreactor1 Bioreactor2 Bioreactor3 Bioreactor4 Bioreactor5 Bioreactor6 Bioreactor7 Bioreactor8 Soluble PO4-P
114 1,200 1, /01/ /03/ /05/ /07/2012 8/09/2012 7/11/2012 Sec Clar Surface overflow rate
115 /01/ /03/ /05/ /07/2012 8/09/2012 7/11/2012 Sec Clar Solids loading rate
116 2,500 2,000 1,500 1, /01/ /03/ /05/ /07/2012 Bioreactor8 Volatile suspended solids 8/09/2012 7/11/2012 Bioreactor8 Total suspended solids
117 SECTION 3_PREFERRED NUTRIENT REMOVAL ALTERNATIVE ADDITIONAL ANALYSIS_V1_ERD.DOCX Appendix E Solids Balance
118
119 Solids Balance from Pro2D JHB Peak 18 day, Summer Constituent Raw Wastewater (RW) WAS Thickening Recycle (TWASR) Plant Effluent (PLE) Primary Sludge (PSD) WAS WAS Thickener Influent (TWASI) Thickened WAS (TWAS) Solids Combined Discharge Meso Anaerobic Digester Influent (AnDI) Meso Anaerobic Digester Effluent (AnDE) Biosolids to Disposal Flow (gallons/day) 12,100, ,466 12,027,557 56, , ,848 16,382 72,448 72,448 72,448 72,448 Carbonaceous BOD5 (lbs/da 29, ,489 4,530 4,530 4,075 17,565 17,565 3,755 3,755 COD (lbs/day) 59,146 1,072 3,060 27,950 10,540 10,540 9,468 37,418 37,418 15,062 15,062 TSS (lbs/day) 28, ,506 18,716 9,115 9,115 8,203 26,919 26,919 11,577 11,577 VSS (lbs/day) 27, ,210 17,585 7,325 7,325 6,592 24,177 24,177 9,721 9,721 TKN (lbs/day) 3, ,125 1,125 1,125 1,125 NH3-N (lbs-n/day) 2, NO2-N (lbs-n/day) NO3-N (lbs-n/day) Total Nitrogen (lbs-n/day) 3, ,126 1,126 1,125 1,125 TIN (lbs-n/day) 2, TP (lbs-p/day) Alkalinity (lbs/day as CaCO3 21, , ,371 2,371 H2S (lbs/day) Temperature (oc) BOD5 (mg/l) ,829 2,729 2,729 29,809 29,051 29,051 6,211 6,211 COD (mg/l) ,735 6,351 6,351 69,254 61,887 61,887 24,911 24,911 TSS (mg/l) ,000 5,492 5,492 60,000 44,522 44,522 19,147 19,147 VSS (mg/l) ,582 4,414 4,414 48,217 39,987 39,987 16,078 16,078 TKN (mg-n/l) , ,763 1,860 1,860 1,860 1,860 NH3-N (mg-n/l) ,018 1,018 NO2-N (mg/l) NO3-N (mg-n/l) Total Nitrogen (mg/l) , ,770 1,862 1,862 1,860 1,860 TIN (mg/l) TP (mg-p/l) , Alkalinity (mg/l as CaCO3) ,921 3,921 H2S (mg/l)
120
121 SECTION 3_PREFERRED NUTRIENT REMOVAL ALTERNATIVE ADDITIONAL ANALYSIS_V1_ERD.DOCX Appendix F Site Plan for Future Plant Facilities
122


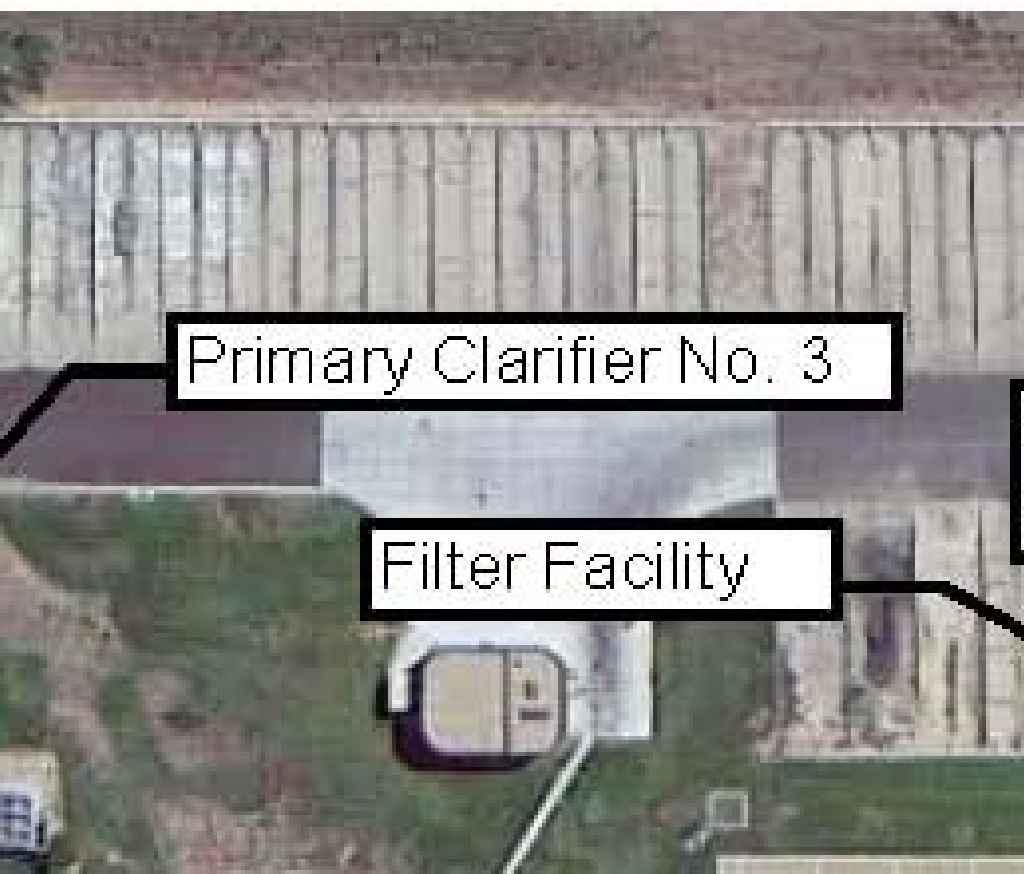


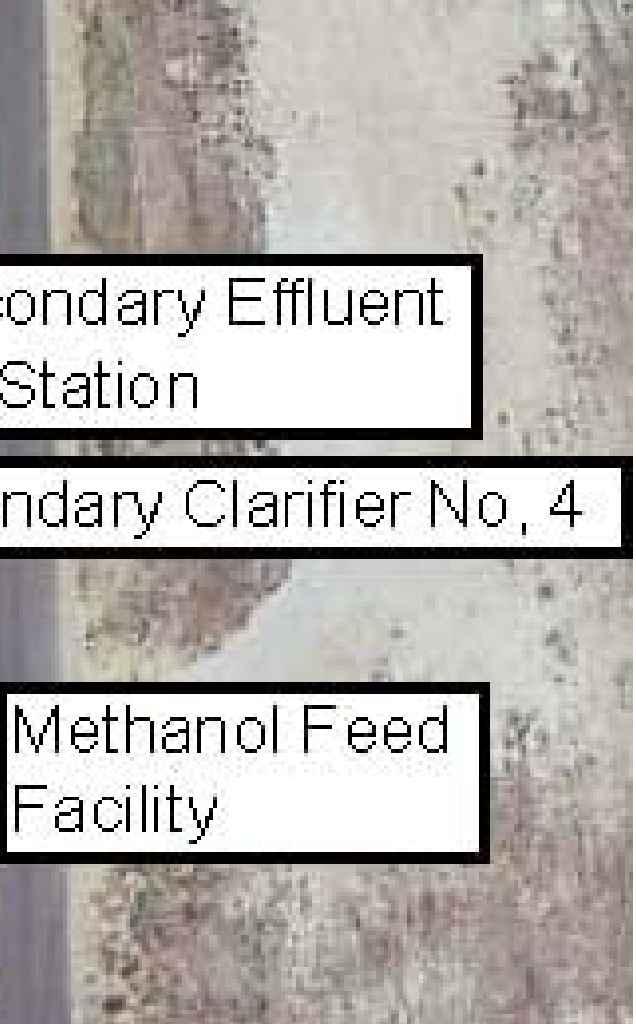


123 ' CH2M HILL