2016 Tourism Advertising Accountability Research. November 2016
|
|
|
- Gregory Garrett
- 5 years ago
- Views:
Transcription

1 2016 Tourism Advertising Accountability Research November 2016
2 Table of Contents Research Objective... 3 Background. 4 Research Method.. 6 Advertising Impacts.. 9 Oklahoma Past Visitation & Intent.. 12 Advertising Awareness.. 15 Short-Term Impacts of the Advertising. 25 Appendix 1: Media Considerations,.. 29 Appendix 2: Economic Development Image Rating 36 Appendix 3: Impact of Ads on Trip Planning and Visiting
3 Research Objective The purpose of this research was to provide an evaluation of Oklahoma s tourism advertising in terms of: Awareness of the advertising The bottom line return on Oklahoma s investment in the campaign in terms of: Incremental travel to Oklahoma Incremental visitor spending in Oklahoma Incremental state and local taxes 3
4 Background Oklahoma advertising markets in 2016: Houston, TX, Dallas-Ft. Worth. TX, St. Louis, MO, San Antonio, TX, Kansas City, MO, KS, Austin, TX, Oklahoma City, OK, Little Rock-Pine Bluff, AR, Tulsa, OK, Wichita-Hutchinson. KS, Springfield, MO, Ft. Smith-Fayetteville-Springdale-Rodgers, AK, Amarillo, TX, and Wichita Falls-Lawton, TX, OK DMAs. A map follows on the next page. Total advertising investment was approximately $2.26 million Media used included TV, Online Video, Digital, and Print. 4
5 Oklahoma s 2016 Advertising Markets 5
6 Research Method The study was conducted among a representative sample of adult travelers residing in Oklahoma s advertising markets. Travelers mean respondents had taken a day and/or overnight pleasure trip anywhere in the past 3 years and intend to take another in the next 2 years. (70% of those sampled met these requirements.) The study was conducted online with a sample demographically balanced to represent the population in the markets surveyed. 1,407 individuals participated in this research. 6
7 Research Method (Cont d) Questionnaire content included: Travel to Oklahoma Respondents reported trips they took to Oklahoma during and shortly after the advertising campaign. Advertising Awareness Actual creative from the Spring/Summer 2016 campaign was exposed and respondents reported recall of each. We use this forced exposure approach to ensure that we are measuring the Oklahoma s sponsored advertising only not that of Oklahoma s attractions and accommodation facilities. 7
8 Research Method (Cont d) ROI calculation: The Longwoods R.O.EYE method quantifies the relationship between awareness of campaign elements and trip taking. A baseline measure is generated to estimate the level of visitation that would have occurred in the absence of advertising activity. Using the principles and techniques of experimental design, we control for the effects of internal and external factors that could otherwise influence the result, such as economic conditions, weather, prior visitation, etc. 8
9 Advertising Impacts For the 2016 campaign, Oklahoma s advertised markets, awareness across all media was 52%. The awareness level increased 5% from 47% in For the individual media types, Digital and Online Video had the highest awareness at 37%. Print and Television awareness were slightly lower at 31%. Among the individual media types, for the Digital ad awareness was similar for four of the six digital ads, with the travel guide and outdoor guide ads being lower. Similarly, the two of the four Online Video ads had similar awareness, with the travel guide and outdoor guide ads being lower. Each Print ads had similar awareness levels. Similarly, each of the Television had similar awareness levels. 9
10 Advertising Impacts (Cont d) Based on Longwoods methodology, we estimate that the investment of $2.26 million dollars generated in the short term, increasing: 1.42 million new visitors to Oklahoma who would not otherwise have come, this up 16.3% from 2015 these incremental visitors spent approximately $210 million in Oklahoma, this increased 2.6% from 2015 the incremental spending resulted in $16.6 million in incremental state and local taxes up 7.1% from 2015 but still generating but with the same return on investment of 7:1 the incremental spending resulted in $9.7 million in incremental state taxes or return on investment of 4:1 and $6.9 million in incremental local taxes or a return on investment of 3:1. 10
11 Advertising Impacts (Cont d) In addition to the short term impacts, we estimate that the advertising influenced the planning of 1.22 million additional trips to Oklahoma in the next 12 months. While not all of these planned trips will actually happen, those that do will add to the return on Oklahoma s investment in tourism marketing. 11
12 Oklahoma Past Visitation & Intent

13 Took a Trip to Oklahoma Since January 1, 2016 Base: Total Travelers Took an Oklahoma Trip 41% 13
14 Percent who Definitely/Probably Will Visit Intent to Visit Oklahoma in the Next Year Base: Total Travelers Overnight/Day Overnight Day 14
15 Advertising Awareness
16 Awareness of Oklahoma s Advertising Base: Total Travelers Awareness level is up 5% from 47% in 2015 Aware of Any Ad 52% 16


17 Awareness by Media Base: Total Travelers Any Ad 52 Digital Online Video Print 3 33 TV Percent Any Only 17
18 Awareness by Media Combinations Base: Total Travelers TV & Print TV & Digital only Digital & Print Online Video & Print Online Video & Digital only Online Video & TV TV & Print & Digital Online Video & Print & Digital TV & Digital& Online Video TV & Print & Online Video All Four Types Less than 0.5% Percent 18


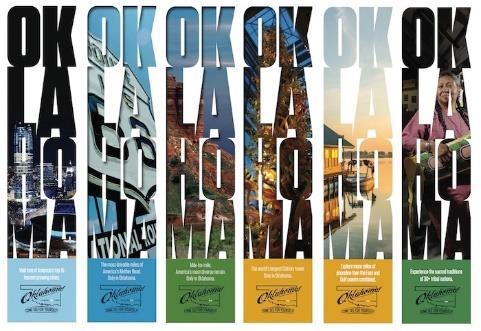
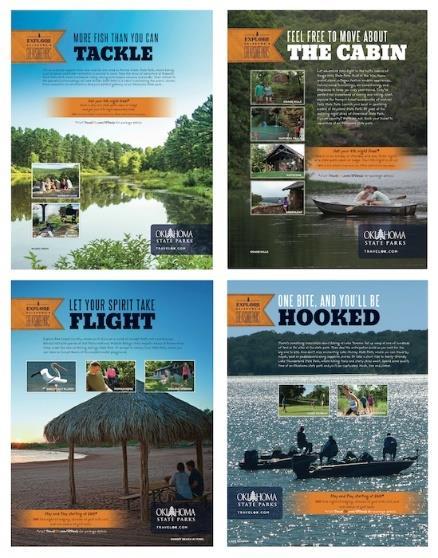
19 Digital Creative Camping & Hiking Kayaking & Lakes Outdoor Guide Travel Guide Route 66 & State Parks Tulsa & Urban 19

20 Awareness of Individual Ads Digital Base: Total Travelers Any Digital Ad 37 Camping & Hiking Route 66 & State Parks Kayaking & Lakes Tulsa & Urban Travel Guide Outdoor Guide Percent 20


21 Awareness of Individual Ads Online Video Base: Total Travelers Any Online Video 37 T10-16-OTRD 24 T16-16-OTRD 23 Travel Guide 15 Outdoor Guide Percent 21

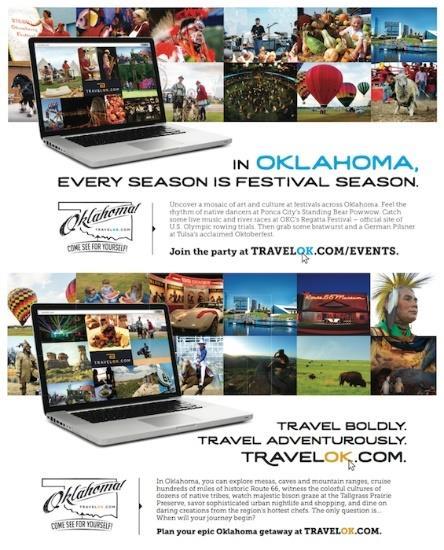
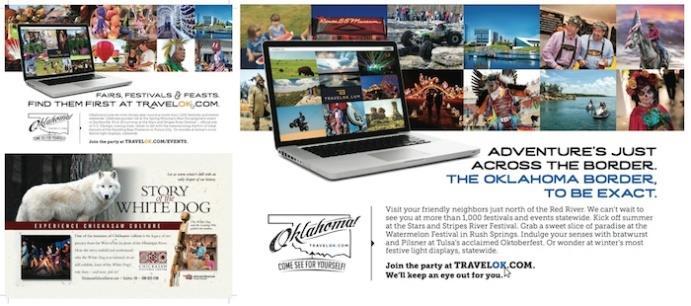
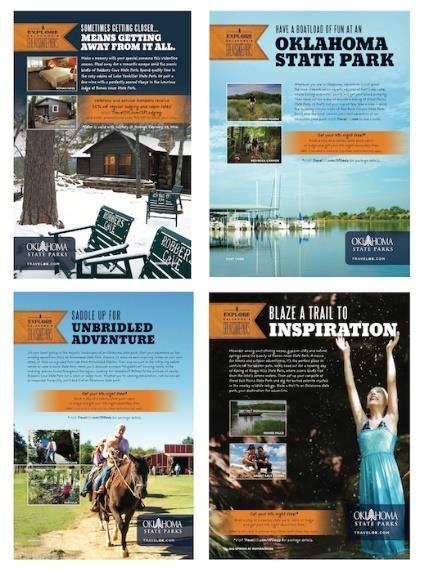

22 Print Creative Midwest Living/American Road AAA Texas/AARP State of Success Missouri Life/AAA Home & Away State Parks #1 State Parks #2 Tulsa Visitor Guide 22


23 Awareness of Individual Ads Print Base: Total Travelers Any Print 33 State of Success State Parks #1 Tulsa Visitors Guide State Parks #2 Missouri Life/AAA Home & Away Midwest Living/American Road AAA Texas/AARP Percent 23

24 Awareness of Individual Ads Television Base: Total Travelers Any Television 30 T OTRD 21 T OTRD Percent 24
25 Short-Term Impacts of the Advertising
26 Short-Term Impacts of The Advertising % Change Ad Investment $2,249,972 $2,255, % Incremental Visits 1,222,257 1,422, % Incremental Spending $204.6 M $210.0 M +2.6% State and Local Taxes $15.5 M $16.6 M +7.1% Spending ROI* $91 $ % Total Tax ROI** $7 $7 nil State Tax ROI** $4 $4 nil Local Tax ROI** $3 $3 nil Incremental visitor spending per ad $ invested. Spending is based on $ per person for overnight trips and $45.15 per person for day trips in 2015 ** Incremental taxes per ad $ invested 7.9% (4.6% state and 3.3% local) 26
27 Campaign Efficiency Incremental Visits 1,222,257 1,422,071 Ad Investment $2,249,972 $2,255,567 Ad $ s per Trip $1.84 $1.59 Trips per Ad $
28 Longer-Term Impact of Advertising Intent to Visit Oklahoma in Next 12 Months 2016 Overnight 791,471 Day 432,489 Total Intenders 1,223,959 Difference in markets between 2015 and 2016 does not allow a comparison. 28
29 Appendix 1: Media Considerations

30 Visitation Percent Impact of Advertising on Trip Taking Base: Total Travelers Total Aware* Unaware *Saw at least one ad 30


31 Percent Impact on Visitation to Oklahoma by Number of Media Channels Base: Total Travelers Total Aware of Any Ad Unaware of Any Ad 1 Channel 2 Channels 3 Channels 4 Channels 31
32 % Visited Oklahoma Impact of Ad Frequency on Visits to Oklahoma Below Optimal Optimal Diminishing Mean = 16.3 Median = 7.0 Number of Times Seen/Heard Ads 32
33 Millions of Impressions Total Impressions by Media 100 Media Spend: Print $ 96,850 Digital/Online Video $ 881,094 Television $1,277, Digital/Online Video Print Television 33

34 Dollars Cost Per Thousand Exposures By Medium Total Exposures = Million Media Spend: Print $ 96,850 Digital/Online Video $ 881,094 Television $1,277, Any Ad Television Digital/Online Video 11 2 Print 34

35 Avg. Number Frequency of Ad Exposure Recalled* Base: Total Travelers 20 Total = Million Exposures Any Print Digital/Online Video Television *Saw at least one ad 35
36 Appendix 2: Economic Development Image Ratings

37 Economic Development Image Ratings Through Longwoods research, a link has been established between tourism advertising and economic development image ratings. This link also occurs in Oklahoma s 2016 advertised markets. On average, the Oklahoma economic development image ratings increased 113% in advertising awareness and 18% in visitation. The combination of the awareness and visitation provides a sizeable lift for all image attributes, especially for a good place to buy a vacation home and a good place to retire. 37


38 Impact of Oklahoma 2016 Tourism Campaign on State s Economic Development Image Base: Out-of-State Residents A good place to live % A good place to start a career % A good place to start a business A good place to attend college % A good place to purchase a vacation home % A good place to retire % Percent Who Strongly Agree Aware Unaware 38


39 Impact of 2016 Visitation on Oklahoma Economic Development Image Base: Out-of-State Residents A good place to live % A good place to start a career % A good place to start a business % A good place to attend college % A good place to purchase a vacation home % A good place to retire % Percent Who Strongly Agree Past 2 Yrs Never 39
40 A Good Place to Live Base: Out-of-State Residents % Image Lift For Oklahoma Advertising 81 Visitation 28 Advertising Plus Visitation Percent 40
41 A Good Place to Start a Career Base: Out-of-State Residents % Image Lift For Oklahoma Advertising 130 Visitation -15 Advertising Plus Visitation Percent 41
42 A Good Place to Start a Business Base: Out-of-State Residents % Image Lift For Oklahoma Advertising 117 Visitation 5 Advertising Plus Visitation Percent 42
43 A Good Place to Attend College Base: Out-of-State Residents % Image Lift For Oklahoma Advertising 51 Visitation 1 Advertising Plus Visitation Percent 43
44 A Good Place to Purchase a Vacation Home Base: Out-of-State Residents % Image Lift For Oklahoma Advertising 173 Visitation 39 Advertising Plus Visitation Percent 44

45 A Good Place to Retire Base: Out-of-State Residents % Image Lift For Oklahoma Advertising 127 Visitation 48 Advertising Plus Visitation Percent 45
46 Appendix 3: Impact of Ads on Visiting and Trip Planning

47 Visited Travel Website travelok.com by Advertising Awareness in 2016 Base: Total Travelers Total 20 Ad Aware 34 Ad Unaware Percent 47
48 Number of Times Visited Travel Website travelok.com in 2016 by Ad Awareness Base: Visited travelok.com Once times times More than 8 times Percent Total Ad Aware Ad Unaware 48
49 After Seeing the Ads - Information Sources Used for Planning - Detail A hotel or resort Digital (ie: Facebook, Twitter) Travel guide books Hotel websites Personal experience from past visit(s) Advice from relatives or friends A travel agent Television advertising Television travel shows Travel articles in magazines Other online sources Online booking engines (eg. Expedia) Airline websites Percent 49
 Magazine advertising A local visitors bureau/chamber of commerce Newspaper")


50 After Seeing the Ads - Information Sources Used for Planning - Detail (Cont d) Magazine advertising A local visitors bureau/chamber of commerce Newspaper advertising A government tourism office Other destination websites An airline/commercial carrier An auto club A toll-free number A company that specializes in group tours Newspaper travel section Car rental websites Radio advertising Radio travel shows Advertorials Percent 50