Breaking Through H O S T S A S K AT C H E W A N C O N F E R E N C E
|
|
|
- Rolf Cunningham
- 5 years ago
- Views:
Transcription


1 Breaking Through H O S T S A S K AT C H E W A N C O N F E R E N C E
2 A new peak
3 Millions of Arrivals All-Time Arrivals High in M 20.8M Source: ITS, DC Forecast
4 Year Over Year Arrivals Growth MEXICO 50% INDIA 18% BRAZIL 22% SOUTH KOREA 17% AUSTRALIA 12% CHINA 12% GERMANY 6% FRANCE 5% USA 3% JAPAN 1% - 4% U.K. Source: DC, YTD 2017 Estimates
5 Year Over Year Arrivals Growth MEXICO 50% INDIA 18% BRAZIL 22% SOUTH KOREA 17% AUSTRALIA 12% CHINA 12% GERMANY 6% FRANCE 5% USA 3% JAPAN 1% - 4% U.K. Source: DC, YTD 2017 Estimates


6 US Arrivals Growth in 2017 Auto Air Other +0.1% +6% +8%

7 Our focus to break through


8 Innovation Effectiveness Measurement Creativity

9 Breakthrough Creative
10 Korea

11 Travel Agents
12 Social Media
13 Japan


14


15 Video 6: BEC
16 Connecting America

17 Goals 1.035M $629M Leisure Travellers Visitor Spend


18 Seattle San Francisco Minneapolis & Saint Paul Chicago New York Boston Denver Philadelphia & DC Area Los Angeles Dallas & Houston Atlanta


19 Our Target Audience Learners Hold University Degrees Earn $100-$150K Travel Internationally 3-4x / Year More Likely To Travel to Canada by Air
20 NORTH 3% BC 37% AB 21% SK / MB 14% ON 53% QC 36% ATLANTIC 20%


21 Building Destination Demand

22 Content engagement time 562,000 hours


23


24 Performance Highlights to Date $21M 81M 1M Partner Investment Audience Pool for Advertising Retargeting Leads
25 Momentum of Interest in Canada Other Destinations

26 Potential to Visit Next 2 Years % 36%

27 BIGGER THAN JUST US


28 Co-op Program Overview $9.6M Campaigns National / Cross Provincial initiatives Industry Investment

29 Angling

30 Angling

31 Hunting

32 Millennial Travel Program

33

34 Breakthrough Conditions BREAKTHROUGH CONDITIONS

35 Aligning all the sides
36 Challenges
37 50% of Visitation Occurs in just 4 Months


38

39 NORTHSTAR 22


40 Our Collective Objectives Co-Invest & Align Optimal Visitor Mix Spending Right Places Right Time
41 How We Make This Happen Know Our Target Audiences Reach & Engage More of Our Audience Make Our Content Easier to Find & Use Make it Easier to Plan & Book

42 Quantify Our Opporunity


43 Insights From Publishers Publisher Partnerships +Reach +Engagement +Data + Insights Example
44 How We Make This Happen Know Our Target Audiences Reach & Engage More of Our Audience Make Our Content Easier to Find & Use Make it Easier to Plan & Book


45 Re-use Content For Optimum Reach Original Usage Different Market Different Audience Different Channel + REACH + REACH + REACH
46 How We Make This Happen Know Our Target Audiences Reach & Engage More of Our Audience Make Our Content Easier to Find & Use Make it Easier to Plan & Book


47 Shared Enterprise Technology Example


48 Hashtag Orchestration #ExploreCanada #Explore Canada #ExploreCanada #ExploreCanada #ExploreCanada


49 How We Make This Happen Know Our Target Audiences Reach & Engage More of Our Audience Make Our Content Easier to Find & Use Make it Easier to Plan & Book


50 Bridging Inspiration & Action..... Sequential Storytelling Leads National PMO Local Operator Leads

51 Breaking Through in a crowded marketing landscape
52 Attention in Decline 12 SECONDS 8 SECONDS
53 More Distracted 2,617 touches
54 Content Overload 400 hours of YouTube videos uploaded every minute globally tweets per second

55 Marketing Lost in the Noise 80% of brand videos have less than 10,000 views.
56 The Rise of Curation Publishers Algorithms

57 Substitution Behaviour

58 GLOBALLY, 43% OF REGULAR VOICE TECH USERS SAY THEY LOVE THEIR VOICE ASSISTANT SO MUCH THEY WISH IT WAS A REAL PERSON


59 The Rise of Curation Publishers Algorithms Tastemakers

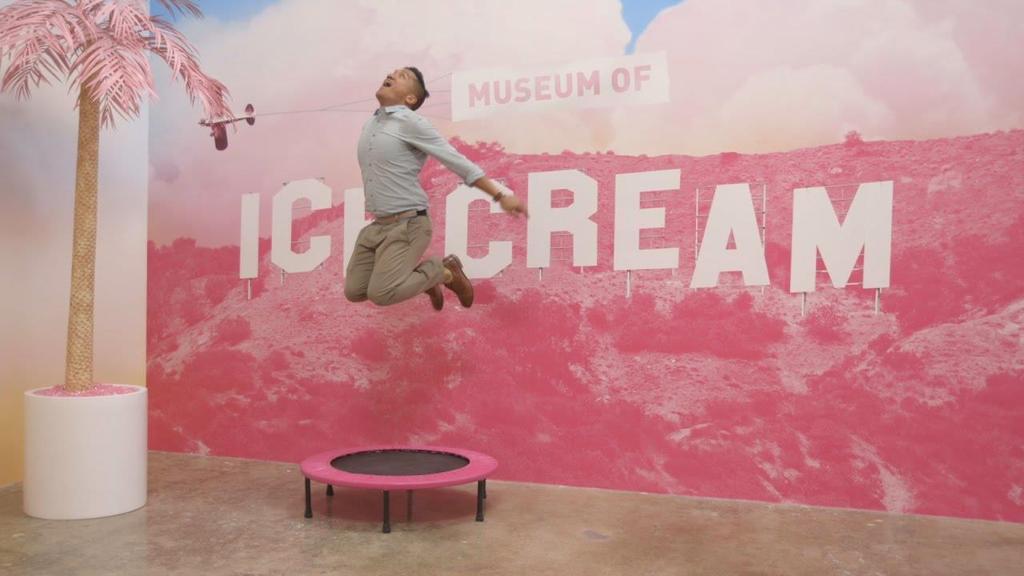

60 Definition of a Destination Disrupted ICE CREAM MUSEUM LA & NYC
61 Our next breakthroughs
62 Breakthrough Market China

63 The Opportunity


64 Canada s Potential Market: 11 Million Next 2 Years Adults 18+ Potential long-haul travellers Considering visiting Canada next 2 years 75M 20M 11M
65 We re Still to Be Discovered United States Australia France United Kingdom New Zealand 25% 24% 23% 20% 18% Destinations Visited in Past 3 Years Canada 4% / Significantly higher/lower than 2016.
66 Strong Future Visitation Potential United States Australia France Canada United Kingdom New Zealand 14% 12% 10% 9% 6% 6% Destinations Wanting to Visit Next in 2 Years / Significantly higher/lower than 2016.
67 NORTH 12% BC 49% AB 34% SK / MB 40 % ON 58% QC 38% ATLANTIC 32%
68 Our Marketing Strategy ATTRACT Soft adventures as the hook RELATE TO Vibrant cities as the connection DIFFERENTIATE Friendly and welcoming people STAND OUT CCYT as the foundation and bond
69 Double Digit Arrival Growth in 2018 This will make China almost our 2 nd largest source market behind the United Kingdom.
70 Jerry McGuire Breakthrough Capability: Data & Insights
71

72 Show me the Money


73 A Fundamental Shift Reported Behaviour

74 Layering for Accuracy Spending habits by region Fresher data Purchase categories International travel surveys International arrivals data Global Tourism Watch Primary research
75 Credit / Debit / epayment Data Country of origin Postal code Merchant category Spend amount Time From Where? On What? How Much? When?
76 Privacy is Paramount We won t handle sensitive or personal data
77 Are visitors from our key source markets spending money in unexpected places in Canada? New Answers What cities in Saskatchewan make the most from international visitors? Do anglers spend more per day in Saskatchewan versus Manitoba? New Insights Do Chinese visitors spend more on restaurants than British visitors?

78 Breakthrough Buzz

79