Outcome rice industry assessment
|
|
|
- Loraine Howard
- 5 years ago
- Views:
Transcription

1 Outcome rice industry assessment Towards a sustainable rice sector in Rwanda March 8, 2012 Hans Bogaard Agribusiness Rabo Development
2 Contents Section 1: Section 2: Section 3: Section 4: Section 5: Importance rice to Rwanda Value chain issue analysis Cooperative structure issues Outcome industry mapping Recommendations & Road Map
3 1.Importance rice to Rwanda
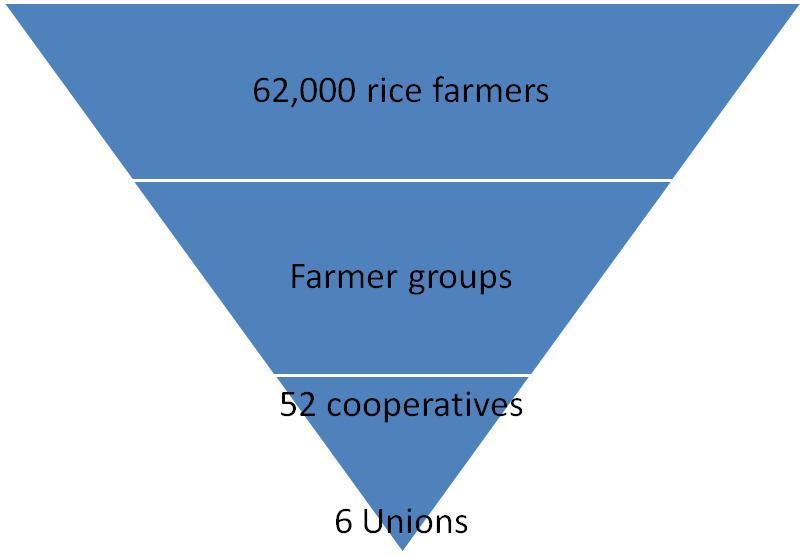
4 Importance of rice to Rwanda Rice is a staple crop in Rwanda but some 25% is imported (FX drain) Some 10,000 ha is cultivated by about 62,000 farmers operating under 52 cooperatives, with an average of <0.1 ha per household. The government considers rice as strategic sector because it performs well in the flood prone valleys of Rwanda Short crop cycles, 2 crops are possible per year (as opposed to e.g. cassava) Rice is easy to handle and store, and has by-products that can be used to feed animals, as a source of energy supply and as a substrate in mushroom production
5 2.Value chain issue analysis

6 Rice value chain
7 Key value chain issues Rwanda rice lacks economies of scale and therefore is too expensive (e.g. 40% more expansive than Vietnamese rice) Low quality seeds and lack of fertilisers creates poor quality paddy and low milling yields Lack of post-harvest handling and storage cause high losses and poor quality Weak cooperative management and organisation (incl. Fucorirwa and RCA) Strong position of cash traders undermining the coops, the mills and paying no taxes Poor quality image due to mixing of grades by wholesalers and retailers Lack of enforcement power of government bodies such as RBS
8 3.Cooperative structure
9 Cooperative structure
10 Key issues cooperatives Lack of economies of scale Lack of integration between mills and coops poor cooperative management links between cooperative leaders and micro mills slow payment by cooperatives/union lack of liquidity at cooperatives no enforcement of penalties to defaulting farmers and lack of positive incentives to deliver good quality paddy to cooperatives
11 Partnership structure ICM Australia Doug Shears Milled white rice 100% ownership Gigonko Rice Mill 60% ownership ICM Rwanda Branded rice Rwanda retail market Dividends 40% ownership Aggregated paddy supply UCORIBU Coop Union Paddy transport & storage Paddy rice supplied to UCORIBU Coop 1 Coop 2 Coop 3 Coop 4 Coop 5 Coop 6 Coop 7 Coop 8 Coop 9 Coop 10 18,000 members
12 4.Outcome industry mapping
13 Paddy production capacity Assumptions 2 harvests per year are normal but due to the fact the conditions during the two harvest are not the same a multiplier of 1,5 was used instead of 2. The information on total area under production was provided by RAB and RSSP, but it is known that a lot has to be done yet to optimize the irrigation systems. That s why it is maybe better to read as area available for rice production. After discussions during meetings with cooperatives it was concluded to calculate 35% for home consumption, seeds, and post-harvest losses. According to the information received from RSSP and RAB yields are varying from 4 ton/ha to 7 ton/ha and it was decided to use 5 ton/ha for calculations. incl. new New developments (ha) area under rice production developments total area ha Western province Southern province of which under irrigation harvests/year 1,5 1,5 Eastern province average yield paddy 5 5 Total Total paddy production paddy for seed, consumption and losses 35% paddy remaining for the market
14 Milling landscape western province southern province Eastern province MBIC Bugarama 15 shareholders Rwabuye Rice Electromax Ruhnda Kunda private company SODAR Bugarama Catholic church 40%, Caritas 10%, Mamba Rice Private company Cooperative CORIMI cooperative 1213 members Dukhore 43 shareholders Karubanda Rice Private company ICM Rwamagama ICM Bugarama 60% ICM Rwandese Government 40% Minoterie de Huye Gafunzo Rice Private company District Authorities opting for privatization (private investor+ cooperatives) 3 new Government mills ICM 60% and Rwandese Government 40% Government opts for privatization to create a partnership between private investors and cooperatives Gikongo Rice ICM 60% + Union Ucoribu 40%
15 Paddy milling capacity Assumptions All paddy available for the market (i.e mt, see former table) is processed in the officially registered mills (which of course is not the reality at present due to side selling to traders). As rice milling only becomes profitable when mills are able to process large volumes of paddy, occupancy rates were calculated based on 2 shifts per day (80 hours per week) and in total 50 weeks of production. industrial mills (incl new government mills) Total milling capacity/h number of mills expansion in existing (incl new future theoretical capacity/h all mills together 36,6 43,8 western province 8,3 4,7 total hours of production needed to process southern province 11,3 total production weeks based on one shift eastern province 17 2,5 total production weeks based on two shifts Total 36,6 43,8 Occupancy rate based on two shifts 50 wks/year 34% milling 41% capacity/year (2 shifts) Notes: Total milling capacity is 36.6mt/hour hence 146,400mt per annum (assuming 80 hours per week, 50 weeks). Including future extensions, milling capacity increases to 43.8mt/hour or mt/year. Capacity utilisation is low with 34% at the moment increasing to 41% after the extensions.
16 Conclusion: serious overcapacity West Current Future South Current Future Production Production Milling capacity Milling capacity Utilization 38% 33% Utilization 54% 66% East Current Future Rwanda Current Future Production Production Milling capacity Milling capacity Utilization 29% 44% Utilization 34% 41% Note: Production means available paddy production after 35% losses Notes Production means available production for milling after 35% losses The occupancy rates of the processing industry remain a serious point of concern, even after marshland extensions Looking at the real processed quantities of all processors (17,000 mt), most paddy production is channelled through informal circuits without any control In the East the capacity issues are most serious, among others due to the addition of three new mills constructed by the Government. The calculated capacity utilisation is 29% but the real utilisation is probably much lower.
17 5.Recommendations & Road Map
18 1. Cooperative capacity building Development of farmer organizations into cooperatives based on economic principles Capitalisation and financing, creditworthiness and bankability Governance and organisation structure Communication with members Value chain approach forward integration with market players
19 2. Consolidation of coops & Union Integrate weaker coops with stronger ones in the same district Economies of scale + logistic efficiencies Clear communication to members is necessary Keep local involvement intact via local advisory committees (instead of Boards) RCA to be involved in process
20 3. Investments in post-harvest handling & storage Decrease post-harvest losses of some 20% Improve quality of rice May require consolidation of coops (to get access to investment finance) Only for the strongest coops Partner support (eg USAID) may be available
21 4. Partnership with millers Promote integration coops and mills Only for the top of the cooperatives/unions (e.g. Twibumbe Union) Only with reputable industrial partners (e.g. ICM) Only if coop/unions brings sufficient own capital Dividends will increase loyalty of members to the coop and mill
22 5. Cooperation RAB and rice millers Improve cooperation on seed development Look at consumer preference as well, not only at yields More involvement of millers in agronomics is needed
23 6. Eradicate role of paddy traders Cash paddy traders are the main problem in the rice sector The traders invest nothing in the co-ops in the way of agronomy Unfair competition to mills in tenders They stimulate micro milling They undermine coops, millers and don t pay tax They do not care about quality of rice
24 7. Building capacity at RBS RBS may need extra support to monitor the millers Penalties should be enforced and micro mills should be closed down Also the wholesale and retail sector must be monitored on illegal mixing of grades CFC has indicated to be prepared to support RBS
25 8. Policy on mills Be restrictive on licensing new mills due to current overcapacity Any new mill should meet technical criteria defined by MINICOM/RBS Only if there is a clear business case, new mills should be allowed Give small mills time to adjust to the new requirements Add suggestions on technical standards explained in 4.4
26 9. Improve competitiveness Rwanda rice Key bottlenecks are the cost structure & quality of Rwandese rice Consolidation of cooperative sector leads to: Larger and stronger coops economies of scale lower cost per kg paddy Efficiencies in logistics lower cost per kg paddy Investments in post-harvest handling and storage lower losses lower cost per kg paddy + quality Eradicating cash traders leads to: Increased paddy supply to licensed mills higher utilisation lower cost per kg rice Increased volumes of properly milled rice higher average quality Partnership between cooperatives and mills leads to: Member dividend Supplier loyalty increased supply to mill higher utilisation lower cost Easier bank financing for coops investments in post harvest handling and storage better quality Traceability of rice in the chain higher quality