Rao Mylavarapu Soil & Water Science Department, IFAS University of Florida
|
|
|
- Octavia Lamb
- 5 years ago
- Views:
Transcription

1 Rao Mylavarapu Soil & Water Science Department, IFAS University of Florida
2 Optimum Yield or Quality Optimum should ideally refer to economically and environmentally sustainable returns Existing approaches have been predominantly based on economics Profit
3 4No Soil Testing 4Always Fertilize 4Luxury Consumption 4Pollution Potential Hi 4Treats soil as a bank 4Calibrated Soil Test 4Fertilizer amounts adjusted for soil contribution 4Based on plant need, not plant uptake 4Pollution Potential Low 4Fertilize the plant not the soil
4 Soil Categories & Extractants for Florida Acid soils - Mehlich-1 (dilute double acid) -P, K, Ca, Mg, Cu, Zn, Mn Calcareous soils (ph > 7.4) - AB-DTPA (Ammonium Bicarbonate-DTPA) -P P only Organic soils -Water extraction for phosphorus -Acetic Acid for K, Mg, Ca, Na, Si


5
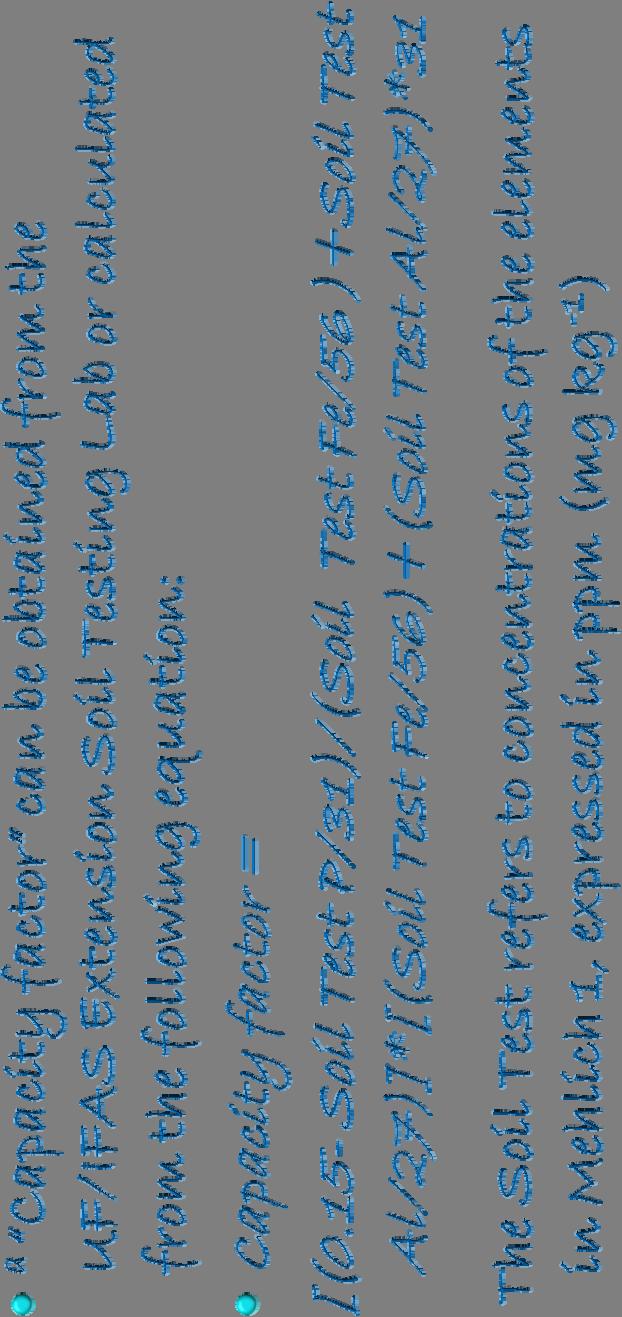
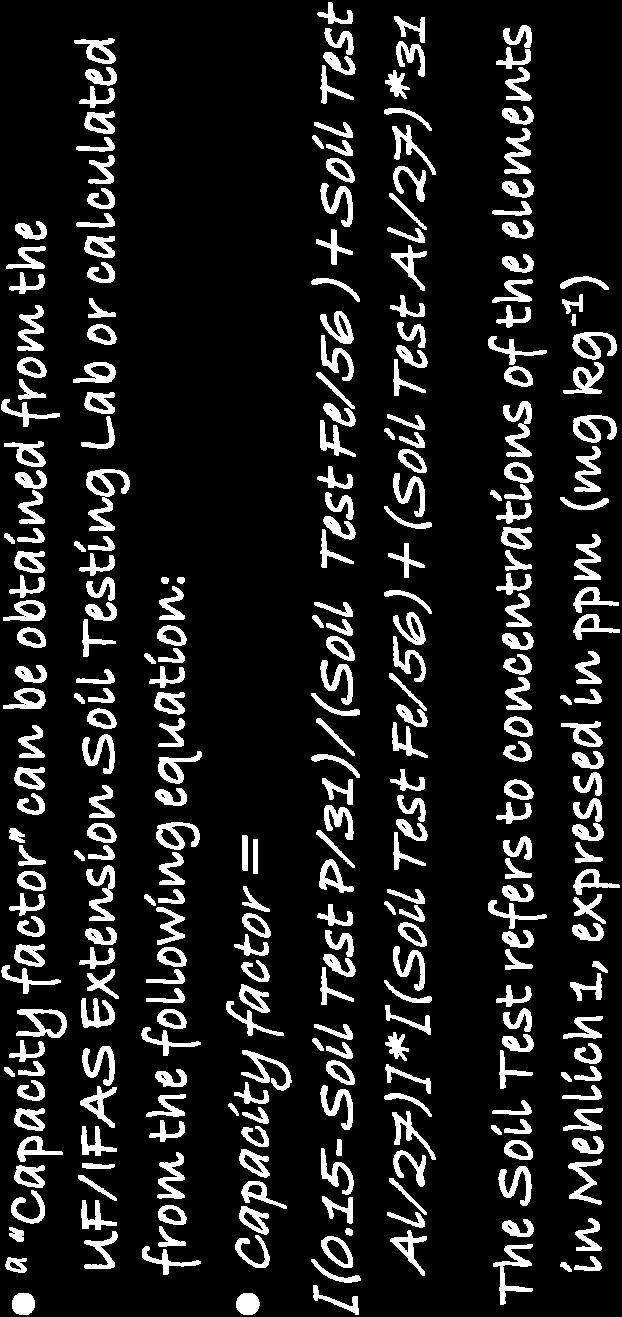
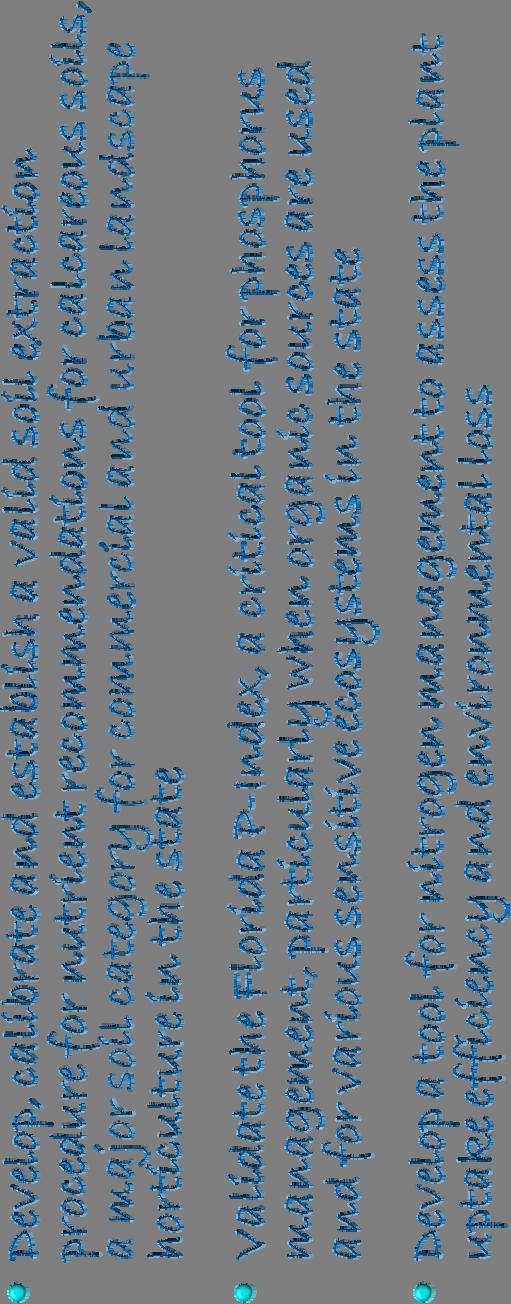
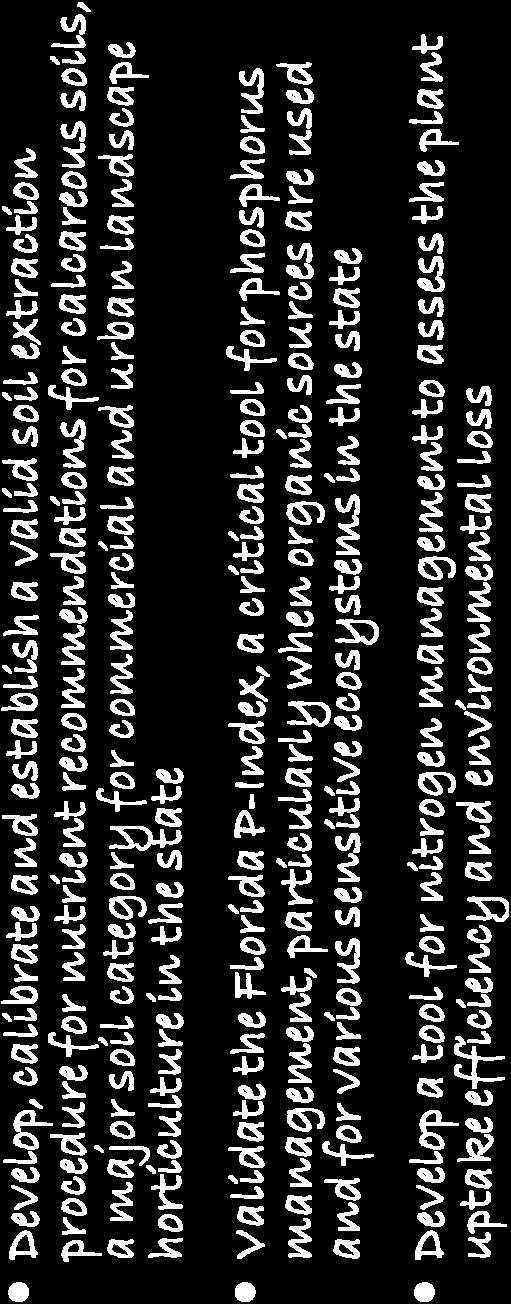
6 Field Calibration AB-DTPA extraction procedure for calcareous soils needs to be replaced urgently -poor field calibration with the procedure severely limits its applicability -extremely high carbonate levels make calibration difficult -background P concentration higher than the critical limit -both commercial and urban horticultural operations lack a valid soil test
7 Soil and plant diagnostics are complementary and serve different purposes Tissue test does not completely replace a soil test Plant analysis is effective in monitoring in-season nutrient needs, especially of perennial crops The tissue tests confirm suspected nutrient deficiency symptoms, reveal hidden hunger and verify toxicities Nutrient deficiencies corrected through foliar applications, although not always effective
8 Leaf diagnosis shows nutrient status at the time of sampling reflecting soil fertility status Soil fertility status in turn is also determined by temperature, water, management factors, nutrient balance, etc Leaf analysis has to be integrated with soil analysis for confirming the deficiency, sufficiency or toxicity
9 Complementary Soil & Tissue Testing Two such new tests have been developed and implemented - for Bahia pastures -for commercial Citrus In both tests, phosphorus requirement and deficiency confirmation is determined by a combination of both soil and a plant tissue test Potential for a new protocol for Blueberries

10


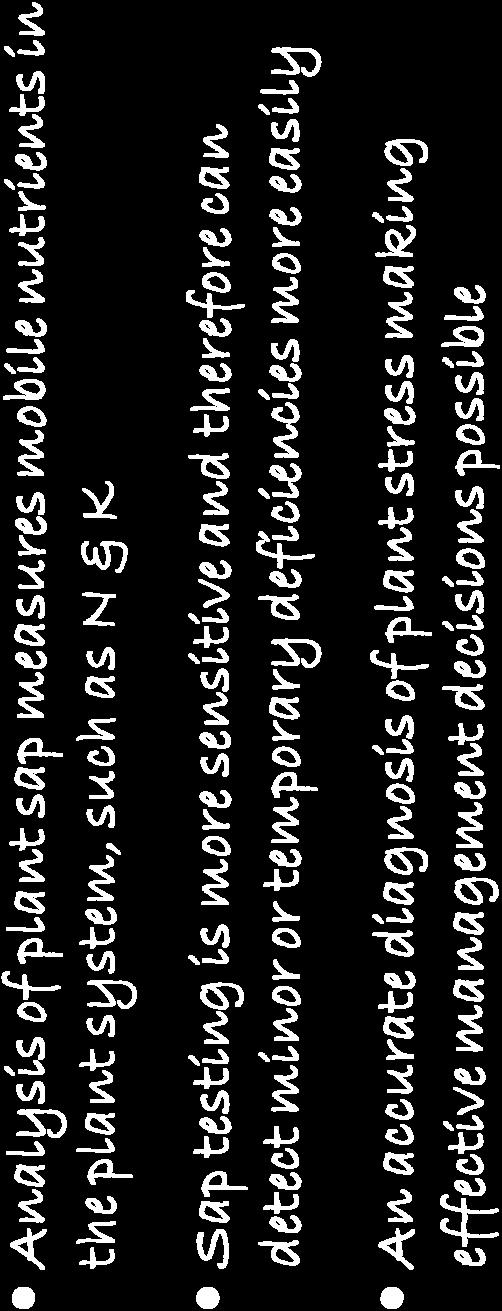
11 Plant Sap Analysis


12
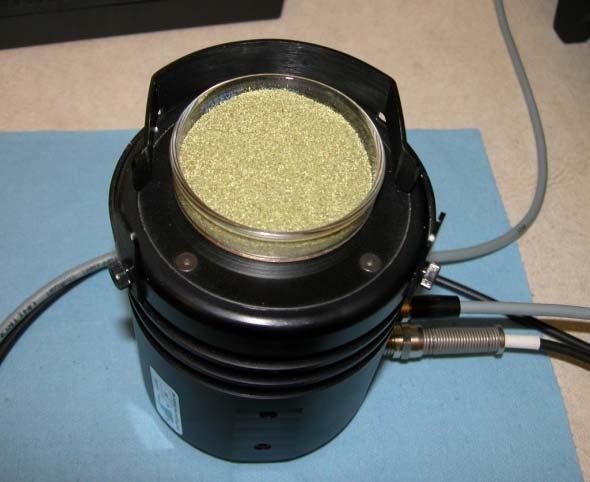
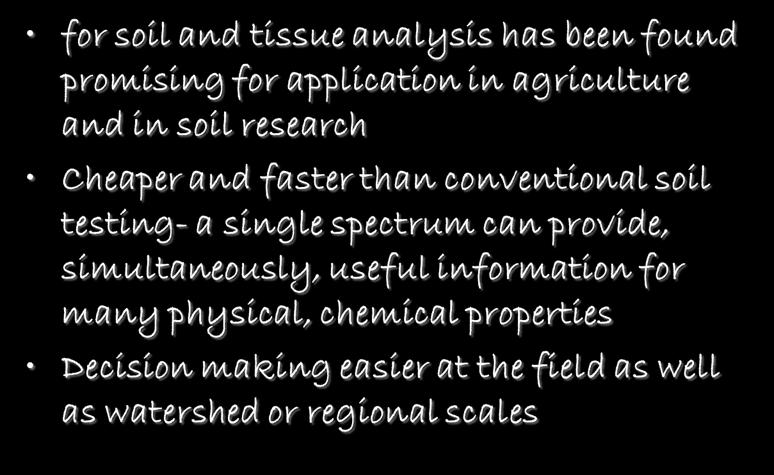
13 NIR Spectrophotometry Technique provides routine soil analysis decision support soil property classification soil survey and mapping precision agriculture diagnosis of soil problems contaminated site characterization input data for models


14

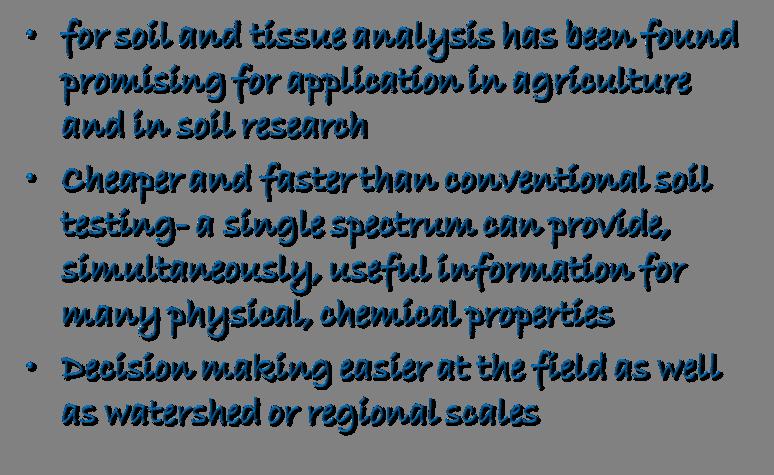
15 Why Replace Wet Chemistry?

16 Soil Test Laboratory Techniques
17 Reflectance Measurement Signal Processing Statistical Analysis Calibration Validation Interpretation & Recommendation

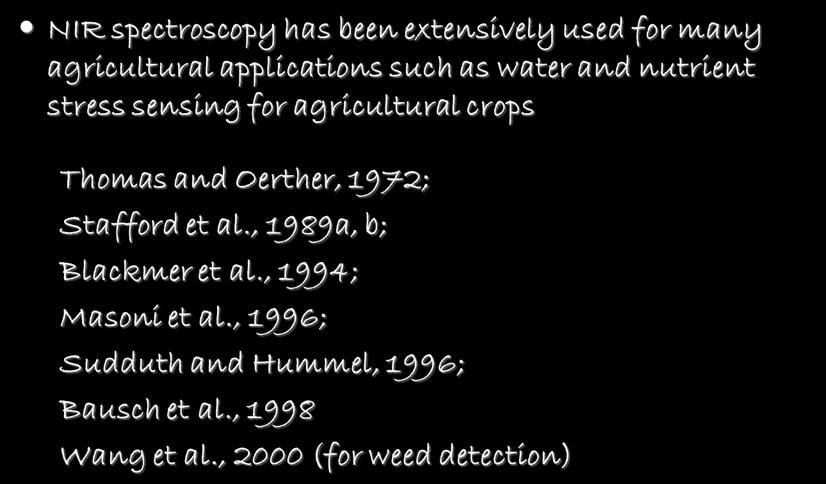
18 Previous Work


19
20 Alfisol Entisol Ultisol log(1/reflectance) Water Water Wavelength (nm)
21
22


23


24
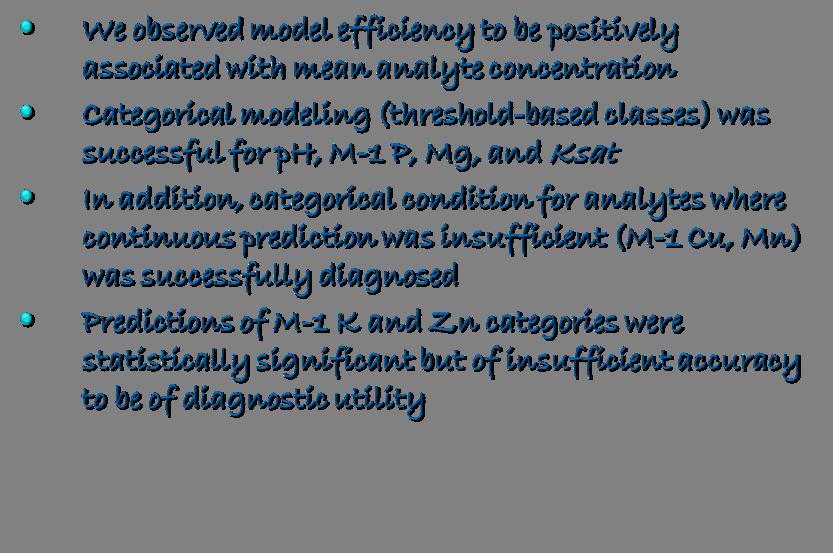
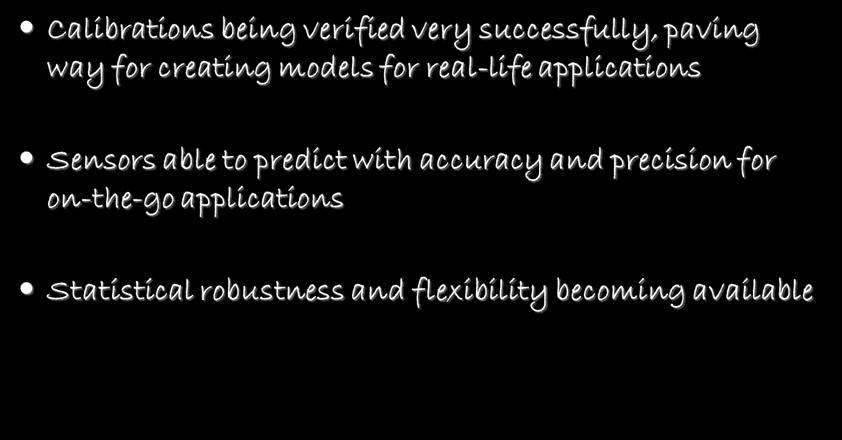
25 Predicted & Validated Soil Properties
26 Study 3 (on-going) A sample set consisting of 1,000 soil and corresponding 1,000 tissue samples is being collected from through out the state Commodities targeted- forages, vegetables, peanuts, citrus (Ridge, Flatwoods and Indian River) Soil and leaf tissue reflectances will be correlated A subset of soil samples was used to determine the influence of multiple moisture levels Soil texture will also be determined for a subset of soil samples Mylavarapu,, R.S., Schumann, A.W., Obreza, T.A., Cornejo,, C Rapid Soil & Tissue Analysis Techniques Using Near Infrared Reflectance Spectroscopy. FDACS Project 61580, Annual Progress Report.
27 Dry Results PLSR for P in DRY and MOIST soils samples respectively Moist refers to samples as they arrive from the field Dry samples are oven dry Moist

28


29


30
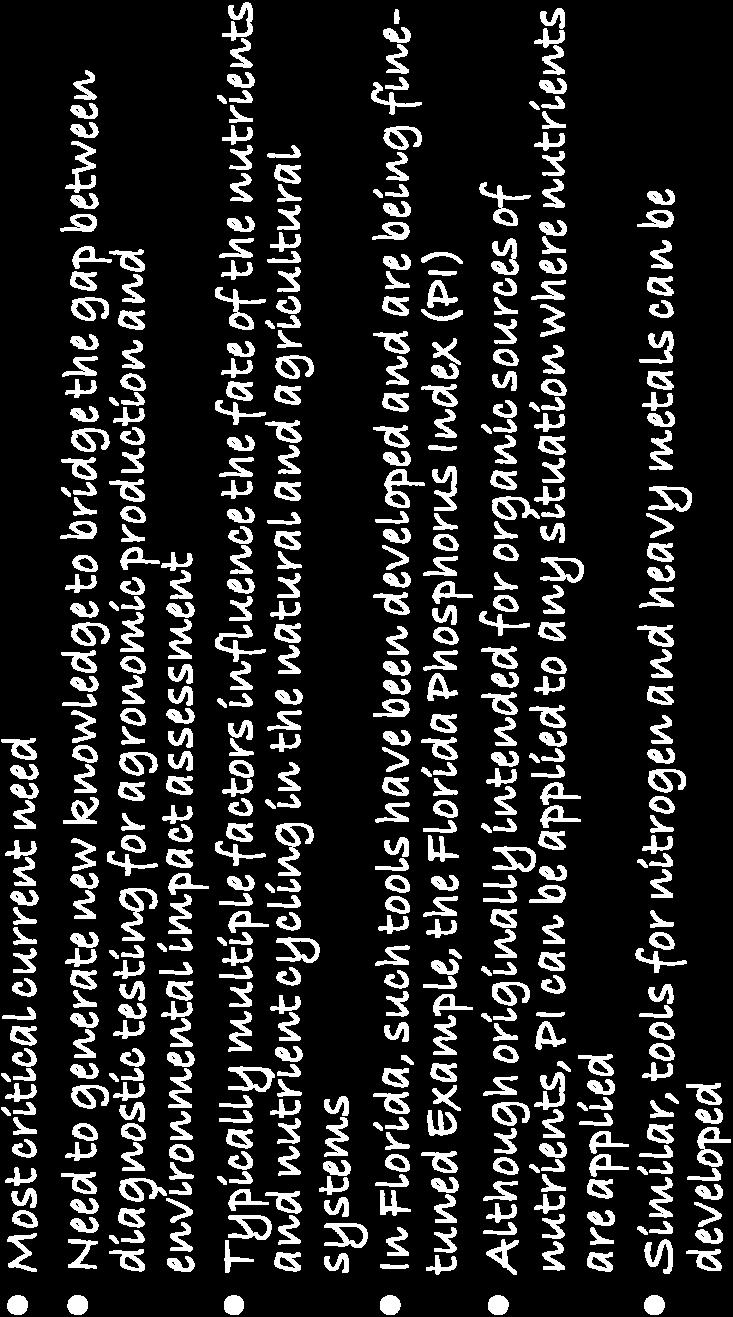
31 T H E F L O R I D A P I N D E X Part A: Transport Potential Due to Site and Transport Characteristics Site and Transport Characteristics Soil Erosion Runoff Potential Leaching Potential Potential To Reach Water Body No Surface Outlet 0 Very Low 0 Very Low 0 Very Low 0 <5T/A a 1 Low 1 Low 1 Low 1 Phosphorus Transport Rating 5-10 T/A 2 Medium 2 Medium 2 Medium T/A 4 High 4 High 4 Part B: Transport Potential Due to Phosphorus Source Management Phosphorus Source Management Fertility Index Value P Application Source and Rate d Application Method Waste Water Application Phosphorus Loss Rating Soil Fertility Index x ( ppm P x 2 x 0.025) c 0.05 x ( lbs P 2 O 5 ) for fertilizer, manure or compost x ( lbs P 2 O 5 ) for biosolids 0.10 x ( lbs P 2 O 5 ) for waste water No Surface Outlet Or Solids incorporated immediately or injected Applied via irrigation Or Solids incorporated within 1 day of application High 4 >15 T/A 8 Very High 8 Very High 8 Total for Part A: Site and Transport b Solids incorporated within 5 days of application e Solids not incorporated within 5 days of application x acre inches/year Total for Part B: Phosphorus Source Multiply Part A x Part B Value Value
32
33
34 Priorities Determine the feasibility of complementary soil and tissue analyses for phosphorus management for perennial crops and landscape plants and grasses Integrate recommendations for irrigation management with nutrient recommendations for commercial horticultural crops Further develop VNIR techniques and continue field calibration for wider diagnostic applications Develop newer diagnostic techniques for environmental impact assessment
35 Thank You!