EU-China Cooperation Workshop STI Days, Paris, March 19, 2015
|
|
|
- Marcia Shields
- 5 years ago
- Views:
Transcription

1 EU-China Cooperation Workshop STI Days, Paris, March 19, 2015 Dr. Anil Kumar Anal Associate Professor and Coordinator Food Agriculture and Bio Systems Cluster Asian Institute of Technology Thailand
2 Food security Food security is a situation when all people, at all times, have physical and economic access to sufficient, safe and nutritious food to meet their dietary needs and food preferences for an active and healthy life (World Food Summit, 1996)
 Physical")

3 DIMENSIONS OF FOOD SECURITY Food Security Access Availability Utilization Stability (FAO, 2006) Physical AVAILABILITY of food Economic and physical ACCESS to food Food UTILIZATION STABILITY of the other three dimensions over time
4 Food insecurity Anything that interrupts food supply and access or interferes with the utilization of food will lead to FOOD INSECURITY. Food Insecurity occurs when people lack secure access to sufficient amounts of safe and nutritious food for normal growth and development and an active and healthy life Factors contributing to Food Insecurity Unavailability of food Insufficient purchasing power Inappropriate distribution Inadequate use of food at household level


5 DURATION OF FOOD INSECURITY DURATION Inadequate food consumption may vary from a short-term experience to a life long condition. Analysts defined two general types of food insecurity: Chronic food insecurity Transitory food insecurity Chronic food insecurity is taken as long-term or persistent. Transitory food insecurity is short-term and temporary.
6 World food situation Food production Food shortages Food prices

7
8 TRENDS OF FOOD PRICES NEGATIVE CONSEQUENCES OF FOOD PRICE HIKE Poor suffers most!!! Poor households spend as much as 70% of their income for foods. Increase of chronic hunger Accordingly to World bank, food price hike since October 2010 pushed 44 million people into extreme poverty (15 February 2011) Increase in foreign debt of food importing countries-political instability

9 Regional trends in the number of undernourished from 1990 to 2010 Success in economic growth did not result in alleviating hunger Inequitable distribution of benefit of economic growth Widening disparity and inequality at both in least developed countries and middle income countries
10 10
11 11
12 Factors determining food security Water accessibility, water security Production technologies (biotechnology) Chemical fertilizers and pesticides or organic production Soil productivity (erosion, degradation) Landlessness, land-use changes (urbanization, industrialization, forest loss of mil ha within yrs.) World market, market liberalization (ASEAN-China FTA, Australia, Japan, New Zealand) Climate change/variation (Flood, drought, season variability) Biofuel production Farmer security

13 FOOD SECURITY FACTORS WATER SECURITY Water is increasingly scarce...


14 FOOD SECURITY FACTORS WATER SECURITY


15 FOOD SECURITY FACTORS LANDLESSNESS More people, Less land The United Nations forecasts that only 30% or so of the arable land in use in 1950 will be available per person in 2050 Source:

16 FOOD SECURITY FACTORS SOIL PRODUCTIVITY Advancing Land and soil degradation
")
17 FOOD SECURITY FACTORS CLIMATE CHANGE Climate Change Impacts on Grain Yields Source: Parry et al. (2005)

18 FOOD SECURITY FACTORS CLIMATE CHANGE Disaster occurrence Impact of world natural disasters by region: Source: ADRC Natural Disaster Data Book 2008

19 FOOD SECURITY FACTORS PRODUCTION TECHNOLOGIES


20 FOOD SECURITY FACTORS PRODUCTION TECHNOLOGIES Benefits: GM crops Insects/pest resistance Disease resistance Herbicide resistance Reduced use of fertilizer Biopharmaceuticals- produce vaccines Concerns and risks: Environmental risk (contaminate ecosystem) Reduction of Bio-diversity Serves only the interest of large scale farmers Basic food for poor is not genetically modified (wheat, potato)

21 FOOD SECURITY FACTORS BIOFUEL PRODUCTION World bio-ethanol and bio-diesel production is projected to be doubled in 20 years between 2009 and 2018; increasing competition of land and water use with food production, in addition to competition of use of food grains between bio-ethanol and food/feed

22 FOOD SECURITY FACTORS FARMER SECURITY Key to food security is farmer's security Farmers meet an essential need and deserve to earn a profit. To meet global demands for food, feed, fiber and fuel they have to increase production. For this they need access to the right inputs, knowledge and information, and finance. need to be able to bring the produce to market and earn a living needing links to customers, infrastructure from storage to road and rail transport, and the right trade policies.

23 TRENDS OF FOOD PRODUCTION
24 What must be addressed? Agricultural trade barriers Environmental degradation and climate change, and The under-performance of agriculture, energy efficiency, and the restoration of marginal lands in developing countries World population reaches 9.1 billion by To feed these population, world has to increase food production by 70% (100% for developing countries) by If not, world security and social stability would be seriously threatened.
25 Food Security in the THAI Context

26 Thailand Produces sufficient to meet its own needs A net exporter of food The world s largest exporter of rice, canned pineapple, pineapple juice and concentrates, and frozen shrimp One of the world s leader producers of sugar cane, cassava, longan, durain, mangosteen and longkong A major contributor to world food security The rice sector accounts for about 23% of the agricultural sector s contribution to GDP (2005)

27 Countries facing food emergencies Thailand Source: FAO (2006)


28 INTRODUCTION TO THAILAND S FOOD SECURITY While Thailand is a food surplus country at the macro level, food accessibility at the household level remains a problem, particularly remote rural areas. Food availability and accessibility have been impacted by the global economic crisis, climate change and the expansion in the production of food-fuel crops. For the poor, food constitutes a considerable portion of the expenditure. The high food price and inflation rate directly affect their livelihood status. In addition, the small-farmers are hard hit by soaring input prices and rising production cost.
29 Thailand s food security in the past decade Availability 1) Food production and use 2) Increasing role of imported food 3) Food crops and energy crops Access 1) Access to nutritious and balanced diets 2) Food access among vulnerable groups: The rural poor The urban poor 3) Role of markets and hyper markets 4) Government s policy to ensure food access Food Security Access Availability Utilization Stability
30 Thailand s food security in the past decade Utilization 1) Food hazards 2) Bird flu outbreaks 3) Food safety campaigns and linkages to agricultural policy 4) Organic agriculture movements Stability 1) Deterioration of natural resources 2) Changing characteristics of food producers 3) Social movements: Community right Food Security Sustainable agriculture 4) Anti-GMO campaigns Availability Access Utilization Stability

31 FOOD SECURITY AMONG VULNERABLE GROUPS Vulnerable population of Thailand 76 provinces are classified into 3 clusters based on food security and nutrition. The most vulnerable Population are characterized by high rate of low birth weight, underweight in children under 5 years old, and prevalence of iodine deficiency, in addition to other vulnerability factors such as low per capita income, high rate of inactive members and land ownership problems. Vulnerable These provinces have more favorable environments for food security and nutrition with higher per capita income. But there are some vulnerability factors. The least vulnerable Source: Ministry of Agriculture and Cooperatives (2005) The population have higher-than-national average income. There are also some negative factors in terms of food security.
32 FOOD SECURITY AMONG VULNERABLE GROUPS Agriculture can play a significant role in enhancing food security. About 87 percent of those affected by food poverty in 2007 are agricultural households relying on 37 percent of their total current income on cash farm income and 43 percent on income in-kind. Among agricultural households, the farm operator, who mainly rents land less than 1.6 ha and engaged in fishing/agricultural services/forestry in rural areas are the most vulnerable group affected by food poverty Numbers of households affected by food poverty in 2007


33 In 2007, the number of the poor was estimated at 5.4 million or 8.5% of the population. Rural poor: Indebtedness (due to high priced inputs) Landlessness Shift from household consumption crops to more highly-priced cash crops Urban poor: Low wages
34 RURAL POOR Farmers and farm workers are poor as they face many difficulties, many of which are structural, such as low bargaining power, low farm prices, high input cost, crop failure, lack of financial credits. Poverty among farmers is a stark contrast to the facts that Thailand is the top rice exporting country. This is because: Domestic paddy prices are determined by the global market. Farm gate prices are based on the prices taken by rice millers and exporters. Farmers are price takers at the end of the reversed supply chain. The more farmers invest in agricultural chemicals to boost the production, the more they expose themselves to financial risks.
35 RURAL POOR Real FOB price of milled rice 5% and real farm price of paddy The increase in export price resulted in the volatility of the domestic rice price, triggering a high inflation in the country. Small farmers, rural poor households, and wage earners who have very low income became vulnerable to the threat of food insecurity and food poverty.
36 RURAL POOR Annual income equal or less than 15,000 baht/person Total income 12,835 (100%) Farm income 5,144 (40%) Non-farm income 6,252 (49%) Consumption of farm products Poor farming households income sources and food security ratio 2006 (baht/person) 1,439 (11%) Annual income more than 15,000 baht/person/year 22,243 (100%) 7,486 (34%) 13,009 (58%) 1,748 (8%) Annual income more than 20,000 baht Food security rate (%)* Source: Graduate School of Kasertsart University (2006) 55,001 (100%) 19,916 (36%) 33,516 (61%) 1,569 (3%) * Food security is the household s food consumption acquired from its own farm, measured by utilization rate of farm consumption. The higher the utilization rate, the higher the food security of the household.
37 RURAL POOR Annual income equal or less than 15,000 baht/person Total income 12,835 (100%) Farm income 5,144 (40%) Non-farm income 6,252 (49%) Consumption of farm products Poor farming households income sources and food security ratio 2006 (baht/person) 1,439 (11%) Annual income more than 15,000 baht/person/year 22,243 (100%) 7,486 (34%) 13,009 (58%) 1,748 (8%) Annual income more than 20,000 baht Food security rate (%)* Source: Graduate School of Kasertsart University (2006) Better economic status does not always guarantee better food security situation. 55,001 (100%) 19,916 (36%) 33,516 (61%) This is because poor farm households had higher capacity to produce and acquire food from their own farms. 1,569 (3%) They were often offered particular types of food such as fruits, vegetables, seasoning, and meat by other members in the communities.
38 RURAL POOR Since 1970s, an alternative to chemical-based mono-cropping has been pursued by the sustainable agriculture movement. Today, such movement has grown in strength and several variations of sustainable agriculture including organic agriculture, integrated agriculture, forestry agriculture, have been advocated and experimented in several parts of the country. Level Numbers of farmers (%) Food security before and after shifting to sustainable agriculture Before shifting to sustainable agriculture Food sufficiency Food quality and variety After shifting to sustainable agriculture Food sufficiency Food quality and variety High Moderate Low Not indicated Total farmers Source: Office of National Economic and Social Development Board (2004)

39 RURAL POOR The New Theory proposed by H.M. The King is also based on the principle of self-reliance specially among the farm sector. According to the theory, food security can be achieved at household level through diversifying crops, building water storage, expanding farming activities to cover aquaculture and husbandry. In practical terms, land use is divided into 30:30:30:10 for the purposes of digging up small ponds, growing rice, cultivating field crops or orchards, and housing. The New Theory Land use 30:30:30:10 30% small ponds 30% cultivating field crops or orchards 10% housing 30% rice field

40 URBAN POOR A large part of the urban poor are people living in slum communities and informal workers. According to the Community Organizations Development Institute, in 2003 there were approximately 5,500 low-income urban communities with 8.25 million people living in poor conditions and often insecure housing. In Bangkok alone, it was estimated to have 1,200 slum communities in 2004.

41 URBAN POOR Distribution of households by food security status

42 URBAN POOR Two major factors accountable for food insecurity Lack of disposable income at the end of the month Lack of time for cooking Employment was not sufficient to ensure food security for the urban poor. According to a survey of low-wage urban communities by NSO in 2006, over half of urban poor households had low level of income of less than 1,501 baht per week or 6,004 baht per month. When the food prices or other costs of living rise, women in the family are likely to be affected the most as they would cut their meals or eat less to save food for their children and the other family members.

43 CHANGING CHARACTERISTICS OF FOOD PRODUCERS Small food producers constituted the majority of the food supply chain. Now, many of them, having experienced unstable farm income and rising cost of production, have left the agricultural sector. Shrinking and aging farming population is a cause of concern for food security. In 2008, the Ministry of Education and the Ministry of Agriculture and Cooperatives launched programs to develop a new generation of farmers through a five-year education and training program in vocational colleges Demographic structure of agricultural workforce Note: 1) *Males per 100 females.2) Employed in agriculture refers to people working at least one hour a week in agriculture.


44 GOVERNMENT S MEASURES TO ENSURE FOOD SECURITY Thailand s poverty reduction strategy was primarily based on income-generation and provision of social welfare, particularly education. Food welfare projects were usually under other social welfare or health programs. These programs were designed for specific groups such as school lunch and milk programs for young children and cash transfer program for elderly people. Domestic price control on certain products to ensure fair trade and consumer s access to basic and necessary commodities such as cooking gas, student s uniforms and medicines When consumer price index rose, the so-called Blue Flag Discount Project would be launched to offer food and consumer products at 20-40% lower than market prices on a temporary basis

45

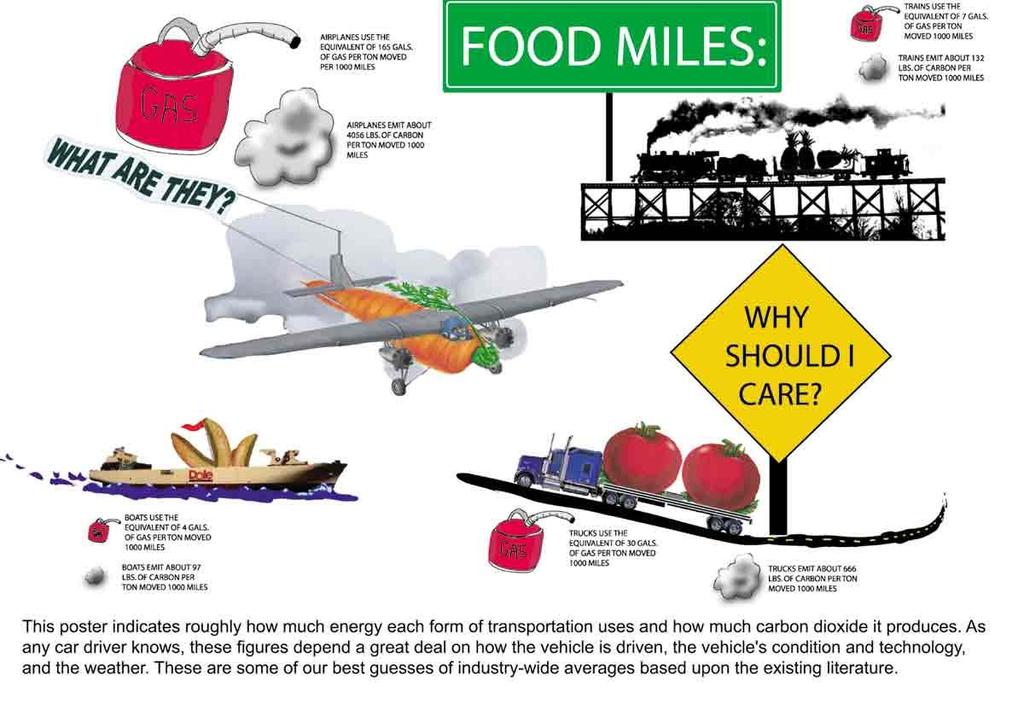
46 Local vs Global Food Supply Your food travels more than you do!! Is that a good idea??? Nonrenewable resource such as energy best conserved when locally grown food is utilized. No supports in place to preserve our best farmland overuse of land can render it useless little research being done to help farmers reduce their fertilizer use less than 1/10 of all research studies (4500) funded by USDA focus on organic system or methods

47 Economic forces vs. environmentally sound practices Global capitalism: Many out of season foods we consume are grown outside our borders by people who are at risk for malnutrition (although this may not be a detriment if they receive adequate compensation) Producing food from soil takes land, labor, and capital Capital moves freely all over the world to areas where land and labor are cheapest Agrifood corporations pay poor farmers low wages to grow foods for our table.

48 Economic forces vs. environmentally sound practices Effects of food processing: Food offered in supermarkets are modified so much that the link between what the farmers grow and what turns up in the shopping cart is destroyed (ex: cucumbers to pickles) Some food processing is beneficial, providing us with safer food and more of it than in previous generations Increase in amount of fruits/vegetables imported from 1970 to today
49


50 So Try to Eat Local! Creates sustainability of local food supply Keeps local farmers in business Food is fresher, tastier, and seasonal May provide more guarantee that food is not contaminated. Promotes variety Creates community May provide more nutritious food Preserves green space/farmland
 1983- mid")

51 Case of China s Hybrid Rice (HR) History of Hybrid Rice Technology Development in China Research on 3-line (A,B,R) hybrid rice initiated & developed 1976/77 Hybrid rice commercialization & systematic hybrid rice seed production initiated (in ,000 people converged on Hainan for HR seed pdn) mid nineties Scaling up of China s Hybrid rice acreage & yields 1990 HR acreage > 15 million ha 1995 Two-line hybrid rice system developed & commercialized 1996 onwards Super Rice Breeding national program initiated in phases 2006 Super hybrid rice Phase III objective (target 13.5 ton/ha) initiated Source: Li, Xin & Yuan, 2009
 Paddy Yields in China & India & Share of Hybrid rice in China s rice")
52 Impact of Hybrid Rice Varieties on Yields Source: FAOSTAT & Li, Xin & Yuan (2009) Paddy Yields in China & India & Share of Hybrid rice in China s rice area


53