Facts and fiction about livestock and climate change
|
|
|
- Berniece Brown
- 5 years ago
- Views:
Transcription


1 Facts and fiction about livestock and climate change Frank Mitloehner, Professor & Air Quality Specialist Department of Animal Science, University of California, Davis 1

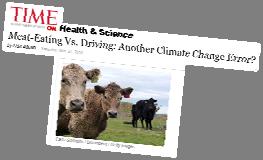
2 Facts or Fiction on Livestock and Climate Change? Livestock produces 18% of all anthropogenic GHG globally Livestock produces more GHG than transportation Livestock produces even more than 18%, namely 51% of all GHG globally (Worldwatch Institute) Grazing systems produce less GHG than conventional animal production in confinement systems 2


3 Livestock s Long Shadow (FAO, 2006) The Livestock sector is a major player, responsible for 18% of GHG emissions measured in CO 2 e. This is a higher share than transport Life Cycle Assessment (NRC, 2003) I must say honestly that he has a point - we factored in everything for meat emissions, and we didn't do the same thing with transport, we just used the figure from the IPCC. Dr. Pierre Gerber, LLS contributing author 3


4 4


5 GHG & GWP Global Warming Potential (GWP) of Main GHG Carbon Dioxide, CO 2 1 Methane, CH 4 25 Nitrous Oxide, N 2 O 298 CO2 Carbon Dioxide CH4 Methane N2O Nitrous Oxide Carbon Dioxide and Carbon Flux U.S. the big GHG picture Source: EPA (2009) 5


6 4.5 Billion + population of USA in 10 years Today and Tomorrow s Markets 6

7 Asian Urbanization is key driver for industrial feed and food demand Urban population: % % 8 our of 10 emerging market megacities are in Asia. 19 Source: UN Population Division Asian Hourly Wage Rates in US Dollars Consumption is growing rapidly in developing countries Index number:1961= Eggs Meat Milk Roots and tubers Meat Eggs Cereals Milk 21 Per caput consumption of major food items in developing countries kg per caput per year (index numbers 1961=100) 7

8 Consumption is growing rapidly in developing countries... Index number:1961= Eggs Meat Milk Roots and tubers Meat Eggs Cereals Milk 22 Per caput consumption of major food items in developing countries kg per caput per year (index numbers 1961=100)... driven by incomes... Per capita meat consumpion (kg/year) China Brazil Malaysia Ghana Lithuania Germany Japan USA Norway Per capita GDP (US$ PPP) 23 Per capita GDP and meat consumption by country, Global livestock distribution FAO (2006) 8

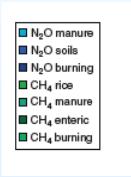
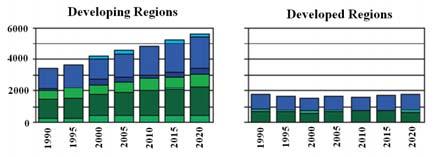
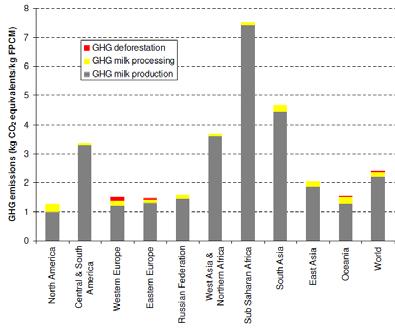
9 Distribution of cropland FAO (2006) GHG by Regions Mt CO2-eq Time (years) FAO (2010) 9
10 Emission Intensities (direct emissions from livestock) GTAP 2001 data base Mitigation: interventions to improve productivity Gill et al. (2010) Relationship between total greenhouse gas emissions and milk output per cow kg CO2-eq. per kg FPCM ,000 2,000 3,000 4,000 5,000 6,000 7,000 8,000 9,000 Output per cow, kg FPCM per year 10

, milk production nationally has increased 60")

11 US Dairy trends Today, there are 9 million dairy cows in the US, 16 million fewer than existed in Even though cow number have decreased dramatically (1950 versus 2013), milk production nationally has increased 60 percent. The carbon footprint of a glass of milk is 2/3 smaller today than it was 70 years ago. US Pork Trends US Pork Trends 11
12 US Beef trends In 1970, the US had 140 Million head of beef By comparison, today there are 90 Million head In both 1970 and 2010, 24 Million tons of beef were produced China Swine Example China s five year plan focuses on making farms larger and more efficient Half of the world s pigs live in China 50 million sows w/ 20 piglets born alive Equals annual production of 1 Billion pigs Pre-weaning mortality causes 400 Million pigs to never make it to the market One more pig per sow would mean 1 Million tons of feed saved Sustainable Intensification is key Production intensity and emission intensity are inversely related 12


13 Livestock Environmental Assessment and Performance Partnership LEAP brings together governments, the livestock industry, nongovernmental and civil society organizations, leading researchers and inter-governmental organizations The FAO, as secretariat and host, will ensure that the project follows science-based and internationally recognized approaches Presentation to National Academies IOM, Washington DC, July 17,