Phenotyping informatics: Again at the end of the pipeline. Harold Verstegen, Keygene N.V. Wageningen, The Netherlands
|
|
|
- Calvin Dustin Hall
- 5 years ago
- Views:
Transcription

1 Phenotyping informatics: Again at the end of the pipeline Harold Verstegen, Keygene N.V. Wageningen, The Netherlands EPSO: The European Plant Science Organisation EPSO Workshop on Plant Phenotyping November 02-03, 2009 Forschungszentrum Jülich, Germany Forschungszentrum Jülich, Germany ICG-3: Phytosphere Jülich Plant Phenotyping Centre (JPPC) Website:

2 Phenotyping informatics: Again at the end of the pipeline Harold Verstegen VP Bioinformatics EPSO Workshop on Plant Phenotyping, Nov 3, 2009


3 KeyGene 2009: active world-wide Rockville Wageningen Shanghai 20 years experience, 135 scientists


4 KeyGene s platforms ADDED VALUE IN IMPROVED 6F CROPS TRAIT PLATFORM TRAIT PLATFORM PARTNER TRAITS


5 R&D Strategy Licensing in Collaborations Fundamental Research Developing: Technologies & Traits Applying Molecular breeding of crops Breeding Seed Products Market Universities KeyGene Partners Breeding industry
6 Contents of the Talk The importance of phenotyping Subjective observations Keygene & phenotyping Digital image analysis and the LemnaTec system Examples of digital imaging of vegetable crops Bioinformatics views and structuring
7 The importance of phenotyping For plant breeders (and growers and consumers) the phenotype is the final goal.. New improved phenotypes can be created through genetic improvement (QTLs) Detection of QTLs requires: high quality molecular markers high quality phenotypes! But..Phenotyping is not (always) straightforward Genetic and environmental factors are intertwined Subjective / biased observations Phenotype may depend on complex interactions of plant and (a)biotic agent (resistance, tolerance)
8 Phenotyping potential 100% Robustne ess Potentia al Genotyping Phenotyping


9 Easy to make subjective observations Left centre circle smaller than right one? Two shades of red in this picture?

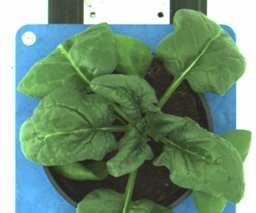
10 The importance of phenotyping Combining (externally provided) phenotype data with in-house generated genotype data is one on the main activities of KeyGene s applied research Big interest in new methods to obtain objective, robust, non destructive, automated and timely phenotype data First focus was on phenotypes derived from image analysis as a method, using fixed imaging equipment and moving the objects (e.g. plants) --» LemnaTec system
 Plant weight + precise water dosage Software: LemnaTec software environment Contains building blocks for image processing & conversion to")
11 Lemnatec features Hardware: greenhouse conveyor belts and photography chambers Plant randomization Take observations at will Observations from several angles + top view Optional filters/ sensors in non-visible spectrum (NIR/ water content & Fluorescence) Plant weight + precise water dosage Software: LemnaTec software environment Contains building blocks for image processing & conversion to numeric data, allows you to build custom analysis pipelines..
 Destructive verification experiments show that this digital trait has >80% correlation with green")
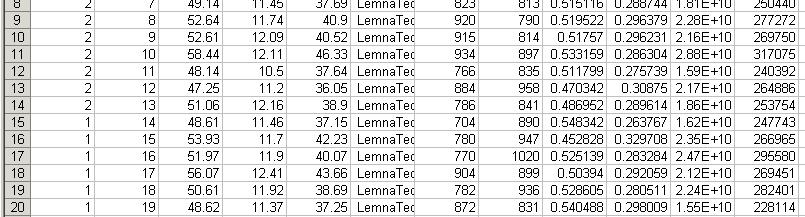
12 Derivation of a digital trait < Variables > green pixels front / side view Green pixels top view Digital _ biomass Pixels = Pixels + Pixels + Log( front side 3 top ) Destructive verification experiments show that this digital trait has >80% correlation with green mass
13 Validation using existing data Zamir.. M82 tomato introgression lines; trait = plant weight Comparison of two introgression lines and the reference parental line M82 IL 11-3 > M82 IL 12-2 < M82
14 Validation using lemnatec data Results correspond with earlier data additionally, accumulation of biomass over time can be assessed! IL 11-3 > M82 IL 12-2 < M82


15 Example in spinach: leaf mass development.. Time
16 Spinach biomass stability area i n pi xes Accumulated green pixels Period for harvesting Two stable genotypes, (one slower and one faster) day
17 Surprising result.. The greenhouse heating shut down during one night.. i n pi xes day
18 Optimizing heritability Repeated (digital) observations allow us to calculate the trait heritability for the same trait at different moments in time.. Heritability The best moment to gather data may differ between traits A more powerful genetic analysis can be achieved by phenotyping at the right moment observation (time) trait1 trait2 trait3
19 Example: Quantifying disease resistance In Arabidopsis.. Classification as Resistant/Susceptible, observed via digital imaging was repetitively accurate in >80% of the cases

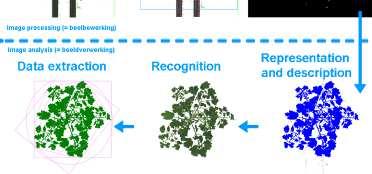
20 Example of image processing & analysis steps

21 Oops Again we found ourselves struggling with data From experimental setup to detection From raw data to biological interpretation, analysis and disclosure Low complexity High complexity
22 (Bio)Informatics Bioinformatics Research Biology Tools and methods Pre-analysis Production Annotation Curation Analysis Integration Combining Mining Post-analysis Reporting Collaborating Sharing Infrastructure IT
23 (Bio)Informatics Bioinformatics Research Tools and methods Pre-analysis Analysis Post-analysis Production Annotation Curation Integration Combining Mining Reporting Collaborating Sharing Infrastructure Statistical methods Association Software Genotypes Associations & Validation 120 Phenotypes trait-01 hybrids tester avg Rvirus Sugars Rinsect Fruit mass I Fruit shape performance as % of = controls avg X1 X2 Y1 Y2 C1 C2 hybrids High Density Molecular Maps Breeding Germplasm = Inbred Lines Phenotyping protocols


24 Bioinformatics Research areas Bioinformatics Research Tools and methods Pre-analysis Analysis Post-analysis Production Annotation Curation Integration Combining Mining Reporting Collaborating Sharing Lead Discoveries Infrastructure Applied System Biology Sequence Applications Quantitative Bioinformatics Platform and Tools Phenotyping Applications


25 Phenotyping Applications Bioinformatics Research Tools and methods Pre-analysis Production Annotation Curation Analysis Integration Combining Mining Post-analysis Reporting Collaborating Sharing KeyTrack KeyBox Infrastructure Trait selector Button bar, clear buttons Browse for crops Browse for folder Results Results Start analysis


26 Informatics dimensions Sequencing/run Bioinformatics Research Tools and methods Pre-analysis Analysis Post-analysis Integration Reporting Production Combining Collaborating Annotation Mining Sharing Curation Infrastructure Technology Machine Sequence (bases) Read length Storage/ run Sanger sequencing ABI 24 Kilo 900 bp 10 MB 2.3 Sanger sequencing MegaBACE 48 Kilo 600 bp 40 MB 1.2 Pyrosequencing GS20 30 Mega 100 bp 11 GB 2.6 Pyrosequencing GS-FlX 100 Mega 200 bp 33 GB 2.9 Pyrosequencing GS FLX Titanium 500 Mega >400 bp SBS GA classic 1 Giga 25 bp 0.5 TB 1.9 SBS GAII >2 Giga 25-37bp 1.5 TB 1.3 SBS GAII-upgrade 5 Giga 75bp 3TB 1.6 bp/kb
27 Infrastructure Keygene Dedicated - HW accelerators - GPU(?) - Pre-analysis Bioinformatics Research Tools and methods HPC: Cluster Infrastructure 1 master 16 nodes, 8cores 512 GB memory LIMS or better: PHIMS DMS PMS Production Annotation Curation Analysis Integration Combining Mining Post-analysis Reporting Collaborating Sharing Storage 200TB - SAN (40TB) - NAS (160TB) Servers - Personal analysis - Pipeline analysis - High mem analysis Online Backup - remote (80TB) - Glasfiber 4Gb/s Databases: - PostGreSQL - MySQL - Oracle/SQLServer
28 Acknowledgements KeyTrack / KeyBox team José Guerra (statistics) Kamyar Malakpoor (mathematics / programming) Bas de Regt (programming / operations) Gert-Jan Speckmann (operations) Jeroen Kornelis Stol (ICT-Service) Shital Dixit (post-doc) Harold Verstegen Marco van Schriek (Crop Leader) Arjen van Tunen..and others Lemnatec Gmbh


29 The future for phenotyping in 6F s

30 It s a Green Gene Revolution THANK YOU