Determining Your Budget and Cost of Production
|
|
|
- Lee Parks
- 5 years ago
- Views:
Transcription
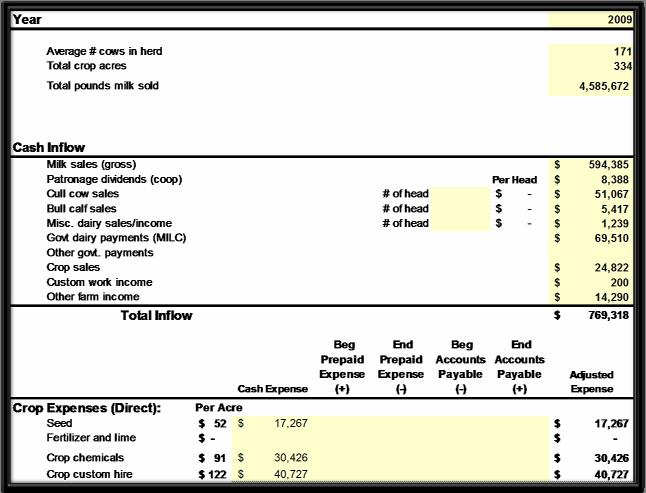
1 We are the Dairy Alliance, a Penn State Cooperative Extension initiative. Determining Your Budget and Cost of Production Tim Beck Extension Educator Dairy Business Management Dairy Annual Cash Flow Per Cow Farm Total Per CWT. Milk Price Total Cows 175 Cows Milking 143 Milk/Cow/Day 91 Projected Milk Sales 27, ,333 4,749,745 CASH INFLOWS Beginning cash balance 2,500 Milk sales (gross) 4, , Patronage dividends (coop) , Cull cow sales , Bull calf sales , Misc. dairy sales/income , Govt dairy payments (MILC) Other govt. payments , Crop sales , Custom work income , Other farm income TOTAL INFLOW 854, CASH OUTFLOWS Milking Cow Feed and Crop Expenses Seed , Fertilizer , Chemical , Crop Custom Hire , Purchased Milking Cow Feed , Total Milking Cow Feed and Crop Expenses 1, , GROSS MARGIN PER CWT Milk 539, Purchased Dry Cow & Heifer Feed , Direct Expenses: Breeding & Registration , Veterinary & Medicine , bst , Supplies , DHIA 25 4, Contract Heifer Raising Dairy Custom Hire Milk Hauling , Milk Marketing 58 10, Bedding 14 2, Total Direct Expenses ,
2 Related Operating Expenses (Overhead): Fuel and oil , Repairs , Hired labor, withholding, ins , Land rent , Machinery leases Building leases , Real estate taxes Farm insurance , Utilities , Risk mgt.& advertizing Dues and professional fees , Miscellaneous , Total Related Operating Expenses 1, , Family Living/Owner Draw , Income Taxes Minimum ending balance 1, TOTAL OUTFLOW 4, ,226 Operating Surplus ,607 Capital Sales Capital Purchases New Borrowing Loan Payments (Principal + Interest) , Cash Surplus or Deficit , Change in Cash Balance (Ending Beginning) 14,107 Total Outflow per CWT Gross Margin Needed per Year 528,620 Gross Margin Needed per Month 44,052 Gross Margin per CWT to Guarantee /CWT. Income Over Feed Cost (IOFC) Breakeven /cow/day Total Outflow (Excluding Cap Sales & Pur, New Borrowing) 838,226 Minus NonMilk Income 71,000 Total Outflow Covered by Milk Sales 767,226 CWT Milk Sold 47,497 CWT. GROSS MILK PRICEFARM BREAKEVEN /CWT. Basis to Use 2.00 /CWT. Class III Breakeven Price /CWT. 16,524 Beginning Annual Operating Balance 20,000 Annual operating borrowing Annual operating interest payment % Annual operating principal payment 16,524 Endng Annual Operating Balance 3,476 20,083 3 Information Required Historical costs and returns Rations for all cattle groups Planned crop acreage Current milk production DHIA Herd Summary Herd Code and RAC Optional: Previous Year s milk pricing information Balance Sheet data


3 Annual: Two Approaches: Monthly: Monthly Cash Flow Sections Monthly Cash Flow Sections Cash Inflows Cash Outflows: Milking Cow Feed and Crop Expenses Dairy Expenses per Cow Related Operating Expenses Total Outflow Operating Surplus Capital Sales Capital Purchases New Borrowing Loan Payments Annual Operating Transactions and Balances Gross Margin for LGM Class III Breakeven Price

4 Historical Financial Data
5 Ration Information Dairy Herd Ration Summary per Head per DayDairy Profit Forum Feed Price List DAS Web Site, Virginia Ishler Scroll Right to Enter Bat Feed Price List as of Month #: Leave this section blank if 10 Direct Cash October 2010 Market Costs Milking Cows OnlyAsFed/Head/Day Dry Cows HeifersAsFed/Head Bred /Ton /Ton Farm 1 Farm 2 Total Farm 1 Farm 2 Yearlings 26 mos. 02 mo. Heif ers Number of Animals As Fed As Fed Forages (HomeRaised) Enter Daily AsFed/Head/Day for each ingredient. Enter Daily AsFed/Head/Day for e Corn sil avg analysis Leg sil, first cut, bud, 21.0 CP, 44.9 NDF,.62 NEL SM grn sil avg anal Grass hay, first cut, early head 14.5 CP, 65.0 NDF,.63 N Forage Substitutes (HomeRaised) Cereal straw Concentrates (HomeRaised) Corn, shelled, HM Soybeans COOKED Purchased Complete Feeds Supplement CP Supplement CP Purchased Forages, Forage Substitutes or Concentrates Mineral , Palm Oil 1, , Dry Cow Mineral 2, Heifer with Rumensin Calf Starter Grain , Milk Replacer 1, Mineral Lbs AsFed per Head Total for Group , , , , Feed Factors Corn Soybean Meal Lbs per Cow Tons Fed per Day Daily Tons per Cow Tons Corn Equiv. Tons Soy Equiv. Corn sil avg analysis ( ) Leg sil, first cut, bud, 21.0 C SM grn sil avg anal Grass hay, first cut, early h Cereal straw Corn, shelled, HM ( ) Soybeans COOKED Supplement CP Supplement CP Mineral Palm Oil Dry Cow Mineral Heifer with Rumensin Calf Starter Grain Milk Replacer Mineral Total Corn and Soy Equivalents
6 Daily Amount Cropping Plan and Feed Balance Annual Amount Annual Tons Yield per Acres Acre Planned (tons) Cost to Purchase (/Ton) Amount Produced Balance Tons to Purchase Tons Per Purchase Cost Total Cows Forages (HomeRaised) Corn sil avg analysis 9,542 3,482,830 1, , , Leg sil, first cut, bud, 21.0 CP, 44.9 NDF,.62 NEL 5,434 1,983, , SM grn sil avg anal. 3,140 1,146, (273) 2.76 Grass hay, first cut, early head 14.5 CP, 65.0 NDF,.63 NEL , (23) 23 3, Forage Substitutes (HomeRaised) Cereal straw 98 35, Concentrates (HomeRaised) Corn, shelled, HM 2, , (271) , Soybeans COOKED , , , Purchased Complete Feeds Subtotal Shortage of HomeRaised Grains and Forages 60,690 Supplement CP , , Supplement CP 36.0 Purchased Forages, Forage Substitutes or Concentrates Mineral , , Palm Oil , , Dry Cow Mineral 12 4, , Heifer with Rumensin 27 9, , Calf Starter Grain , , Milk Replacer 20 7, , Mineral , , Subtotal Purchased Feeds 155,661 Total Purchased Feed 216,351 Purchased Feed Cost by Animal Group Tons Per Milking Cows Dry Cows Heifers Horses Total Total Cows Corn sil avg analysis 3, , Leg sil, first cut, bud, 21.0 C 4.77 SM grn sil avg anal Grass hay, first cut, early h 1,042 2,178 3, Cereal straw Corn, shelled, HM 50,325 50, Soybeans COOKED 2,145 2, Supplement CP ,790 64, Supplement CP 36.0 Mineral 1 16,874 16, Palm Oil 23,925 23, Dry Cow Mineral 4,756 4, Heifer with Rumensin 481 4,078 4, Calf Starter Grain 18,198 18, Milk Replacer 6,693 6, Mineral 2 15,867 15, ,223 7,169 31, , , Per Total C 1, , Per Milking C IOFC = Milking Cows
7 Determine Direct Crop Costs per Ton Yield Yield per Acres per Tons Acre Tons Planned Acre Produced (tons) Seed Seed Fertilizer Crop Summary Total Crop Crop Total Total Direct Total Chemical Direct Custom Hire Hire Cash Cash Costs Costs/Ton Forages (HomeRaised) Corn sil sil avg analysis ,840 3, ,440 10,400 22, Leg sil, sil, first cut, bud, 21.0 CP, 44.9 NDF, NEL ,440 3, ,440 10,400 21, SM grn grn sil sil avg anal , ,650 6,500 13, Grass hay, first cut, early head 14.5 CP, 65.0 NDF, NEL ,300 2, Forage Substitutes (HomeRaised) Cereal straw , ,790 3,900 8, Concentrates (HomeRaised) Corn, shelled, HM ,860 2,600 5, Soybeans COOKED , ,185 5,850 12, Total 315 3,852 14,314 2,205 29,295 40,950 86, Double Crop Acres per per ton ton Total Acres 235 Determine Direct Costs per Ton Total for Crop Input Costs per Acre Crop Custom Crop Custom Seed Fertilizer Chemical Seed Fertilizer Chemical Hire Hire OR Historical Breakeven Cash Flow Determining Breakeven Cash Flow (Income Over Feed Cost Goal and Maximum Daily Feed Cost per Cow) From Monthly Cash Inflows Beginning Cash Balance 2,500 Cash Flow 2,500 EE Cull Cows and Calves 36,800 36,800 A Other Income 34,200 34,200 B + NonMilk Cash Inflow 68,500 68,500 C = C = A + B EE Total Cash Outflow (Direct and Overhead Costs) 689, ,226 D Owner Withdrawals (Family Living) 42,000 42,000 E + Loan Payments (Principal + Interest) 108, ,000 F + Total Outflow Required 839, ,226 G = G = D + E + F Purchased Cow Feed 149, ,106 H Crop Expenses (Seed, Fert, Chem, Custom Hire) 93,000 93,000 I + NonMilk Inflow 68,500 68,500 C + C from above Pur Feed + Crop + NonMilk Inflow 310, ,606 J = J = H + I + C Income Over Feed Cost Total Required 528, ,620 K K = G J Cows Milking (average number) L Days in Calculation M Income Over Feed Cost Breakeven per Day N = N = K L M Expected Milk Price (/CWT) O Bulk Tank Average P X Daily Milk Income per Cow Q 100 = Q = (O X P) 100 Income Over Feed Cost Breakeven N N From Above Feed Cost per Cow per Day Maximum R S = Q N Current Feed Cost per Cow per Day (Cost) Difference in Maximum and Current Feed Cost/Cow/Day
8 Livestock Gross Margin (LGM) Livestock Gross Margin Insurance Calculations: Milk Margin Breakeven per Day Required with LGM Prem S S = (N P) * 100 Number of Months in Cash Flow Plan Data T Number of LGM Contract Months to Evaluate U Gross Margin needed for time period evaluated 528, ,620 V K From Above Gross Margin needed per month 44,052 44,052 W W = (V T) Gross Margin Needed for period evaluated 440, ,517 X X = (W * U) Gross Margin Offered by LGM Insurance 473, ,450 Y LGM Insurance Premium 29,516 29,516 Z LGM Insurance Premium per CWT Sold Gross Margin Needed including LGM Premium 470, ,033 X + Z Pounds Milk Sold in Period Evaluated 3,955,952 3,955,952 AA AA = (L * M * P) Pounds Milk Insured during Months evaluated 3,955,952 3,955,952 BB BB = (AA T) CWT Milk Insured during Months evaluated 39,560 39,560 CC CC = (BB 100) 75% of Production (Lower Limit) 29,670 29,670 DD DD = (CC *.75) With LGM Without LGM Difference per CWT Chang Price Lower than Cash Flow Plan Gross Margin Guaranteed/CWT Minus Price Change 3.00 Minus LGM Premium Gross Margin/CWT. Received Gross Margin Received 443, ,771 89,163 Gross Margin Price Higher than Cash Flow Plan Protection Gross Margin Guaranteed/CWT Plus Price Change Minus LGM Premium 0.75 Gross Margin/CWT. Received Gross Margin Received 562, ,129 29,516 Premium Cost 118, , ,679 Milking Cows: Market Cost Feed Cost/Cow/Day Milk Lbs Shipped 4,749,745 4,749,745 Number of Days in Shipment Daily Milk Sold 13,013 13,013 Lbs Milk/Cow/Day Gross Milk Price per CWT Milk Income per Cow/Day Income Over Feed Cost Current Income Over Feed Cost (per cow per day): Income Over Feed Cost Breakeven IOFC Current Compared to Breakeven (1.20) 1.43 Milk Margin (per hundredweight of milk for LGM): Milk Price Daily Feed Cost per Hundredweight Milk Margin Income Over Feed Cost Summary (1.00) (1.00) Income Over Feed Cost Current compared to Breakeven (Market) Income Over Feed Cost Annual Breakeven Income Over Feed Cost Market Income Over Feed Cost Current compared to Breakeven (Direct Crop Costs Only) Income Over Feed Cost Annual Breakeven Income Over Feed Cost Cost
9 Herd Inventory Planner HERD EXPANSION CALCULATOR Farmer : Cash Flow Example HERD DATA: Future** Now No. of Head Cows at beginning of year Cattle Sold for Breeding: Value Now Future** Heifers 012 mo. at beginning of year 99 Dairy cow Heifers >12 mo. at beginning of year 85 Dairy calf Involuntary cull rate (%, including dead & dow ners) Dairy heifer Calving interval 12.8 Dairy bull Age at first calving 24.0 Cull and Veal Sales: % of cows present 1/1 that will deliver a live calf by 12/ Cull & dead cow avg 550 **NOTE: "Future" % of replacement heifers that will deliver a live calf 95.0 Cull yearling is the years after % calf mortality (exclude abortions, stillbirths, etc.) 6.0 Cull calf desired herd size % of calves born that are heifers 55.0 Replacement Cost: has been reached. % of excess heifer calves sold for dairy Check when purch. cattle enter milking herd: (JanDec ) (JanApr ) (MayAug ) (SepDec RESULTS by Yrs. (Enter current yr.): * Cows in place at beginning of year Cattle purchases no. cows no. latebred heifers Raised heifers no. calved Breeder sales no. cows no. heifers Cows culled total number * No. of cows at end of year Excess cows/fresh heifrs (sold for 2x cull value * Avg herd size (milking & dry cows fed / yr.) Dairy Production and Pricing Data Cows Milking Consult DHIA Herd Summary Report (202 Sheet) or PCDART Report 102 "Cows to be Milking, Dry, Calving and Culled by Month" Previous Month Jan Feb Mar Apr May Jun Jul Aug Sep Oct Nov Dec Total Cows Milking Total Cows 143 Cows to Calve Heifers to Calve Cows to Dry Cows to Purchase 0 Cull Rate Cows to Cull % total % per month Cows Dry 32 Cows dry % total Cows milking % total Cows total


10 PC DART Report 102 Cows to be Milking, Calving and Culled by Month Dairy Production and Pricing Data Milk Production Jan Feb Mar Apr May Jun Jul Aug Sep Oct Nov Dec Total Cows Cows Milking % in Milk 82% 82% 82% 82% 82% 82% 82% 82% 82% 82% 82% 82% 82% Days in Month Pounds/Cow/Day Lbs Milk Projected 403, , , , , , , , , , , ,403 4,749,745 YeartoDate Pounds Sold 403, ,767 1,171,170 1,561,560 1,964,963 2,355,353 2,758,756 3,162,159 3,552,549 3,955,952 4,346,342 4,749,745 33,215 27,141 Milk Price Jan Feb Mar Apr May Jun Jul Aug Sep Oct Nov Dec Class III Futures Basis Month Jan Feb Mar Apr May Jun Jul Aug Sep Oct Nov Dec at: New Holland Basis BasisYour Farm Basis to Use Projected Milk Price Price to Use Milk Sales 66,360 59,938 66,360 64,219 66,360 64,219 66,360 66,360 64,219 66,360 64,219 66, ,333


11 Report Date Contract Date Year Month Open Interest Settle Price Change (/cwt) (/cwt) Cash Mean Top 3rd Bottom 3rd 11/05/ Oct /05/ Nov /05/ Dec /05/ Jan /05/ Feb /05/ Mar /05/ Apr /05/ May /05/ Jun Class III Milk Futures 11/05/ Jul /05/ Aug /05/ Sep /05/ Oct NC /05/ Nov /05/ Dec Historical Basis Data
12 Historical Basis Summary Year Avg. Class 1 Milk ** Avg. Class III Milk Avg. New Holland Avg. Mt Holly Avg. Your Farm #DIV/0! ** 3.5% Butterfat Class I Price Difference from Class III Price Historical Basis Summary Monthly BasisNew Holland Year Average (3.12) Monthly Average Monthly Cash Flow Cash Flow Example 1/1/2011 Plan Starting Date CASH INFLOWS Jan Feb Mar Apr Total Cows Milking Cows 3 Yr Avg. Previous Yr Data to Use Beginning cash balance 2,500 1,000 1,000 1,000 Milk sales (gross), 91 lb/day avg, 175 Total Cows 66,360 59,938 66,360 64,219 Patronage dividends (coop) 9,763 8,388 7,500 3,750 3,750 Cull cow sales 650 3,250 3,250 3,250 3,250 Bull calf sales Misc. dairy sales/income 3,493 1,239 15,000 5,000 5,000 5,000 Govt dairy payments (MILC) Other govt. payments 5,795 5,000 Crop sales 22,532 24,822 5,200 Custom work income 8, ,500 Other farm income 14,767 14,290 Total NonMilk Inflow 8,500 8,500 12,250 7,250 TOTAL INFLOW 77,360 69,438 79,610 72,469
13 Monthly Cash Flow CASH OUTFLOWS Planned Pur Cow Feed/Cow/Year Jan Feb Mar Milking Cow Feed and Crop Expenses: To Use: Seed 14,477 14,314 14,500 ## 1,208 1,208 1,208 Fertilizer 2,103 2,205 3,500 ## Chemical 30,271 29,295 31,000 ## 2,583 2,583 2,583 Crop Custom Hire 42,401 40,950 44,000 ## 3,667 3,667 3,667 Purchased Milking Cow Feed 12,426 12,426 12,426 Total Milking Cow Pur Feed and Crop 20,176 20,176 20,176 Gross Margin (with milk price used in plan) 46,184 39,762 46,184 Gross Margin per CWT (with milk price used in plan) Monthly Cash Flow Dairy Expenses per Cow (Total Cows) To Use: Pur Dry Cow & Heifer Feed 2,743 2,743 2,743 3 Yr Avg. Previous Yr Data to Use Breeding & Registration ,896 1,896 1,896 Veterinary & Medicine ,552 2,552 2,552 bst ,663 1,663 1,663 Supplies ,917 2,917 2,917 DHIA Contract Heifer Raising Dairy Custom Hire Milk Hauling ,208 3,208 3,208 Milk Marketing Bedding
14 Monthly Cash Flow Related Operating Expenses: 3 Yr Avg. Previous Yr Data to Use Jan Feb Mar Fuel and oil 22,145 10,671 12,000 # 1,000 1,000 1,000 Repairs 59,232 50,295 51,000 # 4,250 4,250 4,250 Hired labor, withholding, ins. 65,949 78,513 75,000 # 6,250 6,250 6,250 Land rent 32,000 32,000 32,000 # 2,667 2,667 2,667 Machinery leases # Building leases 18,000 18,000 18,000 # 1,500 1,500 1,500 Real estate taxes # Farm insurance 11,302 13,146 13,000 # 1,083 1,083 1,083 Utilities 35,544 32,332 36,000 # 3,000 3,000 3,000 Risk mgt.& advertizing # Dues and professional fees 2,724 2,400 2,400 # 2,400 Miscellaneous 7,120 9,765 10,000 # Family living/owner draw 42,000 # 3,500 3,500 3,500 Income taxes Minimum ending balance 1,000 1,000 1,000 1,000 Monthly Cash Flow CAPITAL SALES Jan Feb Mar Total Capital Sales CAPITAL PURCHASES Jan Feb Mar Total Capital Purchases NEW BORROWING Jan Feb Mar Total New Borrowing LOAN PAYMENTS (Principal + Interest) Jan Feb Mar Loan Payments 108,000 9, # 9,000 9,000 9,000 # #
15 Monthly Cash Flow ANNUAL OPERATING LOAN TRANSACTIONS & BALANCE Jan Feb Mar Line of credit opening balance Credit card debt Accounts payable 6,624 8,887 Beginning annual operating balance 20,000 20,000 13,376 17,046 Annual operating borrowing 3,670 Annual operating interest payment 5.00 % Annual operating principal payment 6,624 8,887 20,083 17,101 17,117 Ending Annual Operating Balance 13,376 17,046 8,159 Ending cash balance 1,000 1,000 1,000 Gross Margin Needed to Guarantee per Month 43,477 43,377 37,227 Gross Margin per CWT to Guarantee per CWT per Month LGM Premium Gross Margin per CWT to Guarantee with Premium Total Outflow (Excluding Cap Sales & Purchases, New Borrowing) 69, , , Minus NonMilk Income 8, , , Total Outflow Covered by Milk Sales 61, , , CWT. Milk Projected 4,034 3,644 4,034 Gross Milk PriceFarm Breakeven Basis to Use (from Dairy Data Sheet) Class III Breakeven Price LGM Dairy Number of Tank Corn Soybean Coverage Month Days in Cows Average Total Lbs Total CWT Equiv Equiv % Total CWT Month Name Month Milking Per Cow Produced Produced (tons) (tons) covered Insured 1 January ,403 4, ,034 2 February ,364 3, ,644 3 March ,403 4, ,034 4 April ,390 3, ,904 5 May ,403 4, ,034 6 June ,390 3, ,904 7 July ,403 4, ,034 8 August ,403 4, ,034 9 September ,390 3, , October ,403 4, ,034 3,955,952 39,560 Total CWT 39, Number of Months 3,956 Average CWT Sold/Month
16 LGMDairy: Upcoming Changes Premiums Premiums will be subsidized Deductible (/cwt) Subsidy (%) Deductible (/cwt) Subsidy (%) Note: There is no subsidy for a 1 month contract 31 LGMDairy: Upcoming Changes Starting Starting December contract offering premiums will be due after last covered month After AGM is announced for the last month Premium will be deducted from any indemnity Maximum Subsidy will to 2.00/cwt Allowable feed ranges have been changed Corn: bu/cwt of milk SBM: lb/cwt of milk Default feed coefficients the same 32
17 UW LGMDairy Integrated Software System UW UW Understanding Dairy Markets Database System LGM Dairy Insurance System Rules UW Feed Converter UW Feed Converter LGMDairy Analyzer LGMDairy Analyzer IOFC Estimator IOFC Estimator Premium Estimator LeastCost Contract Actual Contract Performance Bundled Options 33 Summary Breakeven Cost per CWT. varies widely Producers need to know: What is my breakeven cost per CWT.? Can I use risk management based on my gross margin? How can I change it to reach positive cash flow?
18 How Can You Help? Recruit farms interested in monitoring IOFC: Either calculate for your farms and submit the data Or have producers submit raw data and receive calculated results Organize workshops to teach producers how to calculate breakeven cash flow (GM) and submit data to: Customized Training Module 1 Monitoring IOFC Module 2 Creating a Cash Flow, Part 1 Module 3 Creating a Cash Flow, Part 2 Module 4 Using Risk Management Strategies