Economic Vulnerabilities to Climate Change in New Jersey
|
|
|
- Thomasine McKenzie
- 5 years ago
- Views:
Transcription
1 Economic Vulnerabilities to Climate Change in New Jersey Robin Leichenko Director, Rutgers Initiative on Climate and Society Associate Professor, Department of Geography Preparing New Jersey for Climate Change: A Workshop for Decision Makers Rutgers University November 29, 2011
2 Current Research on Economics of Climate Change Vulnerability Impacts, Adaptation Economic Impact Assessments Assessments of Value at Risk Investigation of Economic Vulnerability and Resilience -
3 Current Research on Economics of Climate Change: Impact Studies 1. What are the direct costs associated with damage to physical infrastructure, capital assets, property? 2. What are the indirect costs that result from damage or loss of assets (e.g., costs of business interruption; lost wages due to decline in tourism following an extreme storm event)? -
4 Current Research on Economics of Climate Change: Risk Studies 1. What is the monetary value of assets at risk to sea level rise and other threats, including property, infrastructure, capital assets? 2. What are the economic costs and benefits associated with different types of adaptation measures such as protection, accommodation, or planned retreat?
5 Current Research on Economics of Climate Change Vulnerability and Resilience Studies 1. Which types of cities, industries, firms, workers are more or less vulnerable to economic harm from of climate change? 2. Why are some regional economies able to recover from climatic shocks and stresses more quickly than others? 3. How can economic vulnerability to climate change be reduced and economic resilience enhanced?
6 Current Research on Economics of Climate Change Impacts and Adaptation Major Sector-based Assessments and Reviews: World Bank 2006; Stern 2007; UNFCCC 2007; Cline 2007; Parry et al 2009; Agrawala and Fankhauser 2009; NYSERDA 2011 (New York State) Better Sectoral Coverage: coastal, agriculture, energy, health, insurance, tourism Spotty Sectoral Coverage: transportation, water resources, ecosystems and species habitat

7 Project Overview: Economic Impacts of Climate Change - Conceptual Framework 7
8 Methodology for NJ Economic Assessment Develop economic profile of the sector size; trends; other stressors (secondary data, interviews) Identify key climate change sensitivities of the sector, e.g., sea level rise, floods, heat waves (info from climate team; interviews) Identify major economic components at risk from climate change (in conjunction with other stressors) (interviews) Estimate direct climate change impact costs for major components (primary and secondary data) (many challenges, pitfalls, and uncertainties)
9 Air temperature Central range Precipitation Central range Sea level rise 3 Central range Rapid ice-melt scenario Climate Change in New Jersey Baseline Climate and Mean Annual Changes Baseline Northwest: 49 F Urban Northeast: 55 F South: 54 F Coast: 55 F Northwest: 47.2 in Urban Northeast: 46.3 in South: 44.9 in Coast: 38.4 in 2020s 2050s 2080s to 3.0 F to 5.0 F to 7.5 F + 0 to 5 % + 0 to 10 % + 5 to 10 % NA + 2 to 5 in + 7 to 12 in + 12 to 23 in NA ~ 5 to 10 in ~ 19 to 29 in ~ 41 to 55 in Source: Columbia University Center for Climate Systems Research (author) and Rutgers University Office of the New Jersey State Climatologist (modification) 9
10 Coastal Floods & Storms Looking Ahead Coastal Floods and Storms Baseline 2020s 2050s 2080s Flood heights (in ft) 1-in-10 yr flood 6.3 (every 10 years 6.5 to 6.8 (every 8 to 10 years) 7.0 to 7.3 (every 3 to 6 years) 7.4 to 8.2 (every 1 to 3 years Flood heights (in ft) with 1-in-100 yr flood 8.6 (every 100 years) 8.8 to 9.0 (every 65 to 80 years) 9.2 to 9.6 (every 35 to 55 years) 9.6 to 10.5 (every 15 to 35 years) Flood heights (in ft) with 1-in-500 yr flood 10.7 (every 500 years) 10.9 to 11.2 (every 380 to 450 years) 11.4 to 11.7 (every 250 to 330 years) 11.8 to 12.6 (every 120 to 250 years) Source: Columbia University Center for Climate Systems Research (author) and Rutgers University Office of the New Jersey State Climatologist (modification) 10
11 Looking Ahead: Changes in Extreme Events Extreme Event Heat index Probable Direction Throughout 21 st Century Increase Likelihood Very likely Ice storms/ Freezing rain Increase About at likely as not Snowfall frequency & amount Downpours (precipitation rate/hour) Lightning Intense hurricanes Decrease Increase Unknown Increase Likely Likely More Likely than not Nor easters Extreme winds Unknown Increase More Likely than not Source: Columbia University Center for Climate Systems Research (author) and Rutgers University Office of the New Jersey State Climatologist (modification) 11


12 Effects of Climate Change? Floods, Droughts and Spruce Run Reservoir, March 2002 Unexpected Events? Highland Park, October 2011 Delaware River, Sept Passaic River, March 2010
13 Precipitation Mean Temp Storm Surge Sea Level Rise Drought Heat Wave Extreme Winds Ice Storms Other Climate Sensitivities Sector Ecosystem Health X X X X X X X Species Habitat X X X X X X Water X X X X X Fisheries X X X Agriculture X X X X X X Tourism X X X X X Energy X X X X X X X X X Transporta tion X X X X Insurance X X X X X Public Health X X X X X
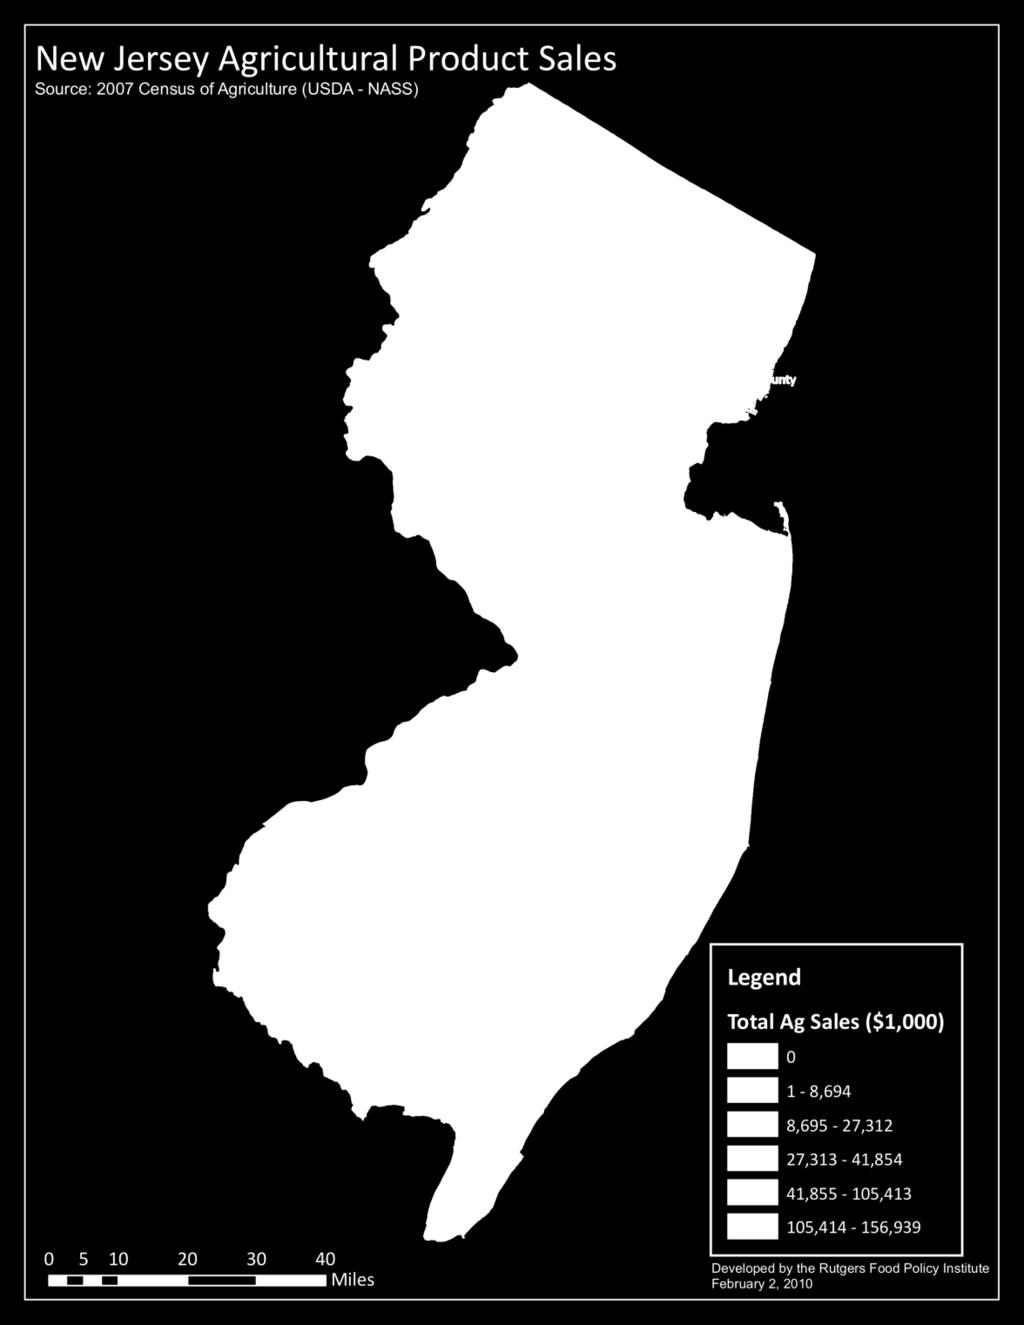
14 Sector Analysis: Definition - Agriculture Agriculture directly contributes $986 million to the state s economy (USDA 2009) Agri-tourism contributes an additional estimated $57.5 million (Schilling et al. 2007) Occupies 733,000 acres, approximately 16 percent of state s total land area; 160,000 acres of preserved land Revenue per acre is $1300 (3 rd in the nation in $/acre) 14
15 Sector Analysis: Definition - Agriculture Production dominated by specialty crops: greenhouse and nursery ($442 mill) vegetables ($181 mill) fruits ($143 mill) Average farm size is small (71 acres); 70 % of NJ s 10,300 farms have sales below $10,000 11% have sales above $100,000 Key commodities: horses ($85 million), blueberries ($82 million), chicken eggs ($41 million), corn ($39 million), cranberries ($25 million) (USDA 2009)

16

17
18 Sector Analysis: Climate Sensitivities Agriculture Increased frequency of high rainfall, high wind and hail events: crop damage and delays in field access Warmer winters: expand the range of weeds, insects, pests Warmer summer temperatures and longer growing seasons: expand market opportunities for some crops, but conditions are also favorable for pests and disease vectors Increased frequency of summer heat stress and drought: affect yield and quality of some crops Higher levels of atmospheric carbon dioxide (CO2): increases growth and yield under optimum conditions (Weed species benefit more from CO2 than do cash crops)
19 Sector Analysis: Key Economic Risks and Vulnerabilities Agriculture Berries. Soils in parts of southern New Jersey are uniquely suited for production of berries. Changing climatic conditions pose a potential threat to berry production. Vegetables. Vegetable producers may need to identify new varieties or crops that are better adapted to warmer climates. New opportunities for additional production? Perennial fruit crops. Warmer winters may necessitate changes in varieties grown. Over the long term, apple production may decline as farmers shift to other perennial crops, such as peaches, that are better suited to shorter winters and higher summer temperatures.
20 Sector Analysis: Key Economic Risks and Vulnerabilities Agriculture Equine, livestock and dairy industries. Heat stress and insect disease vectors can have a negative effect on health and productivity Nursery, greenhouse, sod and floriculture industries. These industries already make extensive use of controlled environments. The use of such environments may expand to cope with insects, disease, and heat stress, and drought. 20
21 Sector Analysis: Potential Impact Costs - Agriculture Value at Risk: Loss of berry production and reduced productivity of the southern coastal plain: the total value at risk in this region is $471 million/year. Berry production alone accounts for more than $110 million/year Costs of extreme events: in 2009, 15 NJ counties were designated as natural disaster areas due to crop damage from heavy rainfall; the state s wheat crop was down 27 percent due to excessive rainfall (from 2.01 million bushes in 2008 to 1.49 bushels in 2009) 21
22 Sector Analysis: Potential Adaptation Costs - Agriculture Insect and weed control costs: applications may need to double, triple or quadruple (e.g., Florida s climate requires 15 to 32 applications of insecticide against a key sweet corn pest, while New York s requires 0 to 5 applications) Expansion of irrigation and/or drainage systems: fixed costs for installation of overhead, moveable pipe irrigation is more than $2000/acre; such systems would only be economical for high value fruit, vegetable and floriculture crops. Limited water supply and ecosystem concerns Expansion of controlled environments: likely but controversial from an environmental standpoint and public acceptance is uncertain Monitoring and extension costs: will need to monitor for pests and invasives and assist farmers with new varieties, crops, and techniques
23 Sector Analysis: Key Economic Risks and Climate Vulnerabilities Water Infrastructure Costs of rising sea levels, associated storm surges and flooding on wastewater treatment plants and distribution systems, and salt water intrusion into aquifers Increased flood damages Increased costs of water quality maintenance due to precipitation changes and higher temperatures Increased costs of storm water management from more intense rainfall events Increased costs of droughts, both for emergency measures and the loss of value to consumers of restricted supplies
24 Sector Analysis: Key Economic Risks and Climate Vulnerabilities Transportation Infrastructure Costs associated with rising sea levels and associated storm surges on the large transportation systems in coastal areas, including road, rail, aviation and maritime transport facilities Increased costs associated with inland flooding from potentially more frequent and intense precipitation impacts on roads, public transit systems and railroads, including more frequent outages Costs associated with rising temperatures and more frequent heat waves on rail tracks, road surfaces and other fixed investment Costs of ice storms and high winds on air, road, and rail transport and outages due to weather-related power failures impacting all forms of transportation 24
25 Key Economic Risks, Vulnerabilities, and Impacts Tremendous concentration of value at risk Coastal property, boardwalks and beaches ($100s of billions in property at risk) Transportation nodes and corridors (e.g. 2 billion rail passengers/year; rail lines at or below sea level; critical hubs for NY/NJ metro region) Coastal and freshwater wetlands ($10s of billions in value of ecosystem services) Large economic Impacts of recent climate events Recent flooding events (2011 Irene statewide costs?; 2007 floods in Passaic ($729 million)
26 Overlap between Climate Change and Other Economic Stresses Loss of tourism revenue due to recession and regional competition overlapping with storm damage Slowdown in pace of coastal property development due to recession (an opportunity for sustainability?) Reduction in public investment in transportation infrastructure maintenance overlapping with more extreme climate events Reduction in local public finances for adaptation planning
27 Implications for Climate Resiliency High level of adaptability already present Many of New Jersey s major economic sectors are accustomed to dynamic economic and environmental conditions (e.g., tourism, transportation, fisheries, agriculture) Need to identify ways to build upon this adaptive capacity to promote climate resiliency (for sectors, local economies, urban systems)
28 Project Team Science Policy Team W. Solecki (P.I.), M. Brady, L. Patrick - City University of New York Economics R. Leichenko, M. Barnes, Rutgers University and D. C. Major, Columbia University Climate D. Robinson, M. Gerbush Rutgers University, Office of State Climatologist R/Econ N. Mantell, M. Lahr, Rutgers University Sector Experts academics, research scientists from Rutgers University, state officials, private sector 28
29

30