Remote Sensing for Monitoring USA Crop Production: What is the State of the Technology
|
|
|
- Rodney Phelps
- 5 years ago
- Views:
Transcription

1 Remote Sensing for Monitoring USA Crop Production: What is the State of the Technology Monitoring Food Security Threats from Space - A CELC Seminar Centurion, SA 21 April 2016 David M. Johnson Geographer United States Department of Agriculture National Agricultural Statistics Service


2 National Agricultural Statistics Service (NASS) Provider of timely, accurate, and useful statistics in service to U.S. agriculture 2


3 NASS Research and Development Division Geospatial Information Group 3

4 Most popular crop reports from NASS Annually end of June Monthly - noon ~ 10 th day Weekly 4PM Mondays 4
5 Millions Area trends of the top three US crops United States Harvested Area (acres) Corn Soybeans Wheat 5
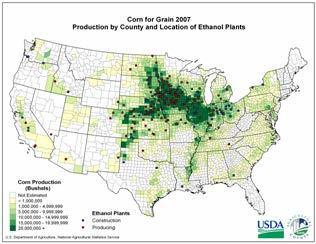
6 Annual land cover classification - Cropland Data Layer (CDL) Complete for Has begun for Annual national coverages 2016 and hopefully beyond will be in the works

7 Wisconsin
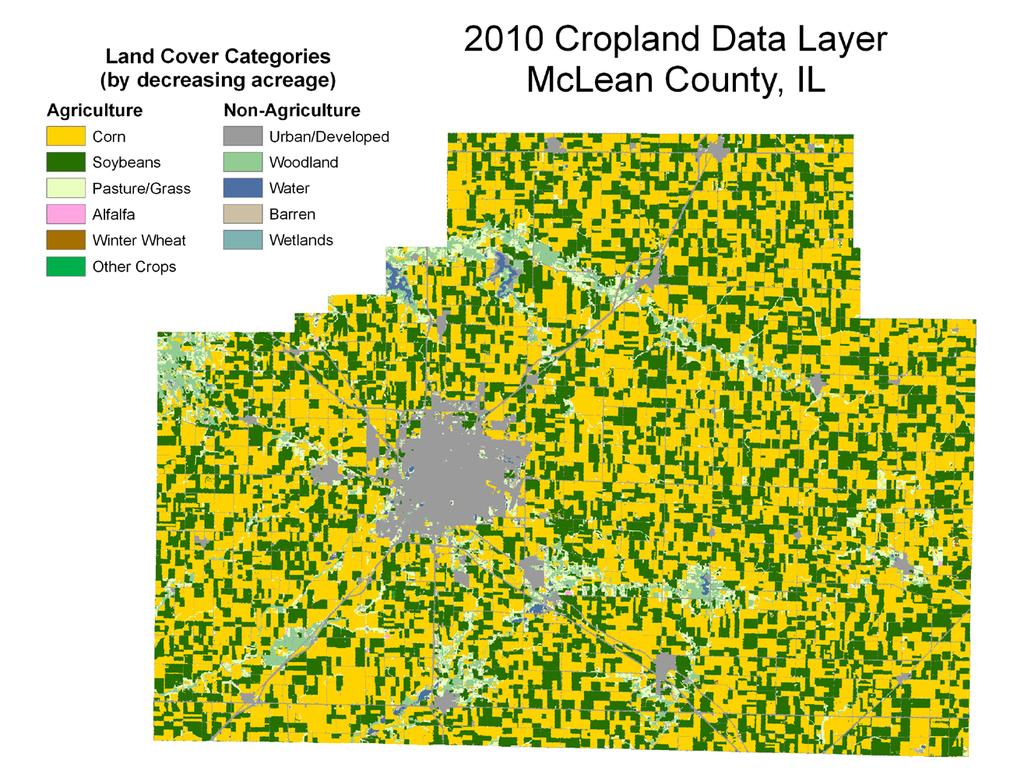
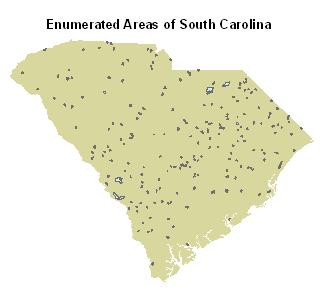
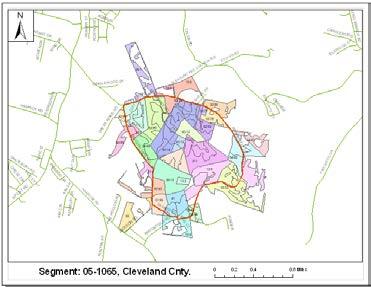
8 County-level example 8

9 CDL overview Annual land cover classification identifying circa summer cultivated crops Used internally by NASS to refine published planted acreage estimates Encompasses conterminous USA fully since 2008 many states have longer history 56m or 30m resolution year dependent since m Built with a supervised boosted classification tree methodology Implemented with Rulequest See 5.0 Utilizes ground/training data from USDA Farm Service Agency (FSA) data National Land Cover Database (NLCD) Derived primarily from Landsat-8 OLI and TIRS DMC Deimos-1 and UK-2 In past used Resourcesat-1 AWIFS and Landsat 5 TM Highly robust for dominant crop types corn, soybeans, wheat, rice, cotton, etc. Useful for a variety of field-level analyses 9

 of")
10 Landsat 8 Optical Land Imager A new era Launched February 11, 2013 Imagery FREE to anyone 30 meter spatial resolution 10 multispectral bands 16-day revisit rate Long history (40 years) of continuity


11 Disaster Monitoring Constellation (DMC) satellites Deimos-1 and UK2 Low cost smallsat with color-infrared 22m resolution Windowing: Multiple acquisitions per orbit Full Swath maximum image size : 600 by 600 Km Along track maximum 16 tiles (1280 Km)

12 Single day of collects, 5 May

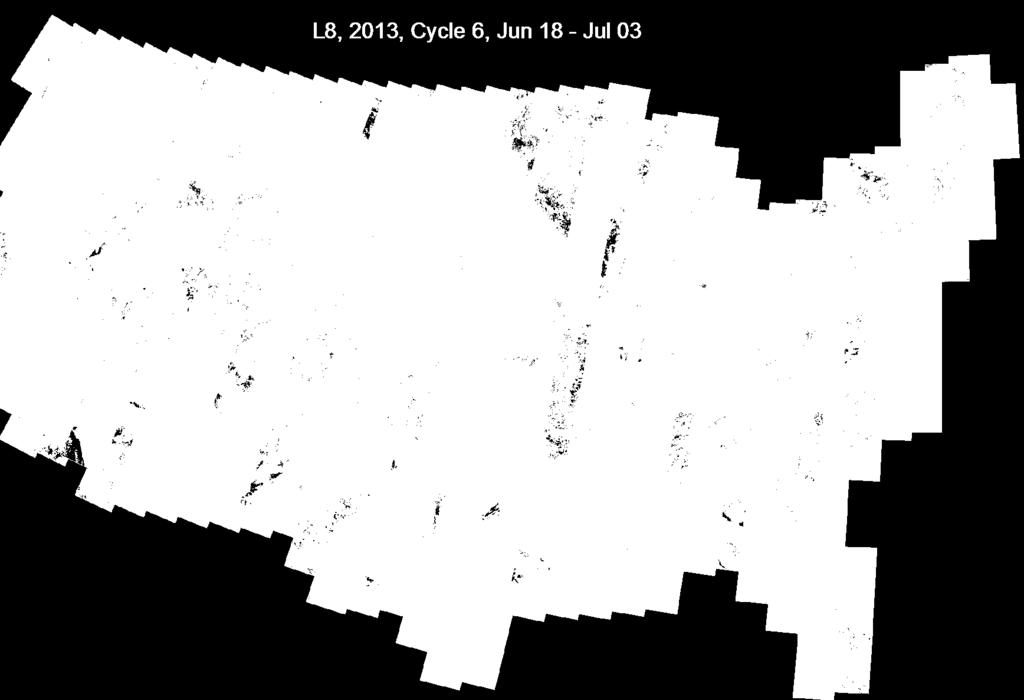
13 Landsat 8 collections 13

14 Example DMC Deimos-1 and UK2 collections June 27 July 2,


15 April August with farm Data overlaid May June Final CDL July 15


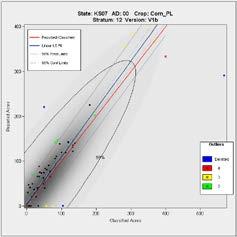
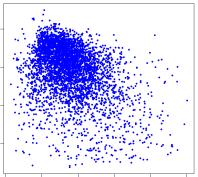
16 Regression Estimation of Area Comparing classification area to that enumerated REGRESSION VARIABLES: Dependent Y Enumerated JAS Segments Independent X CDL Classified Acres Soybeans Wheat
17 Relationship between reported and classified areas Used to counteract areal bias in classification Arkansas Rice - September State: AR10 AD: 00 Crop: Rice Stratum: 11 Version: v2a 600 Reported=Classified Linear LS Fit Reported = *Classified r2 = % Pred Limits % Conf Limits 400 Reported Acres 300 R² Aug Sep Oct Outliers Deleted Classified Acres 17

18 Public access to CDL data Made available online a few months after growing season complete nassgeodata.gmu.edu/cropscape 18
19 NASS Cropland Data Layer known applications Land Cover Carbon Erosion Ecology Yield CRP Ecosystem Climate Acreage Estimates Soil Utilization Ethanol Modeling Research Pest Control Forest Irrigation Pesticides Epidemiology Agribusiness Biodiesel Fertilizer Biofuel Land Use Commodity Planning Water Use Crop Rotation Land Management Watersheds Transportation Environmental Risk Education Disaster Assessment Data Mining Crop Production Wildlife Habitat Change Detection Condition Assessment Urban Growth Soil and Water Fertilizer Usage Crop Intensity Water Quality Mapping Crop Protection 19


20 High quality crop mask Emphasizing cropland, hay, and grassland areas CDL recode and majority vote

21 CDLs, time series analysis

22

23 San Joaquin Stanislaus Merced Fresno Madera California Drought Issues San Joaquin Valley 8 Counties with large amounts of agricultural Investigate how the Fallow/Idle acres in each county have been changing over the last 4 years Kings Tulare Crop Type by Acres in CDL Kern Acres AGU San Francisco
24
25 180 United States Yield (bushel/acre) Trends Corn Soybeans Wheat 25

.")
26 Yields results primarily derived from two surveys Agricultural Yield Farmer reported survey data of expected crop yields. Data obtained throughout the growing season. Conducted in all states except Alaska and Hawaii. Sample size in the 1000s per state. Farm operator contacts are selected from the March Crops/Stocks survey (small grains) and the June Crops/Stocks survey (late season crops and tobacco). Primarily telephone based. Objective yield Corn, Cotton, Soybeans, Wheat, Potatoes. Only done in states where the commodities are primarily found. Samples selected from areas found in June Area Survey ( Acreage ). Performed at 100s of sample sites per state. Biophysical plant/seed measurements obtained. Each plot revisited a few times per season. 26

27 Yield Estimation from Remote Sensing Goals For the major commodities Produce August 1 national and state-level yield indications for inclusion into NASS decision making Followed by September 1st, October 1st, and November 1st. Be independent of current years OY and AY surveys Follow in January with county-level estimates Undertake with marginal budget i.e. free data, cheap or existing software, mainstream computer
28 Remote sensing of crop yields overview Premise (though others research and my own) Positive relationship between crop yield and biomass plant vigor - greenness - NDVI Negative relationship between crop yield and land surface temperature Utilize time-series MODIS satellite data to obtain biomass and temperature estimates throughout the growing season Then use them in an empirically-based prediction model CDL data used to isolate known crop areas Run model at National, State, ASD, and County levels Corn and Soybeans operational currently Potential for several other crops too Must be timely in addition to being accurate Collect current information and assess within a day or two 28

 250 m")
29 Moderate Resolution Imaging Spectroradiometer (MODIS) 250 m resolution, daily imagery

30 Calculation from surface reflectance and use of NDVI (NIR VIS) NDVI = (NIR + VIS) NIR = near-infrared VIS = visible Ranges from -1.0 to 1.0 NDVI is a related to Plant health Chlorophyll content Greenness Biomass Vegetation vigor

31 MODIS NDVI 8-day composite example Lighter shades, greater NDVI 31

32 MODIS surface temperature 8-day composite example Lighter shades, greater land surface temperature 32
 to corn yields")
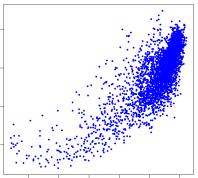
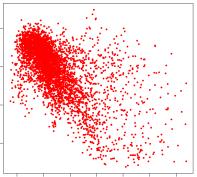
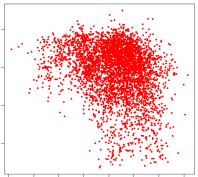
33 The relationships (mid summer) to corn yields 33


34 Intersecting of crop mask with time-series of MODIS data CDL Isolate crop of interest Intersect crop mask with MODIS time series and then spatially average those pixels 34
35


36 NDVI and DLST time-series correlations (r) n =
37

38
39 Johnson, 2014


40 Localized example of yield map variability Scene of a large hailstorm Landsat image Modeled yields from MODIS 40
41

42 Integrating Landsat with MODIS site, p26 r31

43 Landsat 7 and 8 p26 r31 NDVI 2013 growing season

44 Gao Fused MODIS/Landsat NDVI /5 6/21 7/7 7/23 8/10

45 1,0 MOD09 NDVI 0,8 0,6 0,4 0, ,0 Fused Landsat/MODIS 0,8 0,6 0,4 0,


46 Cloud Computing Google Earth Engine The whole Landsat and MODIS archive staged in GEE for analysis


47 GEE: Use to produce future and retrospect CDLs? 2008 CDL 2007 (non existent currently )


48 NDVI 0,8 0,7 0,6 0,5 0,4 0,3 0,2 0,1 0 GEE time series analysis T_NDVI_BU T_NDVI_CDL T_EVI_BU T_EVI_CDL Illinois, USA crop areas Free State, South Africa crop areas

49 Thanks David M. Johnson Geographer United States Department of Agriculture National Agricultural Statistics Service