SYRIA COUNTRY OFFICE MARKET PRICE WATCH BULLETIN JULY 2018 ISSUE 44
|
|
|
- Prosper Merritt
- 5 years ago
- Views:
Transcription

.")
 and unsubsidized bread (58 percent) than the national average.")
1 SYRIA COUNTRY OFFICE MARKET PRICE WATCH BULLETIN JULY 2018 ISSUE 44 Photo: WFP/Marwa Awad Highlights Standard Food Basket Despite a general annual downward trend, a slight increase was recorded in the price of a standard food basket in July, mainly driven by increasing prices in basic food commodities such as bread and lentils. In July 2018, the national average price of a standard food basket 1 increased to SYP 24,507 after a one percent month-on-month (m-o-m) increase. Despite the small increase since June, the mean national price has seen an overall downward trend of four percent since January 2018 and 24 percent year-on-year (y-o -y). The price of government subsidized bread increased by 12 percent in hard-to-reach areas. Idleb continues to have significantly higher prices of both subsidized bread (145 percent) and unsubsidized bread (58 percent) than the national average. The wholesale price of wheat and bulgur grains increased, leaving Syrian wholesale wheat grain prices more than double the international market price of wheat US $ 464/MT compared to US $ 216/MT. The average daily wages for unskilled labour continues to increase at a higher level than livestock prices, positively impacting the purchasing power of households relying on casual labour compared to households relying on livestock. Inflation has been reducing but remains high at an estimated 27 percent in May 2018 (Central Bureau of Statistics). For further information please contact: Jan Michiels Jan.Michiels@wfp.org Dima Alhumsi Dima.Alhumsi@wfp.org Chart 1: National Min., Max. and Average Cost of Food Basket, SYP The gap between the highest and lowest food basket price by governorate, which was more than SYP 31,000 in July 2017, has fallen by 36 percent y-o-y to around SYP 11,000, showing that food basket prices are converging across Syria. The highest average food basket price by governorate fell by 46 percent y -o-y while the lowest fell by 24 percent y -o-y (Chart 1). Figure 1: Food Basket Cost and Changes, SYP Deir-ez-Zor faced the highest food basket price in July (SYP 31,095) followed by Lattakia (SYP 27,250) and Quneitra (SYP 26,648). AlHasakeh and Hama reported the lowest food basket prices at SYP 19,919 and 22,865 respectively. The highest m-o-m increase in food basket price was reported in Lattakia (19 percent) while Deir-ez-Zor experienced the highest decrease in food basket price since June (11 percent). Map 1: Location of markets monitored by WFP Since January 2018, 11 governorates have experienced a reduction in price trend, now being able to buy basic food commodities an average of 11 percent cheaper. While the y-oy trend shows that all governorates have seen decreases in food basket prices varying from five to 46 percent. 1. The standard food basket is a group of essential food commodities. In Syria, the food basket is set at a group of dry goods providing 1,930 kcal a day for a family of five during a month. The basket in1 cludes 37 kg bread, 19 kg rice, 19 kg lentils, 5 kg of sugar, and 7 kg of vegetable oil


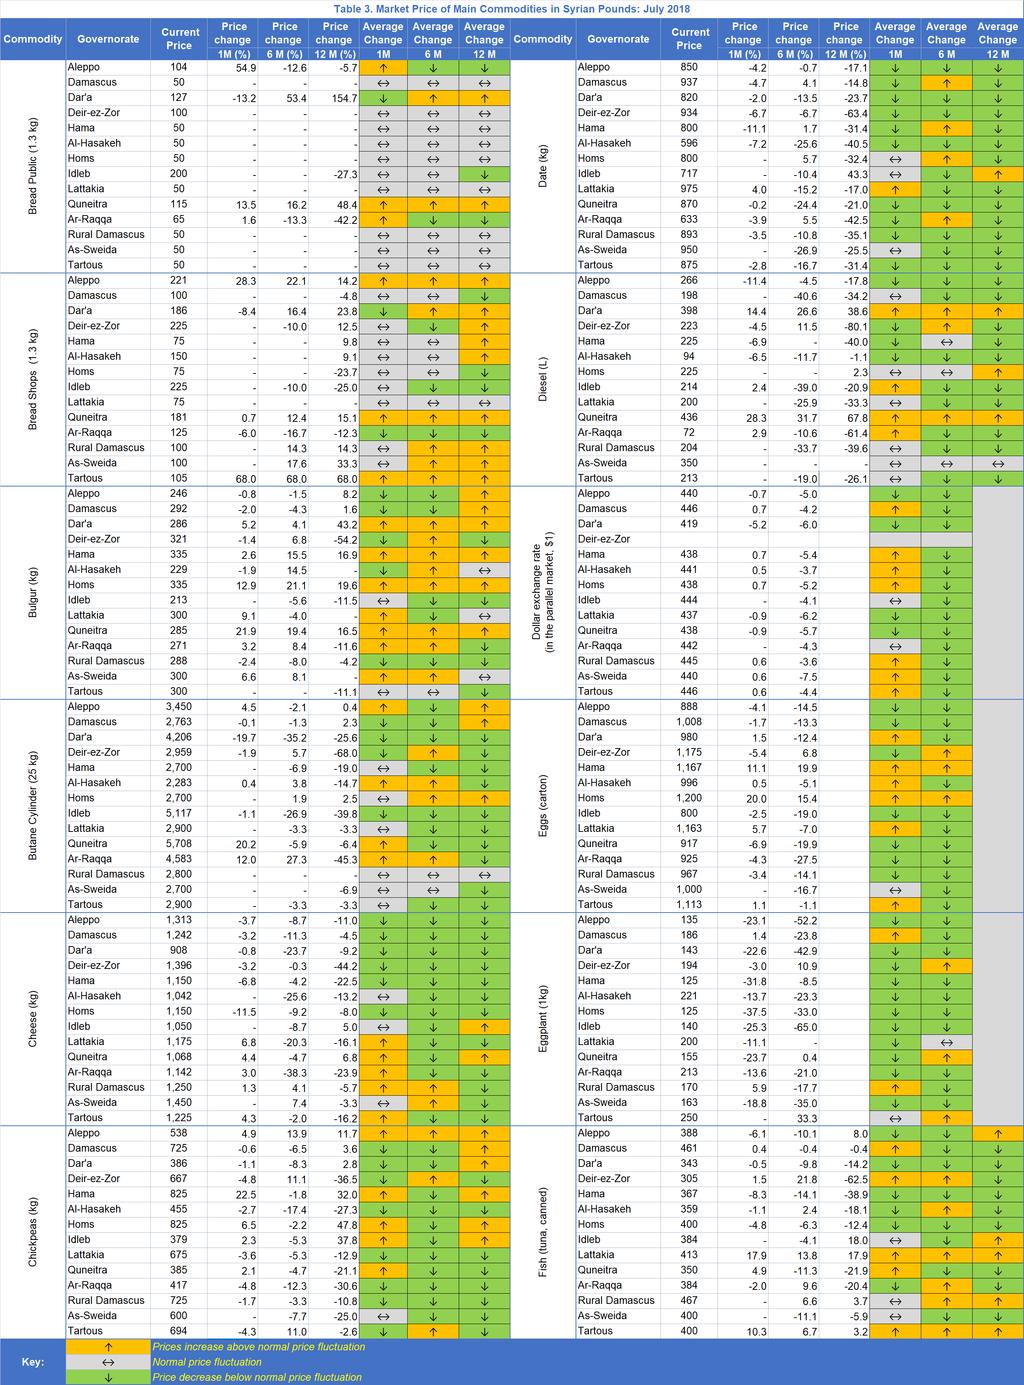
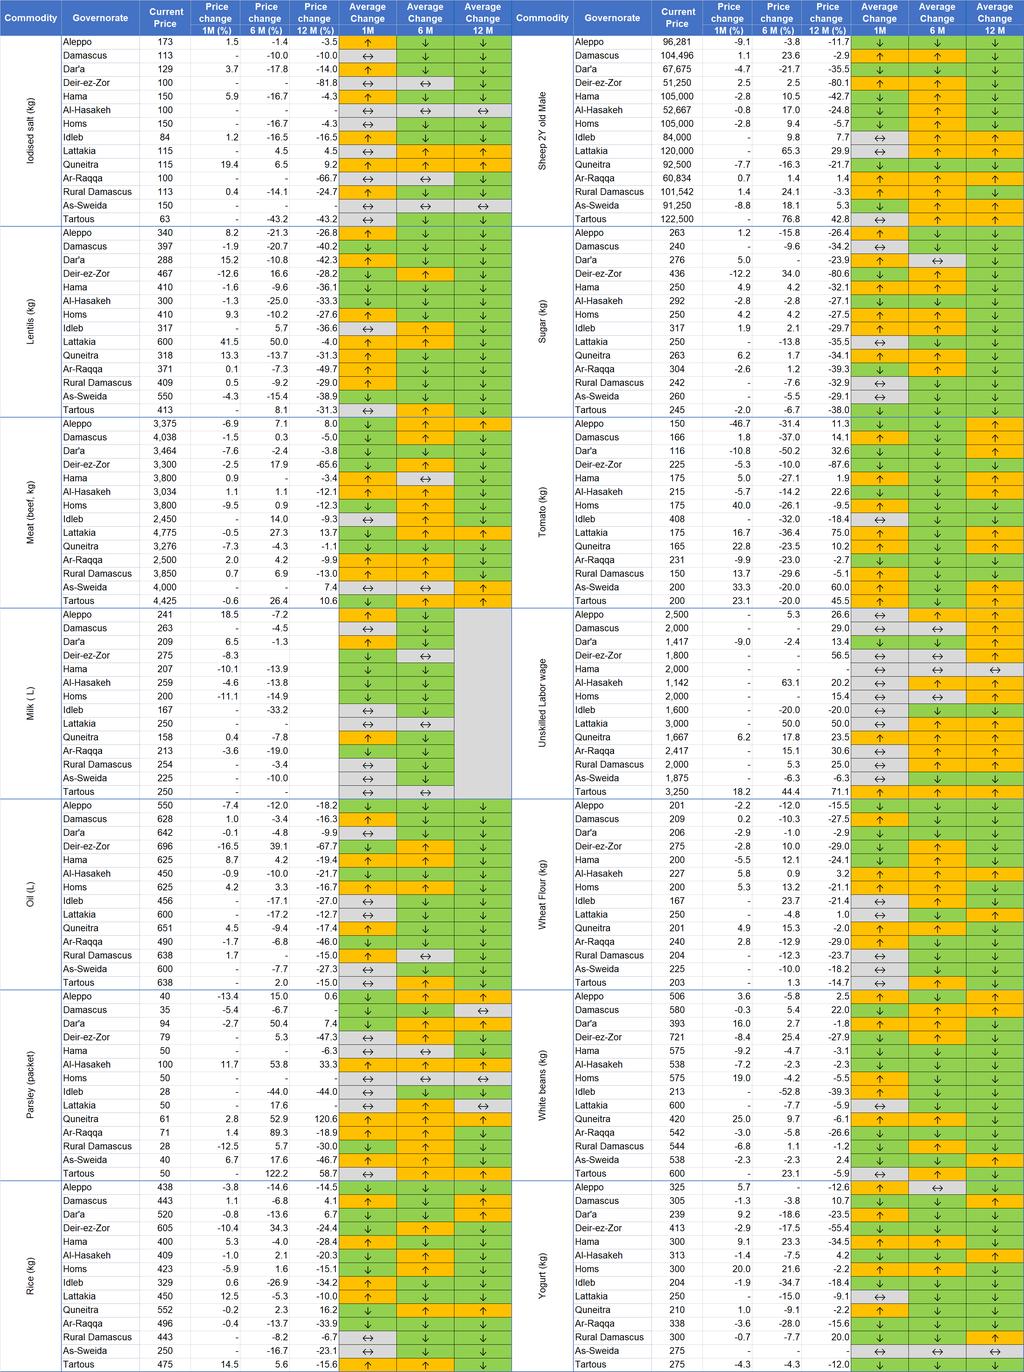
2 Retail Prices Retail prices of staple cereals Chart 2: Retail Prices of Wheat Flour Retail, SYP Across Syria s main markets, the national retail price of wheat flour was recorded at SYP 212/kg, Egyptian white rice at SYP 448/kg and one kg of bulgur was sold at SYP 286 in July The price of bulgur saw a m -o-m increase of four percent, rice fell by one percent and the price of wheat flour remained unchanged. An annual comparison shows that the prices of all three staple foods are now cheaper y-o-y; wheat flour 18 percent, rice 15 percent and the price of bulgur is down four percent. When comparing prices according to accessibility, since January 2016 the prices in hard-to-reach areas have been at a higher level for all three commodities. Accessible areas experienced six percent increases in bulgur prices while wheat and rice went down by three and two percent respectively. Hard-to-reach areas reported a fall of ten percent for rice and price increases for wheat flour (five percent) and bulgur (six percent). The y -o-y price trend in Idleb governorate shows price falls across all three commodities. The price of rice fell from SYP 500 to SYP 329 (34 percent) while wheat flour and bulgur also saw decreasing trends (down 21 and 11 percent respectively). Deir-ez-Zor reported the highest prices across Syria for many main food commodities, including for: vegetable oil (SYP 696/litre), sugar (SYP 436/ kg), wheat flour (SYP 275/kg), white beans (SYP 721/kg) and yoghurt (SYP 413/kg). Idleb continues to face the highest prices for tomatoes at SYP 408/ kg July prices for beef (SYP 4,775/kg) and lentils (SYP 600/kg) were highest in Lattakia. Chart 3: Retail Prices of Rice, SYP Chart 4: Retail Prices of Bulgur, SYP The lowest prices for vegetable oil were reported from Al -Hasakeh (SYP 450/litre) sugar in Damascus (SYP 240/kg), tomatoes in Dar a (SYP 116/kg), beef in Ar-Raqqa (SYP 2,500/kg) and Idleb reported the lowest prices for: wheat flour (SYP 167/kg) white beans (SYP 213/kg), yoghurt (SYP 204/kg), and lentils (SYP 317/kg). Bread The national average retail price for government subsidized bread (Chart 5) was SYP 82/bundle (1.3 kg) in July 2018 after a two percent m -o-m increase while the price of commercial bread (Chart 6) was SYP 143/bundle after a similar increase. Overall, Idleb faced notably higher bread prices since 2016 while accessible areas faced the lowest prices of bread averaging at SYP 58 for subsidized bread and SYP 120 for bread sold at market price compared to SYP 200 and SYP 225 respectively in Idleb. Subsidized bread continues to be sold at SYP 50/bundle throughout eight governorates across Syria. The highest prices were identified in opposition - held areas of Idleb (SYP 200/bundle) followed by Dar a (SYP 127/bundle) and Quneitra (SYP 115/bundle), while the highest m -o-m increase was seen in Aleppo at 55 percent to SYP 104/bundle. For unsubsidized bread, the highest increases were found in Tartous and Aleppo which experienced m -o -m increases of 68 and 28 percent respectively. Large m-o-m increases were found in the bread prices in hard-to-reach areas, namely 41 percent for subsidized bread and 16 percent for commercial bread. On an annual basis, subsidized bread has increased by 16 percent in hard - to-reach areas and four percent in accessible areas while it has decreased in Idleb (27 percent). For bread purchased at the market, prices have increased by 13 percent in accessible areas and seven percent in hard -toreach areas while it decreased by 25 percent in Idleb governorate. Chart 5: Retail Prices of Subsidized Bread, SYP Chart 6: Retail Prices of Commercial Bread, SYP 2

3 Diesel and butane gas In July 2018, the mean national retail price of diesel was SYP 249/ litre; the third consecutive month of small increases in the national average price of diesel after more than one year with a falling trend. Despite the small increase, the y-o-y trend shows a fall of 25 percent across Syria. Chart 7: Retail prices of diesel, SYP In accessible areas, the price of one litre of diesel was SYP 243 while the price averaged at SYP 277/litre in hard -to-reach areas and SYP 214/litre in Idleb. Quneitra and Dar a saw the highest price and the highest m-o-m increases at SYP 436/litre and 28 percent increase in Quneitra and SYP 398/litre and 14 percent increase in Dar a. The lowest price of diesel was recorded in Ar -Raqqa at SYP 72/litre, up three percent m-o-m. Since January 2018, the price of diesel has increased by 12 percent in hard-to-reach areas while it is down seven percent in accessible areas and 39 percent in Idleb governorate (Chart 7). On y -o-y basis, the average price of diesel has decreased in hard -to-reach areas by 52 percent, in Idleb by 21 percent and in accessible areas by 13 percent. The average price for butane gas (key commodity for cooking) was SYP 3,463/25k across the Syrian markets in July after a m -o-m decrease of two percent (Chart 8). The price for a 25k cylinder varied widely according to accessibility, where accessible areas had the lowest price of 3,106/25k, hard-to-reach areas averaged SYP 4,267/25k (down six percent m-o-m) while the price was SYP 5,117/25k (down one percent m-o-m) in Idleb governorate. The highest prices were found in Quneitra at SYP 5,708/25k (up 20 percent m -o-m) while the lowest price (2,700/25k) was recorded in Hama, Homs, Quneitra and As-Sweida governorates. The largest fall in gas price was recorded in Dar a governorate at 20 percent m-o-m while the price in Deir-ez-Zor is down 68 percent y-o-y. Cereal wholesale prices The average nominal wholesale price of cereal was SYP 201,286/MT for wheat grain, SYP 233,502/MT for bulgur and SYP 361,019/MT for Egyptian white rice in July 2018 (Table 1). The m-o-m price for bulgur and wheat grain increased by 2.9 and 2.7 percent respectively while rice decreased by 2.3 percent. Chart 8: Retail prices of butane cylinder, SYP Table 1: National average wholesale prices for wheat, bulgur and rice, SYP and US$ using official exchange rate, 1 MT Commodity July (SYP) % change (m-o-m) 1MT in US$ Wheat grain (1 MT) 201, Bulgur grain (1 MT) 233, Rice (1 MT) 361, Chart 9: Trends of food and cereals price indices Using the Syrian Central Bank s official US dollar exchange rate (SYP 434), the price of wheat grain was US$ 464/MT, US$ 538/MT for bulgur grain and US$ 832/MT for rice. International market prices In July 2018, the international food and cereal prices continued to fall (Chart 9). The Food Price Index decreased to points while the Cereal Price Index averaged points, both decreasing by nearly four percent m-o-m (3.7 and 3.6 percent respectively). While the wholesale wheat grain prices on local markets averaged US $ 464/MT, up nearly three percent m -o-m, the wholesale price of wheat on international markets was US $ 216/MT, less than half the price in Syria. Source: FAO 3
.")

4 Exchange rates Averaging SYP 439 to one US$ (down 0.5 percent m-o-m), the blackmarket exchange rate varied between SYP 419/US$ (Dar a) and SYP 446/1US$ (Damascus and Tartous) in July. The official Central Bank exchange rate stayed at SYP 434, at a slightly lower level than the national average black market exchange rate (Table 2). Dar a experienced the highest fall in the black market exchange rate (5.2 percent) which is mainly due to a fall in the dollar rate in previous opposition-held areas. Other governorates experiencing a black market m-o-m exchange rate fall were Lattakia and Quneitra both at 0.9 percent, and Aleppo at 0.7 percent. Damascus, Hama and Homs experienced the highest increases (0.7 percent) followed by 0.6 percent increases in Rural Damascus and As -Sweida. Official exchange rate compared to black market Table 2: Black market exchange rate, 1 US$ to SYP Governorate July 2018 % change (m-o-m) Aleppo Damascus Dar'a Deir-ez-Zor NA NA Hama Al-Hasakeh Homs Idleb Lattakia Ar-Raqqa Rural Damascus As-Sweida Tartous Quneitra National Average Official exchange rate Chart 10: Official US $/ SYP exchange rate vs. black market exchange rate Syria s official and black market exchange rates to the US$ follow similar trends, illustrated in Chart 10. The strong similarity occurs notwithstanding the fact the black market exchange rate appears to be freely-floating while the official exchange rate is fixed. It is unclear if either exchange rate trend is influencing the other or if both rates trends are influenced by other factors. Though the national average black market exchange rate tends to be slightly higher than the official exchange rate, they nevertheless increase and decrease around the same period and by the same amount. When correlating the two exchange rates with each other, a correlation of 0.98 out of 1 is derived, confirming the very strong similarity between the two exchange rates as a correlation of 1 equals perfect correlation where variables are moving (increasing or decreasing) by exactly the same proportion at the same time. Chart 11: GDP growth rate and inflation Source: Central Bank of Syria and WFP Inflation and GDP Syria s GDP growth rate has heavily reduced over the past seven years (Chart 11). Falling from 4.4 percent in 2010 to 24.8 percent in 2013 and has since partly recovered to 3.4 percent in 2016 (Central Bank of Syria). Syria s annual inflation rate was 4.8 percent in 2010, it reportedly peaked at 89.6 percent in 2013 and fell to 47.7 percent in 2016 (Central Bank of Syria). The inflation rate was last estimated at 27.1 percent in May 2018 by Syria s Central Bureau of Statistics. Source: Central Bank of Syria Chart 12: Syria accessibility levels per July 2018 Syria accessibility Following OCHA s updated accessibility levels in July 2018, only Idleb is now accounted as cross-border (XB). All other areas are now accessible (though at different degrees) for humanitarian interventions from inside Syria. This is after previous XB areas of Dar a and Quneitra have changed accessibility levels from XB to hard -to-reach (Chart 12). These changes are reflected in the price analysis of this report conducted according to accessibility levels. Source: OCHA 4
5 Terms of Trade (ToT) 2 Since 2014, the mean national daily wage for unskilled workers has shown a steady upward trend with increases of three percent m -o-m and 20 percent y-o-y, leaving the current wage-level nearly double that of June 2015 (SYP 2,042/day vs. SYP 1,039/day). For households relying on livestock as their main income (reflected by the price of a 2 year-old sheep) the development has been more volatile during the period, showing decreases of two percent m-o-m and 20 percent y-o-y (Chart 13). It should be kept in mind that high inflation rates have led to food prices currently at around seven times higher than their pre -crisis level. This has an undermining effect on overall purchasing power. Households relying on wage labour are typically expected to be affected more by high inflation rates since households relying on agriculture are more self-sufficient and depend less on markets to meet their food needs. However, due to the more volatile nature of livestock prices, the overall purchasing power reflected by the ToT still shows a higher improvement for households relying on wage labour. Chart 13: Unskilled wage labour rates in Syria vs. livestock price (2y old sheep), national mean, SYP Chart 14: ToT between commercial bread and wage labour vs. livestock ToT between commercial bread and wage labour vs. livestock In ToT, the average daily wage of an unskilled labourer could buy 9.6 kg of unsubsidised bread in January 2016, falling to 7.6 kg/daily wage in November 2016 and afterwards increasing by 90 percent to 14.3 kg by July 2018 (Chart 14). In relation to prices of livestock, the lowest ToT was recorded in November 2016 at kg/livestock while the highest was in August 2017 (858.1 kg/livestock). The current level is up 19 percent since November 2016 and down 28 percent since August Chart 15: ToT between rice and wage labour vs. livestock ToT between rice and wage labour vs. livestock The purchasing power of daily wages in relation to the price of Egyptian white rice/kg was volatile during 2016 after which it has been increasing by 86 percent until its current level (4.6 kg/daily wage). This has been steadily increasing by an average four percent m -o-m, 17 percent since January 2018 and 41 percent y -o-y (Chart 15). For households relying on livestock ownership, the price of a two - year-old sheep could buy kg of rice, which is seven percent less than July 2017-levels, however, it is up 17 percent since January Chart 16: ToT between diesel and wage labour vs. livestock ToT between diesel and wage labour vs. livestock An overall increase in the ToT between diesel and wage labour has been seen since early 2017 from 3.4 litres/daily wage in December 2016 to 8.2 litres/daily wage in July 2018, equalling an increase of 141 percent (Chart 16). Across Syria, the relationship between diesel and livestock prices has been volatile with an overall increasing trend since late In December 2016, the profit of selling a two-year-old sheep could buy litres which despite monthly volatility has increased by 80 percent to its current level of litres/livestock by July The Terms of Trade (ToT) are proxy indicators of the purchasing power of households that rely on casual labour and/or livestock as their main source of income for the purchase of cereals from local markets. ToT are important components of food security analysis. Changes in the terms of trade between wages/livestock and staple food commodities are indicative of the trends in purchasing power and the impact on the food security situation of households dependent on food purchases through income from daily wage labour and/or the sale of livestock. 5
6 6
7 7