Impact of Water Harvesting Structures on water Availability-A A Case Study of. Maharashtra
|
|
|
- Camilla Rosemary Farmer
- 5 years ago
- Views:
Transcription
1 Impact of Water Harvesting Structures on water Availability-A A Case Study of Kokarda Watershed, Nagpur District, Maharashtra V. Ramamurthy National Bureau of Soil Survey & Land Use Planning Amravati Road, NAGPUR
2 INTRODUCTION Land, water and vegetation are the most vital natural resources Water is a major resource for the domestic, agricultural and industrial sector Over exploitation and improper management of water resource coupled with erratic and reduced rainfall made this resource more and more scarce in the rural livelihood Therefore, while planning for improvement of rural and social upliftment, one should not ignore water management strategies
3 General description of study area Location: Kokarda watershed of Kalmeshwar Taluka of Nagpur District, Maharashtra Latitude: 21 o 20 N Longitude: 78 o 51 E Altitude: 350 m above MSL Area : 280 ha Mean Annual Rainfall:1100mm Agro-climate: Agro-Ecological Sub-Region (AESR) 10.2 represented by Eastern plateau hot sub-humid ecosystem with shallow to medium deep black soils with the length of growing period (LGP) being days.
4 Table: Rainfall distribution in normal year Met week Dates Rainfall (mm) No. of rainy days 26 Jun 25-Jul Jul Jul Jul Jul Jul 30-Aug Aug Aug Aug Aug 27-Sept Sept Sept Sept Sept Oct Oct 29-Nov Total
5
6 Trend Analysis Parameter Rainfall Water table Crops Sorghum Cotton Pigeonpea Vegetables Cotton Sorghum Soybean Pigeonpea Vegetables Soybean Cotton Sorghum Vegetables Pests and diseases ψψ ψψψψ ψψψψψ Yield Erosion ẸẸẸ ẸẸẸẸ ẸẸẸẸẸ λλλλλ λλλ λλ Goat ۴۴۴ ۴۴۴۴ ۴۴۴۴۴ Cattle ΩΩΩΩ ΩΩΩ ΩΩΩ Labour availability Input cost Income Diversification in farming
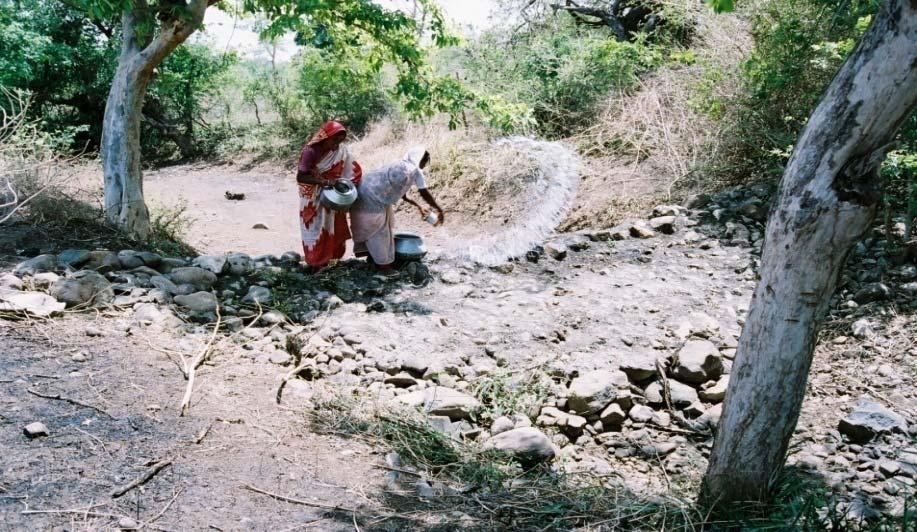
7 Prioritization of problems Low water table of wells Scarcity of drinking water Lack of drinking water for animals Lack of percolation water tank Non-availability of lift irrigation facilities Motor for supply of drinking water

8 Main stream originates at top of hillock runs (North-south) through middle of watershed. There are several small streams -width of 1-2 m originating from crop fields and joining the main 4 th order stream. The width of mainstream -3-6 m with depth varying 2-3 m in the middle and lower reach while the length of stream was measured 1.5 km. No. of percolation tanks rejuvenated 02 No. of modified gabion structure built in drain line 05 No. of loose boulder structures 10 No. of Farm ponds 01 No. of well recharge ponds 01

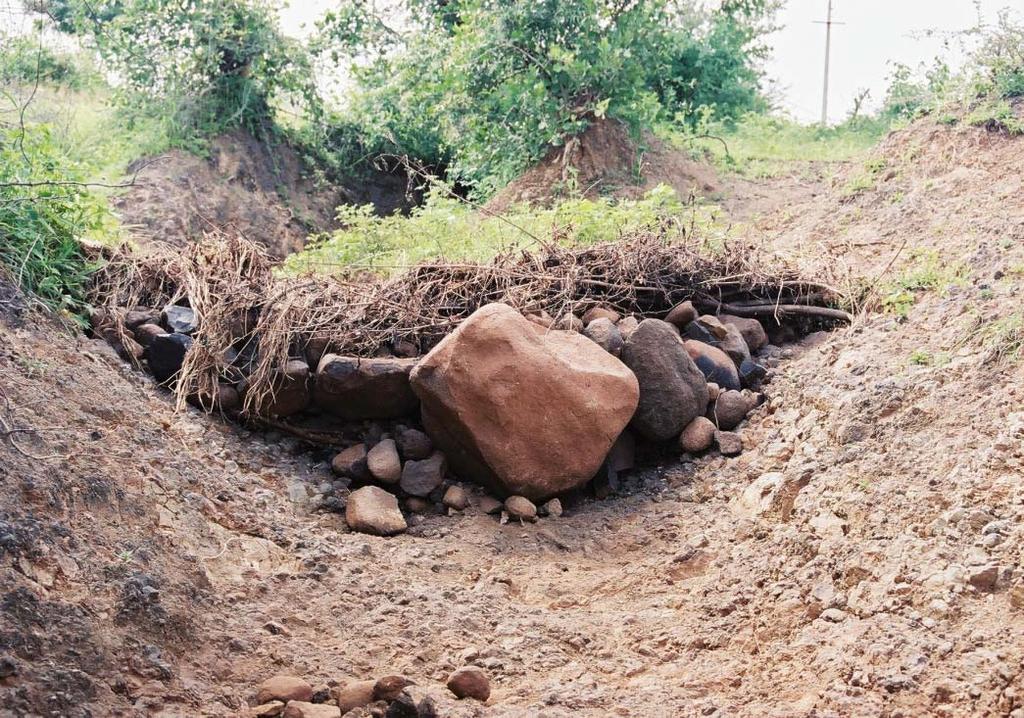
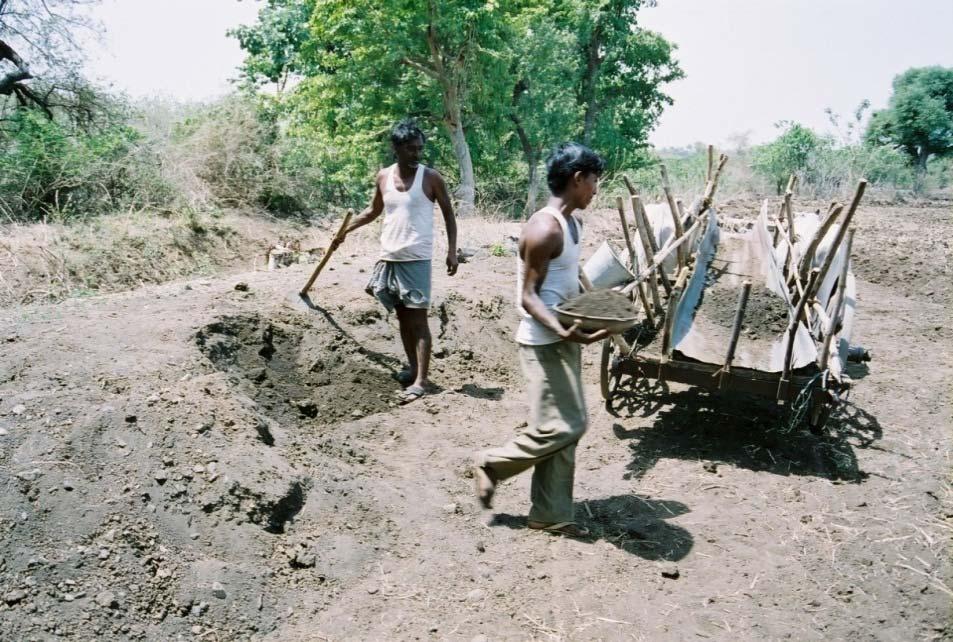
9 Traditional nala bunds
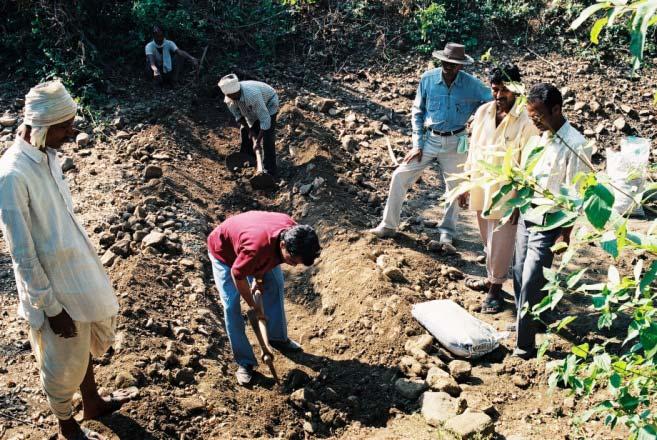
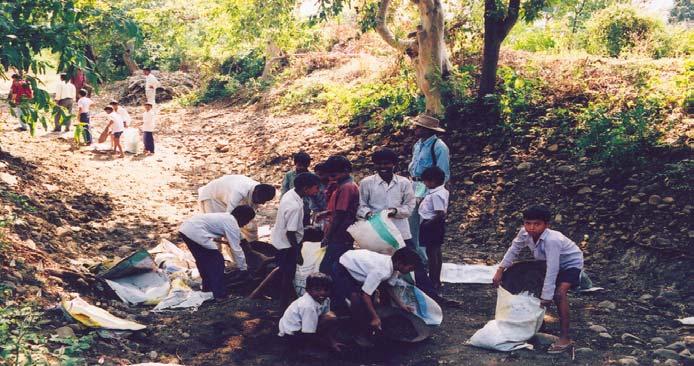
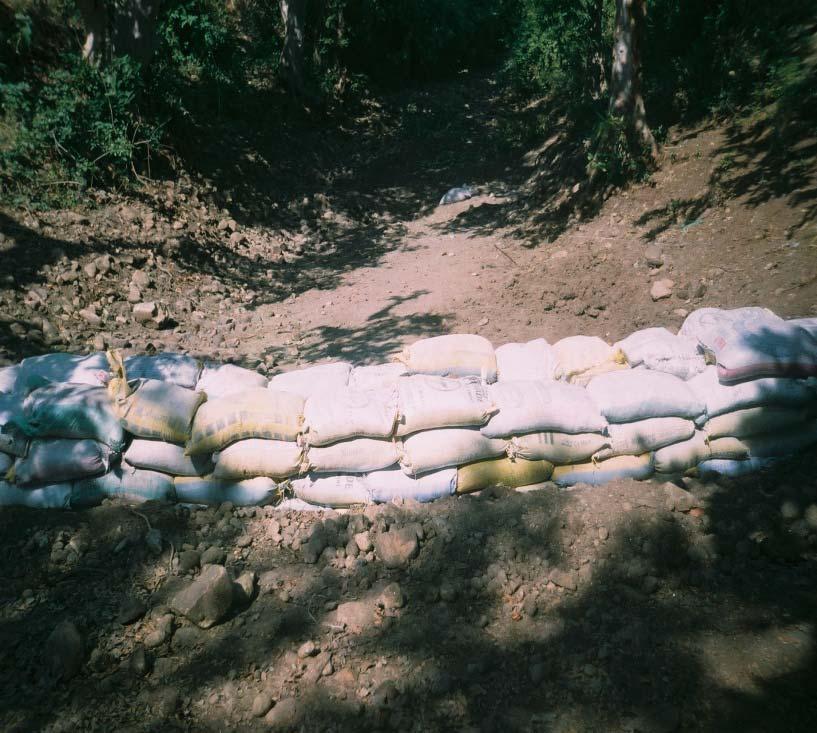

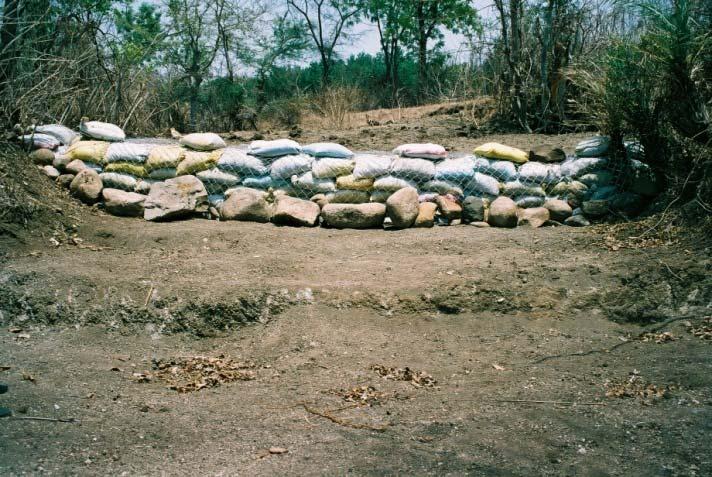
10 Construction of Modified gabion structures


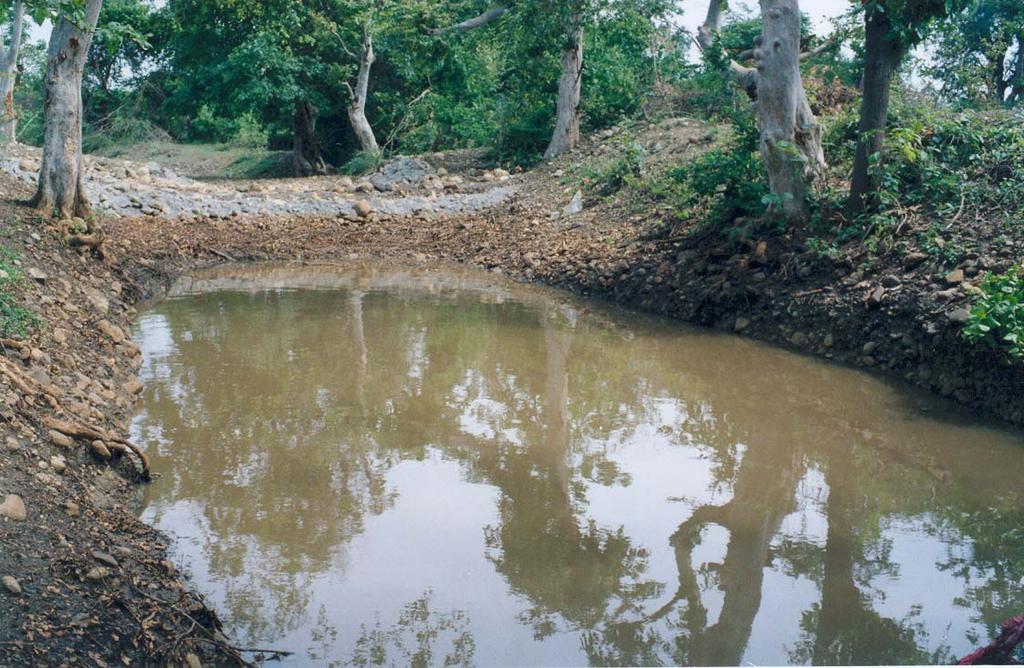
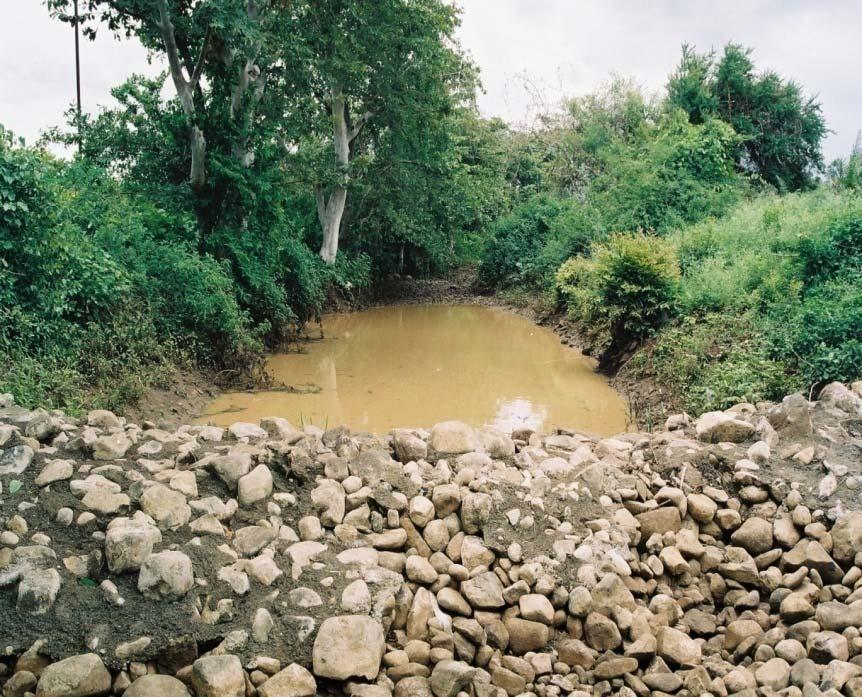
11 Rainy season view of nala bund built in drain line
12


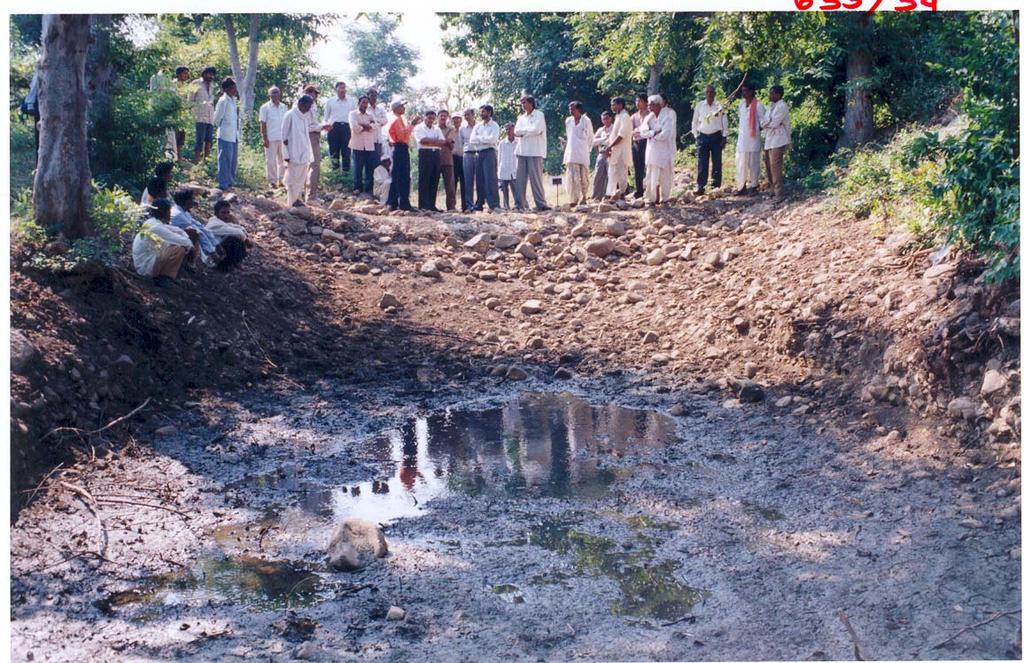
13 Heavy seepage through embankments A small impervious wall of 50 cm depth, 20 cm top width and 1:4 upstream slope helped in reducing seepage through embankment base increased opportunity time for vertical movement of water. Water level in the percolation tank after rains Desiltation & stone pitching work in progress Repaired existing percolation tank


14 The runoff water from a catchment measuring 5.6 ha was harvested in to a recharge pond measuring top length and breadth 6m and bottom length and breadth 4 m and height 1.5 m. Well recharge pond


15 Harvested water is being used for vegetable nursery and protective irrigation to wheat and gram in rabi Farm pond


16 Series loose boulder structure in the nala

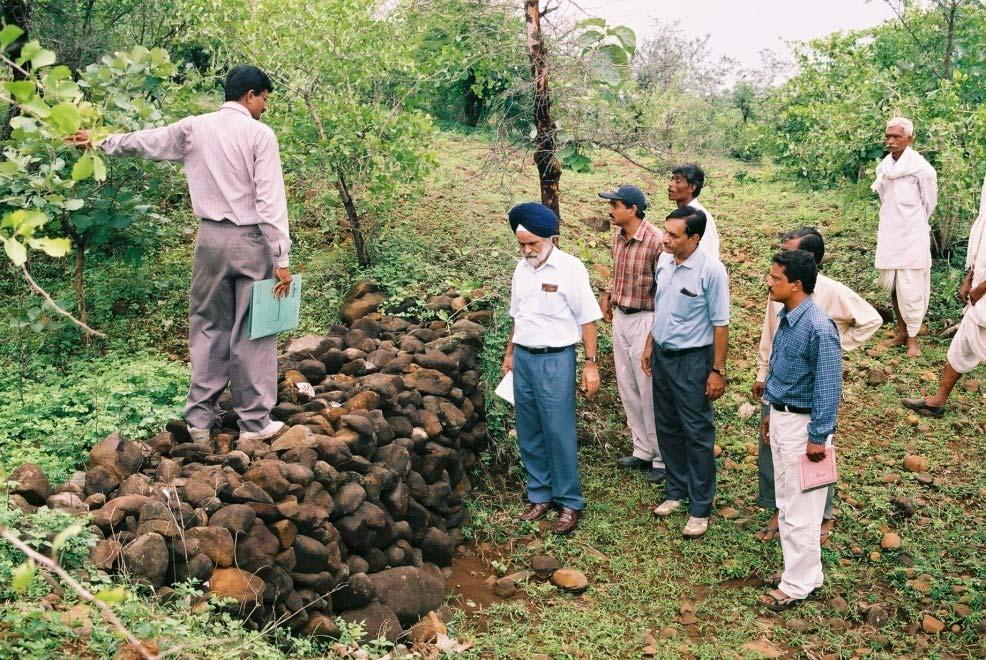
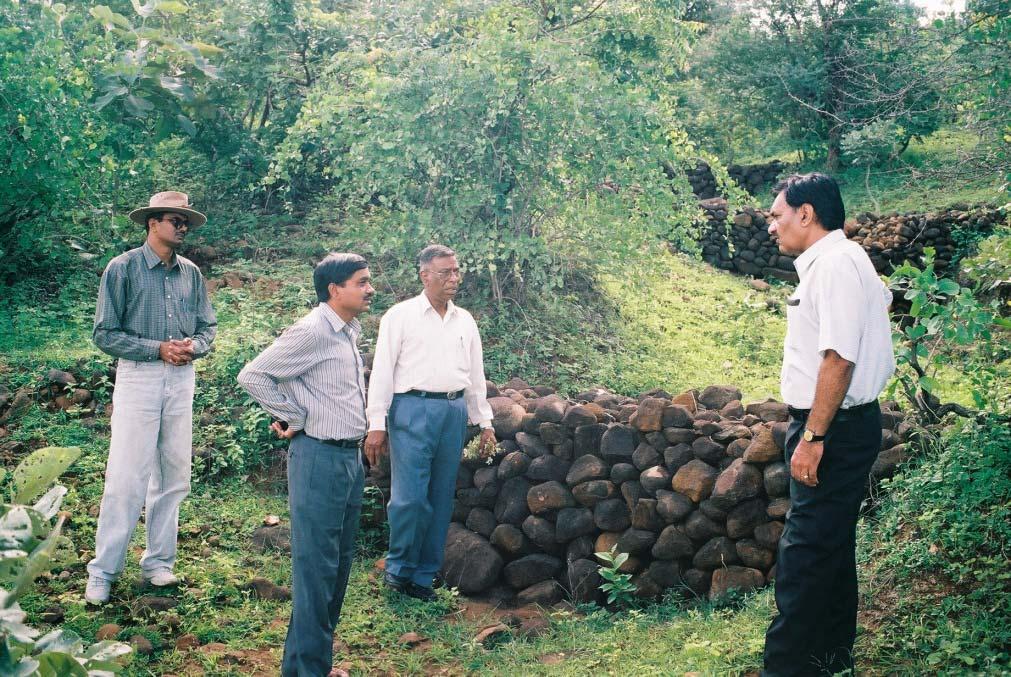
17 Loose boulder structures in nonarable land
 Period Rainfall (mm) Effect of percolation tank Effect of nallah bunding")

18 RESULTS Measuring water level of recharged well due to improved embankment Table. Rainfall and well water levels (mean of 3 years) Period Rainfall (mm) Effect of percolation tank Effect of nallah bunding June-Sept. (Rainy) m 9.9 m Oct.-Jan. (Post Rainy) m 9.2 m Feb- May (Summer) m 7.4 m Water levels rose to the tune of 3 to 8 m in the vicinity of percolation tanks and 6 to 10 m in the vicinity of nallah bunds. A total of 23 wells (50 %) were found to be partly or fully influenced
19 Water availability duration in wells No. of wells Before Intervention After Intervention 3 months 6 months 9 months 12 months % improvement in perenniality of wells was observed due to percolation tank and nala bunding Water availability in wells went up from 3-4 months before water conservation interventions to 8-9 months after interventions
20 Increased well yield/recuperation Duration of pumping hours before well goes dry and time it takes to recuperate to the same level were monitored from sample wells. Water yield/recuperation rate/ recharge rate increased by per cent. Before intervention, the wells went dry after 1 to 1.5 hrs pumping and got recuperated in hours. After implementation of interventions, pumping could be done for 1-2 hours before well went dry and it took hours to recuperate. This may be attributed to enhanced ground water augmentation as a result of water conservation measures.
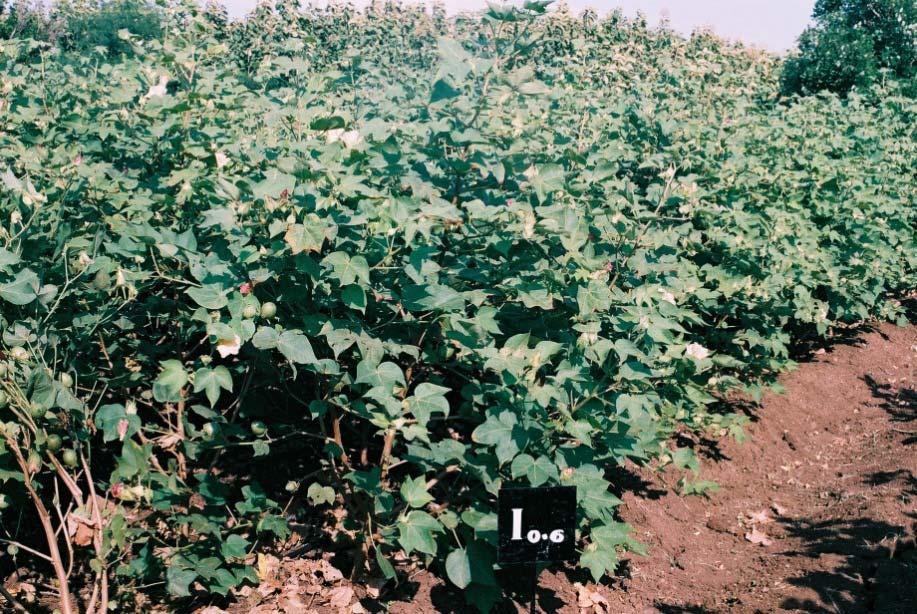
21 Table: Yield of cotton as influenced by reuse of water harvested through recharge pond. Treatments Seed cotton yield (q/ha) Irrigation water applied (mm) WUE (Kg ha -1 mm -1 ) Rainfed (90 x 90 cm) (Control) Paired row (180 x 60 x 90 cm) planting and irrigation at early boll development stage with harvested water Paired row planting and irrigation at early flowering and boll development stage with harvested water Furrow irrigation at 0.6 IW/CPE Furrow irrigation at 0.8 IW/CPE C.D at 5% The run-off collected from an area of 5.6 ha catchment was 5423 m 3 Protective irrigation at early boll development stage recorded significantly higher seed cotton yield. WUE was maximum in the treatment where only one protective irrigation was provided at early boll development stage

22
23 Effect of Nala Bunding and Percolation Tank on Water Resources in Watershed Item Total rainfall 928 mm 757 mm Near Nala bunding Crop Area (Ac) No. of Area (Ac) No. of Irrigations Irrigations Citrus Wheat Gram Near percolation tank Control (Rs. 10,000/- spent on deepening of wells) Citrus Wheat Gram Citrus Wheat Gram
24 Fig. Area under irrigation and crop diversification Area (ha) Before Intervention After Intervention ( ) w heat Vegetables Orange Fodder Water yield/ recuperation rate increased per cent due to percolation tank and nala bunding. Area under irrigation increased by 41 %


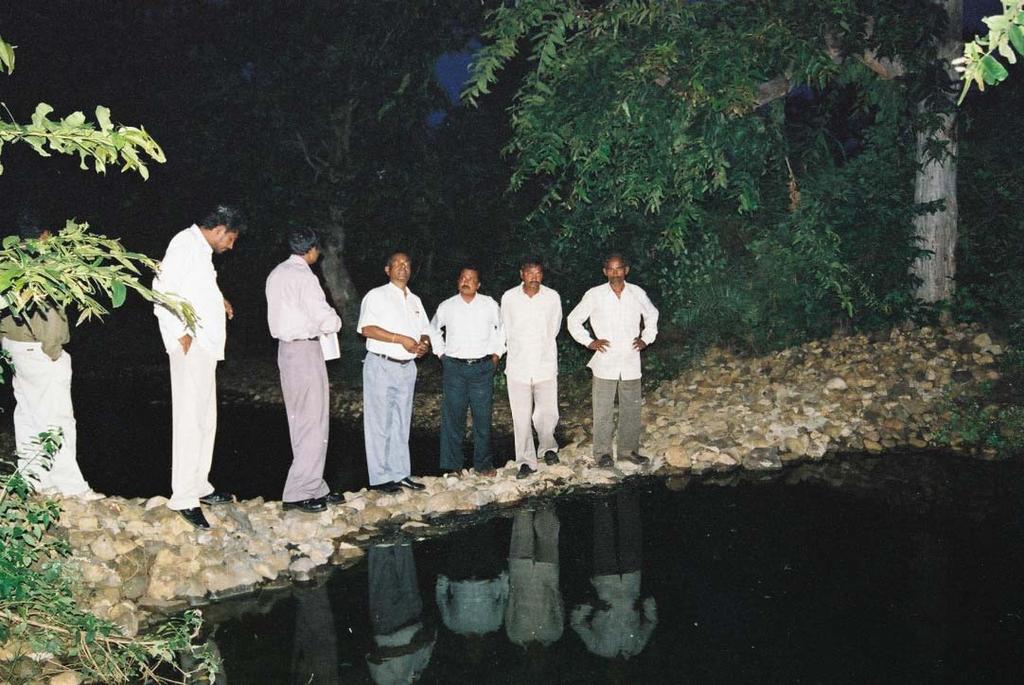
25 Water Users Groups
26 CONCLUSION Rejuvenation of percolation tanks and construction of modified gabion structure in the drain line improved water level in the wells, perenniality and water yield of wells Water harvesting in recharge pond/farm pond and reuse as protective irrigation to cotton improved the productivity, profitability and WUE Due to water harvesting structures, the flooding effect of downstream farmers field reduced during heavy spells of rainfall. These farmers reported higher production. Area under irrigation increased by 40 percent in the watershed Due to increased water resources farmers have assured rabi crops and diversified crops
27 The amount (Rs.10,000/-) used to spend on deepening of wells in the summer to get more water has been saved by the farmers in the influence zone Due to increased cropping intensity and assured crops, the cash flow has been increased, which can be measured in terms of assets and infrastructure acquired by the farmers of influence zone. Now, farmers themselves guard the structures by contributing physical labour (Water Users Group). It shows the importance of water conservation measures in improving the livelihood of farmers
28 Lessons learnt Use of scientific instruments-stage level recorder, rainguage etc. Training of local people in measurements and skills Use of ITK structure/ materials with scientific basis
29