Climate Smart Agriculture for Smallholder Farmers in Malawi 2013 Baseline Survey FINAL DRAFT. Submitted By: Chisomo Kamchacha Molly Cheatum
|
|
|
- Jody Peters
- 5 years ago
- Views:
Transcription
1 Climate Smart Agriculture for Smallholder Farmers in Malawi 2013 Baseline Survey FINAL DRAFT Submitted By: Chisomo Kamchacha Molly Cheatum September 2015
2 TABLE OF CONTENTS 1. EXECUTIVE SUMMARY 3 2. INTRODUCTION PROGRESS OUT OF POVERTY INDEX LIVELIHOOD DATA PERCEPTIONS OF WELLBEING AND CLIMATE PREPAREDNESS HOUSEHOLD DIET DIVERSITY, FOOD PRODUCTION AND SECURITY AGRICULTURAL PRACTICES CONCLUSION.47 APPENDIX A: CSA BASELINE SURVEY..49 2
3 1. EXECUTIVE SUMMARY This baseline survey was implemented with farmers in December Unfortunately, through a series of issues including poor management of the collected data, poor write-up, and limited funds this report has been delayed for 18 months. The data is now finalized and presented in the following report. Two more follow-up surveys are expected in December 2015 and June 2016 to determine if the Climate Smart Agriculture (CSA) techniques Kusamala is using with farmers is positively impacting the communities. The data will also inform future interactions with the communities. The following data provides a brief story of the issues and challenges the communities face within the project catchment area. According to the international 2005 purchase-power parity poverty line, 47.4% of the farmers within the project catchment area are earning below $1.25/day and 83% are earning below $2.50/day. 85 % reported that their income rarely or never meets their basic needs. Over 75% of the respondents reported poor quality soil. 91% of the respondents stated that their harvest quality and quantity was unsatisfactory or only fairly satisfactory. The top five threats to farmers were high fertilizer prices (94%), changes in rainfall patterns (88%), high seed prices (85%), lack of markets (69%), and soil infertility (61%). In response to how prepared farmers were to face extreme climate events 94% reported that they were either not prepared or somewhat prepared. 52% of the respondents were either sometimes, often, or always worried about running out of food before the next harvest. Comparing World Bank s 2013 measurement of cereal yield (kg per hectare) with the findings of the CSA baseline survey (2013) farmers are producing 16 bags of maize compared with 27 bags of maize, 40% less (kg per hectare) than the world average. Most of the farmers sold tobacco (65%) followed by ground-nuts (45%) Hybrid maize (25%) and local maize (20%). Farm Input Subsidy Program - 44% of the farmers used a coupon to purchase fertilizer or seed last year, while 56% did not. The top 3 ways farmers get extension messages are through radio, government extension officers, and extension service from farmer associations and clubs. 3
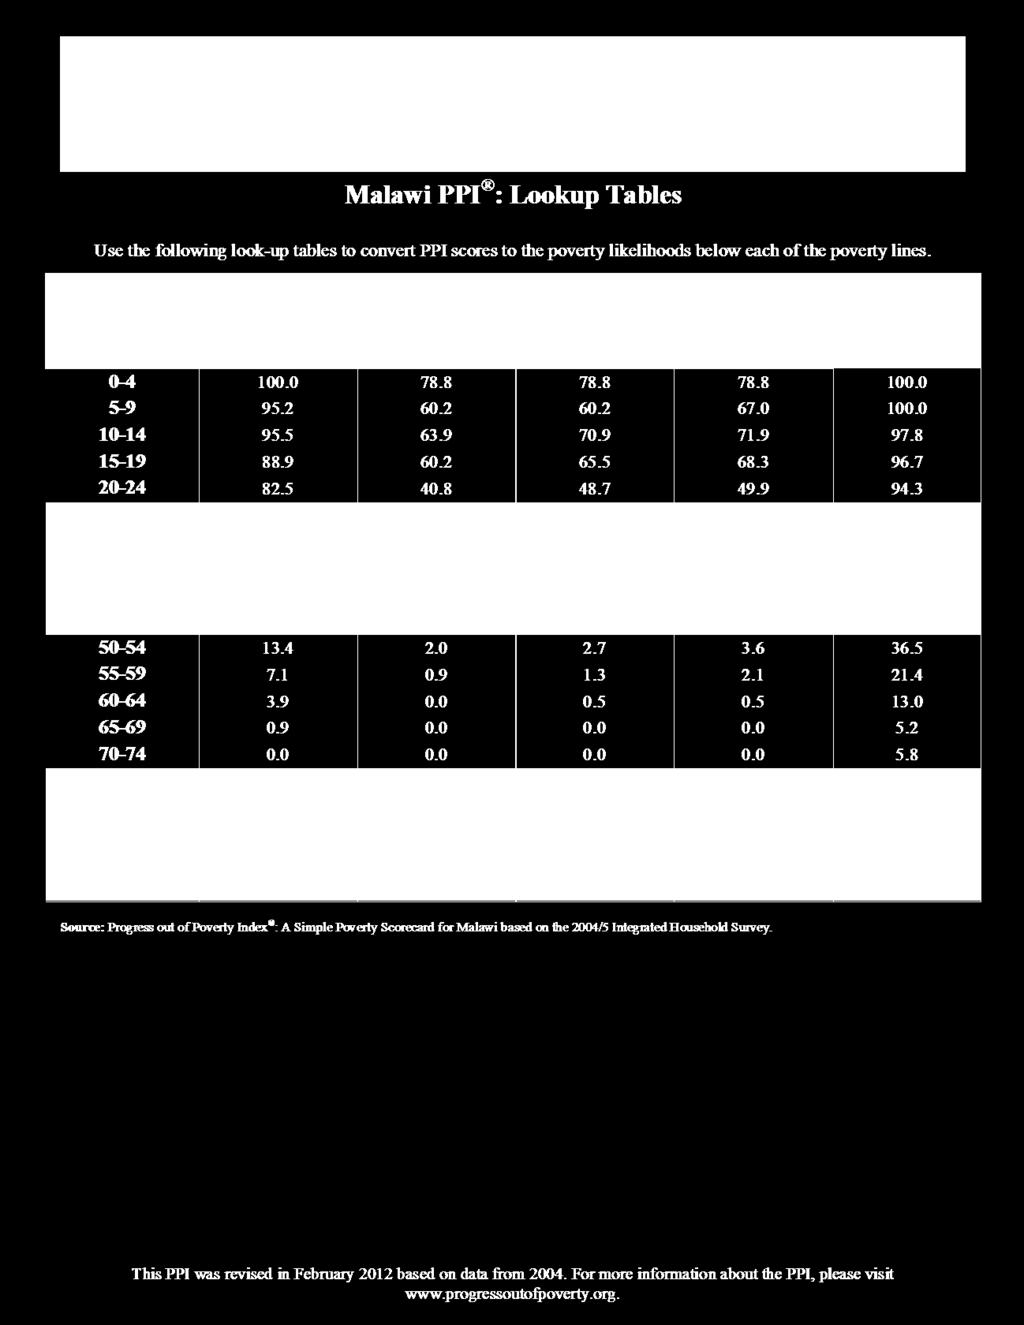
4 2. INTRODUCTION In 2013, the Scottish Government approved the Climate Smart Agriculture for smallholder farmers in Malawi project. This project was awarded to 3 partners the James Hutton Institute tasked with overseeing the overall project; Climate Futures tasked with building the communication capacity of the partner organization in Malawi and implementing the participatory video monitoring and evaluation output; and Kusamala Institute of Agriculture and Ecology tasked with implementation of climate smart agriculture practices on-the-ground with 1500 farmers in Dowa District. In December 2013, 374 farmers were surveyed in the project catchment area to establish a baseline for livelihoods; perceptions of well-being and climate preparedness; household diet diversity, food production and security; and agricultural practices. This report analyzes the results and presents them in the subsequent four sections. 3. PROGRESS OUT OF POVERTY INDEX LIVELIHOOD DATA The purpose of this section is to determine how likely and how many of our farmers in the project catchment area are below the poverty line according to different definitions. There is no international consensus on guidelines for defining poverty, or which measurement is standard. Typically poverty is measured based on consumption and income. Although there are quite a few critiques on this standard (UNDP, 2006), because it fails to take into account the multidimensional forms of poverty including social, cultural, spiritual, and environmental wellbeing or illbeing, we have also chosen to measure poverty in economic terms. In this case, we chose to use the Grameen Bank s Progress out of Poverty Index (PPI) scorecard because it can be used to compare multiple measurements on consumption and income and its questions are designed specifically for Malawi. The Grameen Bank s PPI scorecard uses ten low-cost indicators from Malawi s 2004/5 and 2010/11 Integrated Household Survey to estimate the likelihood that a household has consumption below a given poverty line. The development of the PPI scorecard was in response to the often difficult and costly approach of measuring poverty when a rigorous analysis is not needed. Some local organizations need a quick analysis for making decisions on target areas and to monitor poverty over time. The PPI scorecard is simple, transparent, free and easy to implement in the field as it only has 10 weighted questions. A PPI scorecard is tallied for each farmer with a score range between 0 and 100. PPI Lookup Tables are provided for each poverty line and a below poverty likelihood percentage is captured for each farmer. These percentages are then averaged for the group and the percentage of farmers below a particular poverty line can be determined with relative accuracy (Schreiner, 2015). For this project, we surveyed farmers within the catchment area in 2013 before the 2015 revised PPI scorecard in Malawi was released. The 2004/5 PPI scorecard was used with the farmers and for the purposes of this report we have chosen to use the 2012 lookup tables and will do a follow-up measure with the new 2010/11 PPI scorecard and 2015 lookup tables in Please see Appendix A for the questionnaire and Appendix B for examples of the questions and lookup tables used in the PPI. 4
5 Three poverty lines were chosen in this analysis the National Statistics Office (NSO) of Malawi s national poverty line, the 2005 purchase parity power (PPP) $1.25/day, and the 2005 PPP $2.50/day. In Malawi, the National Statistics Office (NSO) implemented an Integrated Household Survey in 2004/5 and again in 2010/11. Through these surveys two poverty lines were established, a food poverty line and a national poverty line. The food poverty line measures the cost of 2,400 calories from a food basket containing essential foods and nutrients. The national poverty line, the one used in this study, measures household consumption of both food and non-foods (Schreiner, 2015). The PPP is the number of units of a country s currency required to buy the same amount of goods and services in the domestic market as a US dollar would buy in the United States. The poverty rate at $1.25 or $2.50/day is the proportion of the population living on less than this, measured at 2005 international prices, and adjusted for PPP. According to the 2004/5 PPI scorecards, 24.8% of the farmers within the project catchment area are below the National poverty line. According to the international 2005 purchase-power parity poverty line, 47.4% of the farmers within the project catchment area are earning below $1.25/day and 83% are earning below $2.50/day. Table 3.1:2004/5 Progress Out of Poverty Index Scorecard Results (Questions 7-16) Poverty Lines Malawi National (%) 2005 PPP $1.25/day (%) 2005 PPP $2.50/day (%) % of Farmers below Poverty Lines The overall demographics of the farmers surveyed are outlined below. Table 3.2: Demographics of Farmers Surveyed (Questions 1-6) Questions 1-6 Results 1. % of Farmers Surveyed Male 60% % of Farmers Survey Female 40% 2. Average age of Farmers surveyed % of Head of Households Male 86% % of Head of Households Female 14% 4. Average age of Head of Household Average No. of Men above 14 within Household 2 6. Average No. of Female above 14 within Household 3 4. PERCEPTIONS OF WELLBEING AND CLIMATE PREPAREDNESS The purpose of this section is to determine the perceived well-being of the farmers in the project catchment area. Questions on income, soils, quality and success of crops, threats to crops, preparedness for extreme climate events, and the cantril self-anchoring scale were all used to provide an overall picture of resources and threats to farmers livelihoods in the project area. This section will inform the project on what techniques and resources Kusamala has that can mitigate or improve wellbeing and climate preparedness. 5
6 Below are the results of the survey (Questions 17 27) 17. How often does your current income cover your basic needs (Food, clothing, shelter, school fees)? Over half the farmers in the project area reported that their current income never meets their basic needs and 85 percent reported that their income rarely or never meets their basic needs. In the graph below, the data is divided between female and male and depicts a similar proportion of female and male answering the question in the same manner. There is no difference in the ability of either gender to meet basic needs in the project area. Graph 4.1: Current Income Covers Basic Needs Always Never Often Rarely Sometimes Female Male 6
7 18. What other sources of income, monetary or otherwise do you have besides farming? Ganyu was the most common source of income besides farming with 59% and selling cash crops was the second most common source of income with 47%. Other common sources of income included selling food crops and other agricultural products. When asked to specify what kind of informal business farmers were conducting, most reported selling fish, vegetables, mandasi, or firewood. Graph 4.2: Other Sources of Income Sell food crops Sell cash crops (tobacco, cotton, tea) Sell other agricultural goods Sell livestock Ganyu Skilled trade Formal employment Informal business Yes No 19. How is the soil where you have your staple crops? Most farmers reported infertile soil with over 75% of the respondents reporting poor quality soil. Graph 4.3: Soil Quality Acceptable Fertile Unfertile 164 Female Male 7
8 20.and 21.How satisfied are you with the quality and quantity of your staple crop this year? Combining both male and female, 91% of the respondents stated that their harvest quality and quantity was unsatisfactory or only fairly satisfactory. Graph 4.4: Quality and Quantity of Staple Crops Number of farmers Female Male 0 Fairly Satisfied Satisfied Unsatisfied Level of satisfaction 22. Do you feel the amount of land you have is sufficient to meet your needs? Most farmers reported that their land was insufficient to meet their needs with over 75% of the respondents reporting the need for more land. Gender did not affect satisfaction of land size. Graph 4.5: Land Size Female Male No Yes 8
9 23. How successful will your farm be in the coming year? Only 9% of the farmers surveyed reported that their farm would be successful in the coming year. Gender did not affect the productivity or likelihood of a farm to be economically productive. Graph 4.6: Success of Farm Female Male Not Successful Somewhat Successful Successful 9
10 24. How serious are these threats to your farm? The top five threats to farmers were high fertilizer prices (94%), changes in rainfall patterns (88%), high seed prices (85%), lack of markets (69%), and soil infertility (61%). Pests and diseases, droughts, and floods all were reported as a threat by over half the respondents suggesting that climate related issues are a very serious concern for farmers in the area. Economic concerns are the top most priority with farmers reporting an inability to access fertilizers, seeds, and markets. In response to other, the most serious threat was theft of crops. Graph 4.7: Threats to Farm Not Serious Moderate Serious 10
11 25. How prepared do you feel to address the following threats: According to the respondents, droughts, changes in rainfall patterns, high fertilizer prices, lack of markets, and floods were the top five threats farmers were least prepared to address. Graph 4.8: Preparation for Threats to Farm Prepared Somewhat Prepared Not Prepared Not a Threat 26.How prepared do you feel to face extreme climate events? (Drought, flood, etc.) In response to how prepared farmers were to face extreme climate events 94% reported that they were either not prepared or somewhat prepared. Graph 4.9: Preparation for Extreme Climate Events Not Prepared at All Prepared Somewhat Prepared 65% 39% 26% 28% 2% 11% 4% 17% 6% Female Male Grand total 11
12 27. The Cantril Self-Anchoring Scale The Cantril Self-Anchoring Scale is designed for this project to assess if farmers viewpoints on their wellbeing has changed in conclusion of the project. The question asks the following: Please imagine a ladder with steps numbered from zero at the bottom to 10 at the top. The top of the ladder represents the best possible life for you and the bottom of the ladder represents the worst possible life for you. On which step of the ladder would you say you feel you stand at this time? Three quarters of the farmers surveyed reported to be on level 3 or below in their current state. Graph 4.10: Cantril Scale Current Female Male On which step do you think you will stand about five years from now? In 5 years time, most reported an increase from level 1 to a level 2 or 5. Graph 4.11: Cantril Scale in 5 Years Female Male
13 5. HOUSEHOLD DIET DIVERSITY, FOOD PRODUCTION AND SECURITY Dietary diversity as a measure of household food access and food consumption can be triangulated with other food-related information to contribute towards providing a holistic picture of the food and nutrition security status in a community or across a broader area. Looking at the percentage of households consuming individual food groups is one of the important analytical strategies. The Diet Diversity percent households consuming each food group is being used for an on-going monitoring. As part of the baseline survey, the sampled farmers were interviewed. It should be noted that these are farmers who have been practicing conventional agriculture the whole of their lives. The dietary recall was made based on three days (72 hours) and not the FAO s 24 hour Diet Diversity Recall. Mainly, the diet diversity recall was intended to measure household economic access to food (dietary energy). The survey included foods prepared in the home and consumed in the home or outside the home; or purchased or gathered outside and consumed in the home. The target was the household regardless of the fact that in some cases the respondent was not the person who prepared the food in all the three days under study. There were 17 food groups included in the Household Diet Diversity Survey. The dominantly consumed food groups were those of maize at 93% (both refined and unrefined), animal protein at 96% (Eggs, Fish, Meats, Chickens, Goat, Duck, Rabbit, Pork, Cow, Insects, Other), dark-green-leaf vegetables at 96% (Mustard greens, Pumpkin Greens, Rape, Amaranth, Bean Greens, Chinese Cabbage, Cassava Leaves, Sweet Potato Leaves, Other), and other vegetables at 86% (Tomato, Onion, Cabbage, Green Maize, Mushroom, Okra Pods). The rest of the other food groups include: Other starch staples at 35% (Rice, Wheat, Sorghum, Millet, Mandasi, Bread);white roots and tubersat 39% (White/Irish Potato, White Yam, White Cassava, White Sweet Potato, Chips); Vitamin A rich vegetables and tubersat 17.5% (Pumpkin, Orange Flesh Sweet Potato); Vitamin A rich fruitsat 45% (Ripe mango, Ripe Papaya, Tangerines); other fruits at 28% (Banana, Guava, Lemon, Avocado); Legumes, Nuts and Seedsat 77% (Legumes, Beans, Ground Nuts, Pigeon Peas, Soya, Other Nuts or Seeds); Milk and Milk products at 33%; Sweets at 48%,; Spices, Condiments and Beveragesat 25%; and Oils and Fats at 56%. Consumption of most of the food groups were not done independent of another. Some food groups where either prepared together, while some were eaten along with another food group. 13
14 28. Over the past 3 days, did any member of your household eat from the following groups of foods? And 29. Are these items your own production, purchased, or traded? Groups 1 and 2 - Maize (Refined and Unrefined) Table 5.1: Maize Consumption Graph 5.1: Maize Consumption Row Labels Count of Respondent Not eating Maize 56 Not eating unrefined 27 Yes eating unrefined 29 Yes eating Maize 316 Not eating unrefined 40 Yes eating unrefined 276 Grand Total 372 In terms of the maize consumption, the unrefined was the most common at 88% (n=305) followed by the refined at 12% (n=40).56 farmers reported that they had not eaten maize but in a follow up question, 29 appeared to have eaten unrefined maize. These results indicate that the majority of the farmers consume whole grain maize whichis moderately high in dietary fiber, which helps in the digestive system. However, 7% of the respondents reported to have not eaten maize. Table 5.1: Maize Sources (Refined and unrefined) Count of Respondent Column Labels Row Labels Female Male Grand Total Bartered 1 1 Bartered 1 1 Gift/Share Gift/Share 3 3 Own Production 2 2 Purchased 1 1 Own Production Bartered Gift/Share Own Production Purchased Purchased Bartered 1 1 Gift/Share 1 1 Own Production Purchased Grand Total
15 The farmers predominantly source the maize from their own production (81%), with 15% from purchasing, while bartering and gift/sharing were both at 2%. Disaggregating the data basing on refinement, as alluded above, only 12% had eaten refined maize while 88% had eaten unrefined. Of the 88% that had eaten unrefined; 74% had sourced it from their own production, 21% had purchased, while 2 and 3% was bartered and gift/shared respectively. Graph 5.2: General Maize Sources Graph 5.3: Unrefined Maize Sources Having a male dominated sample size of 374 farmers in total; 40% women (n=149) and 60% men (n=225), the results were inclined to be male dominated.the male respondents exceeded with 20% (n=76) more respondents than the female. Of the farmers that sourced the unrefined maize from their own production 57% were male and 43% were female. Of the farmer that purchase their unrefined maize 55% were male and 44 % were female. Given the 20% difference, the female farmer could takeequal charge in both major food source of own production, and purchasing. Group 3 - Rice, Wheat, Sorghum, Millet, Mandasi, Bread Asked whether they had eaten anything from this group in the past three days, 35% (n=131) of the farmers reported to have eaten something from the group. In a follow up question, checking whether the farmers also had maize (refine/unrefined), the results indicated that all 131 farmers had also eaten maize. From the 29 farmers that were discovered to have eaten unrefined maize from the 56 farmer that report the have not eaten maize in Table:1 above, 3 of them had eaten from the group of Other Starch Staples, while 3 of the 56 whom did not eat maize only ate from the Other Starch Staple representing 1%. 15
16 Graph 5.4: Other Starch Staples Graph 5.5: Source of Other Starch Staples Table 5.2: Other Starch Staples and Maize Row Labels Count of Respondent No Maize 56 No Maize- Unrefined 27 No (Rice, Wheat, Sorghum, Millet, Mandasi, Bread) 24 Yes (Rice, Wheat, Sorghum, Millet, Mandasi, Bread) 3 Yes (Maize - Unrefined) 29 No (Rice, Wheat, Sorghum, Millet, Mandasi, Bread) 26 Yes (Rice, Wheat, Sorghum, Millet, Mandasi, Bread) 3 Yes 315 No Maize- Unrefined 40 No (Rice, Wheat, Sorghum, Millet, Mandasi, Bread) 29 Yes (Rice, Wheat, Sorghum, Millet, Mandasi, Bread) 11 Yes (Maize - Unrefined) 275 No (Rice, Wheat, Sorghum, Millet, Mandasi, Bread) 158 Yes (Rice, Wheat, Sorghum, Millet, Mandasi, Bread) 117 Grand Total 371 Purchasing was the major source of Other Starch Staples at 86% (n=123), of which 61% were male farmers and 39% were female farmers. 7% representing 10 farmers sourced other starch staples from their own production, while 3% Bartered other commodities for other starch staple, and 3% of the farmers got other starch staples through gifts/shared. Group 4 - White Roots and Tubers (White/Irish Potato, White Yam, White Cassava, White Sweet Potato, Chips) The majority of the respondents did not eat any white roots and tubers at 61% (n=226). Only 39% (n=145) ate from the group. 98% (n=142) ate maize and white roots and tubers, of which the majority (n=129) ate unrefined. Of the farmers that ate from this group, only 2% (n=3) stayed without eating maize completely. Of the 226 farmers (representing 61%) that did not eat from this group, 24 did not eat maize, while 202 farmers ate maize. In terms of refinement, of the 202 farmers that ate maize but did not eat anything from this group, 86% (n=175) of them ate unrefined maize while 13% (n=27) ate refined. 16
17 Graph 5.6: Consumption of White Roots and Tubers Graph 5.7: Source of White Roots and Tubers The white roots and tubers were sourced mostly through purchasing at 80%. Only 15% of the farmers that ate from this group sourced it from their own production. 0.6% was received as a gift/shared, while 3% sourced it through bartering. The table below shows the numerical values of the percentages above. Table 5.3: Count of White Roots and Tuber Sources Count of Respondent Column Labels Row Labels Female Male Grand Total Bartered Gift/Share 1 1 Own Production Purchased Grand Total Group 5 - Vitamin A rich vegetables and tubers (Pumpkin, Orange Flesh Sweet Potato) Since the survey was conducted in December of 2013, not many farmers had access to pumpkins at this time of the year, and only a few who grew sweet potato in the dimba (riverine) gardens had access to the orange flesh sweet potato. Only 18% (n=66) of the farmers had had orange flesh sweet potato against 82% (n=305) who had not had. Running the consumers of Vitamin A rich vegetable and tubers through the maize consumer, the results indicated that 98% of the 66 farmers had eaten maize too. Only 2% did not eat maize. 17


18 Graph 5.8: Consumption of Vit A rich Veg and Tubers Graph 5.9: Sources of Vit A rich Veg and Tubers Due to the season in which the survey was conducted, the majority of the farmers who ate the Vitamin A rich vegetables and tubers were those who produced it at 53%, closely trended by purchasing at 41%. A very few farmers at 5% accessed it through gift/shared. Analysis by gender indicated that 50% of the male and 50% of the female farmers sourced it from their own production. However, the purchases were higher on the male side compared to the females at 68% and 32% respectively. Group 6 and 7 - Vegetables During the dietary recall, the vegetable group was split into two: the first being the dark-green leafy vegetables which included Mustard greens, Pumpkin Greens, Rape, Amaranth, Bean Greens, Chinese Cabbage, Cassava Leaves, Sweet Potato Leaves and others; and the second group was other vegetables which included; Tomato, Onion, Cabbage, Green Maize, Mushroom, Okra Pods. 96% of the respondents had reported to have eaten from the dark-green leafy vegetable group while 3% reported to have not eaten from this group. From the other vegetables group, 86% reported to have eaten from it, while 14% declined eating anything from the group. Graph 5.10: General consumption of vegetables 18

19 Table 5.4: Vegetable consumption Count of Respondent Dark-Green Leafy Vegetables Other Vegetables No Yes Grand Total No Yes Grand Total The table above show how many farmers ate from which vegetable groups. 2% of the respondents did not eat from either the dark-green leafy vegetables, or from the other vegetables. 12% ate from the dark-green leafy vegetables but did not eat from the other vegetable group. 1% of the respondents ate from the other vegetable group but did not eat from the dark-green leafy vegetable. The majority however, ate from both groups. 84% of the farmer ate from the dark-green leafy vegetables and the other vegetable group. Apart from the cabbage, green maize, mushroom, and okra pods; tomatoes and onions are usually used as ingredients when preparing most of the dishes in both vegetable groups. Graph 5.11: Dark-Green Leafy Vegetable Sources Graph 5.12: Other Vegetable Sources During the rainy season, the fields look green and many plants (both edible and non-edible) will have grown. Farmers have access to diverse kinds of vegetables of which some they might have planted, whereas others just grow naturally around their homes, in dimba gardens, staple fields and in the wild. As of the dark-green leafy vegetables, the results of the survey indicated that the majority at 50% (n=179), sourced their vegetables from their own production, followed by purchasing at 45% (n=160), and then 4% (n=15) who sourced their vegetables through gifts/shared. Only one farmer sourced the vegetables through bartering. Compared to the dark-green leafy vegetables, the other vegetables were mostly sourced through purchasing. 71% of the respondents purchased the vegetables in this group against 23%, 4% and 2% 19

20 who sourced through own production, gift/sharing and bartering respectively. Tomatoes, onions, and cabbages struggle to grown in the month of December. To successfully produce these vegetable, it requires heavy input investments which many farmers do not afford. Additionally, the dimba gardens are flooded with rain water at this time hence producing vegetables in those areas is almost impossible. Mushroom production is not commonly done at household level in Dowa district. Furthermore, the area only has a few patches of forests of which their ability to produce wild mushrooms is very doubtful. This underscores the high dependency on markets for the other vegetables in this season compared to the dark-green leafy vegetables. Group 8 and 9 Fruits The fruits were in two categories: Vitamin A rich fruits at 45% (Ripe mango, Ripe Papaya, Tangerines); other fruits at 72% (Banana, Guava, Lemon, and Avocado). On average, 58% of the farmers had consumed some fruits from the two groups. In terms of sourcing: beginning with the Vitamin A rich fruits; 76% were sourced through purchasing, 16% through their own production, 6% through gift/shared, and finally 1% through bartering. In terms of the other fruits; 68% was sourced through purchasing, 23% through their own production, 6% through gift/shared, and finally, 2% through bartering. On average, 72% of the respondents sourced their fruits through purchasing. The average of the own production source of fruits was 19.5%, significantly lower than the purchasing source. Graph 5.13: Source of Vitamin A rich Fruits Graph 5.14: Source of Other Fruits Group 10, 11, and 12 Animal Protein (Eggs, Fish, Meats, Chickens, Goat, Duck, Rabbit, Pork, Cow, Insects, Other) The animal protein group included eggs and fish, as well as both flesh and organ meat of; cow, goat, chicken, duck, pork, rabbit, insects, and others. 51% (n=190) of the farmers reported to have not eaten flesh and organ meat, against 49% (n=184) that ate from this group. 37% (n=138) of the respondents reported to have eaten eggs while 63% (n=236) declined eating eggs. Regarding fish 46% (n=171) 20

21 reported to have eaten fish, while 54% (n=203) declined eating fish three days before the survey. The results of the survey shows that the most consumed animal proteins are those from the flesh and organ meat group compared to eggs and fish. It is then followed by fish, and finally eggs which are the list consumed. On average, consumption of animal protein was at 44%. Comparing flesh and organ meat against fish and eggs; of the 190 respondents (51%) that reported not eating meat, 155 respondents (81%) admitted not eating eggs also against 120 (63%) that reported not eating fish. Only 35 (18%) respondents of those eating meat are also eating eggs against 70 (38%) of the 190 that were also eating fish. These results imply that the majority of the farmers that have less access to meat largely depend on fish than they depend on eggs. Furthermore, of those that reported to have eaten flesh and organ meat at 49% (n=184), 103 (56%) respondents were also eating eggs; exceeding 101 (55%) respondents that were also eating fish with a difference of 1%. 81 (44%) farmers were not eating eggs against 83 (45%) that were not eating fish. Amongst the famers that consumed flesh and organ meat, consumption of eggs is higher than consumption of fish. Graph 5.15: Consumption of Animal Protein In a separate analysis, comparing consumption of fish and eggs, the percentages of the farmers that reported to have eaten eggs and fish were lower than those that had not eaten. Worse still, of the 203 respondents that had not eaten fish, a larger percentage 78% (n=159) had not eaten eggs neither, with only 22% (n=44) respondents reporting to have eaten eggs. Of the 171 respondents that had reported eating fish, only 45% (n=77) participants reported to have not eaten eggs, slightly lower than 55% (n=94) whom had reported to have eaten both fish and eggs. Likewise, of the 236 respondents that had not eaten eggs, a larger population at 67% (n=159) had not eaten fish, about double the number of those that had eaten fish at 33% (n=77). 32% (n=44) of the 138 farmers that had eaten eggs did not eaten fish neither, which is less than half of those that ate both eggs and fish at 68% (n=94). Table 6 below shows sources of animal protein. Ranging from bartering, gifts/sharing, purchasing and own production, sources of food vary from farmer to farmer. On average; purchasing, at 64.6% is the highest source of animal protein, followed by own production at 26.6%, Gift/sharing at 4%, and finally 21
22 bartering at 3%. As of the organ meat, 61% was sourced through purchasing, 28% through their own production, 6% through their gift/sharing, and finally 3% through bartering. In terms of the eggs; 56% sourced eggs through purchasing, 35% through their own production, 3% through gift/shared and finally 5% through bartering. Regarding the fish; 77% sourced it through purchasing, 17% through their own production, 3% was found through gifts/sharing, and 2% was obtained through bartering. Small as the bartering is, it is interesting that it is the only food source in which the female gender dominates over the male gender. Apart from the gift/shared, bartering is the only food source that does not directly require money to source the food. Both own production, and purchasing have a direct link to money. Bartering and gift/sharing are based on social relations in the community. Table 5.5: Animal Protein Sources A n i m a l P r o t e i n S o u r c e s Column Lables Count of Respondents Flesh and organ meat sources Female Male Grand Total Bartered Gift/shared Own production Purchased Grand Total Fish Sources Female Male Grand Total Bartered Gift/shared Own production Purchased Grand Total Egg Sources Female Male Grand Total Bartered Gift/shared Own production Purchased Grand Total Group 12 Legumes, Nuts, and Seeds (Beans, Ground nuts, Pigeon peas, Soya, Other Nuts and Seeds Asked on whether they had eaten any legumes, nuts and seeds, 78% of the farmers admitted to have eaten legumes, nuts and seeds while 22% declined. The majority of those that responded that they had eaten from this group at 62% were male and the female were at 38%. Of those that declined eating from this group, the male were at 54% while the female were at 46%. The results indicated that the legumes are the highest protein contributor to the diets of the communities as it exceeds the average of all animal protein at 44%. 22


23 Pie Chart 5.1: Consumption of Legumes Pie Chart 5.2: Legumes, and Flesh and Organ Meat However, running the legumes, nuts and seeds side by side with Flesh and organ meat, Eggs, and Fish the survey results indicated that: 44% of the farmers had eaten both legumes, nuts and seeds, and flesh organ meat. 34% admitted to have had legumes, nuts and seeds but did not have any meat. 6% reported to have not eaten any legumes but ate meat and finally, 16% reported to have not eaten neither legumes nor flesh and organ meat. Regarding the eggs; 40% declined eating any legumes, nuts and seeds, and eggs. 29% accepted to have eaten legumes, nuts and seeds, but not eggs, followed by 21% who reported to have eaten legumes, nuts and seeds, and eggs. Finally, 10% ate no legumes but eggs. Comparing the legume group with consumption of fish; 33% of the respondents report to have not eaten any fish and also ate nothing from the legume group.17% reported not eating legumes but fish, 25% said yes to legumes but fish, and finally 25% said yes to both legumes and fish. Pie Chart 5.3: Consumption of Legume and Eggs Pie Chart 5.4: Consumption of Legumes and Fish More farmers ate legumes, and flesh and organ meat, than they ate legumes together with fish, and legumes together with eggs. The number of farmers eating legumes, nuts and seeds independent of flesh and organ meat was also higher than legumes, nuts and seeds independent of eggs, followed by legumes, nuts and seeds independent of fish. More farmers reported to be eating fish independent of legumes, nuts and seeds over those eating eggs without legumes. The least were those eating flesh and organ meat independent of legumes, nuts and seeds. The population was higher amongst farmers that 23
24 did not eat legumes, nuts and seeds together with eggs, followed by those that did not eat legumes, nuts and seeds together with fish, and finally those that did not eat from the legume group and the flesh, and organ meat group. Graph 5.16: Sources of Legumes, Nuts and Seeds At 67%, the majority of the farmers sourced their legumes, nuts and seeds from their own production. A quarter of them, at 25% sourced through purchasing, while 6% sourced it through gift/share, and least of the sources being bartering at 1%. Legumes, nuts and seeds are the only protein source where own production exceeds purchasing. This makes legumes, nuts and seeds the most reliable source of protein in the community. Group 14 Milk and mild products Consumption of milk was lower amongst the participants, as 67% (n=250) reported that they had not taken any milk or milk products. Only 33% of the participants had taken milk or milk products. The low milk intake can be directly linked to source of milk and the economic status of the communities. Off the 33% that had taken milk, 85% of them accessed it through purchasing. 10% sourced it from their own production, 4% was a gift/share, and 0.8 was bartered. Group 15 Oil and Fats The results of the survey indicated that 56% of the farmers consumed fats and oils, while 44% did not. Disaggregating the results by gender, the results indicated that of the men that were in the study, 63% of them consumed oils and fats while 57% of the men did not. Of the women, only 37% consumed oils and fats, while 43% did not. Comparing the men against themselves, more men had taken oils and fats than those that did not. As of the women, fewer women took oils and fats, while more women did not. The results shows how the fats and oils were sourced, which indicates that 91% was sourced through purchases, and only 6% was through their own production, 2% was a gift/shared and finally 0.4% was through bartering. Due to the economic costs of oils and fats, more male respondents accessed oils and fats than women; and the number of men that consumed oils and fats was higher than that of those 24
 compared to the females at 40% (n=76).")
25 that did not consume, while the number of women that consumed oils and fats was lower than that of those that did not. Group 16 - Sugar There were very minor differences in the consumption of sugar. Higher amongst the male respondents at 60% (n=117) compared to the females at 40% (n=76). Equally, the females that did not consume sugar were at 40% (n=73) while the males that did not consume from this group were at 60% (n=107). In total, only 48% had consumed sugar against 52% that had not. Graph 5.17: Consumption of Sugar Table 5.6: Source of Sugar Count of Respondent Column Labels Row Labels Female Male Grand Total Grand Total The major source of the sugar was purchasing. Some farmers reported to be producing the sugar by themselves, which poses the question; in what form did they consume the sugar? Possibly, they had had the actual sugar canes. A few were bartering, and sharing as gifts. Group 17 Spices, Condiments and Beverages Bartered 2 2 Gift/Share Own Production Purchased This is the least consumed group of all. Only 25% of the farmers in the survey ate from this group, 66% being the male and 34% being female respondents. 87% of the food was sourced through purchasing, 5% through their own production, 6% through gift/shared and finally, 1% which was sourced through bartering. 30. Did you or anyone in your household eat anything (meal or snack) OUTSIDE the home? Whilst it is not easy to capture an accurate perception of food eaten outside the home at household level, the survey still inquired. The results are a representative of the respondents knowledge of their households consumption of food outside the home. This may not show the frequency of purchasing and consuming food outside the home at household level, but will portray a picture of how frequent the practice is in the area. Being a baseline survey, the results establish a platform for which the follow up survey can be very precise. Knowledge of whether eating outside the home is a common practice is vital for deciding whether the questionnaire should be administered at individual level or household level. 25
26 Table 5.7: Food taken outside the home Count of Respondent Column Labels Row Labels Female Male Grand Total No Yes Grand Total The results of the survey shows that 58% (n=205) had eaten a meal or snack outside the home. 41% (n=145) did not eat anything outside the home. Comparing the males against themselves, 62% declined eating outside the home, while 58% accepted that they had eaten outside the home. Of the females, 42% accepted, while 38% declined. The females that said yes to eating outside the homes were more than those that said no. While the males that said yes were less than the males that said no. 31. How often have you worried that you might run out of food before you get other food? The study also sought to understand household food security. In this case, it assessed the anxiety or perceptions that the household food budget or food supply was inadequate. The statistics below shows how the farmers fared after being asked how often they have worried about running out of food before finding more. Table 5.8: Running-out before finding more food Count of Respondent Column Labels Female Female (HH Head Sex) Male (HH Head Sex) Female Total Male Female (HH Head Sex) Male (HH Head Sex) Male Total Grand Total Row Labels Always Never Often Rarely Sometimes Grand Total Only 34% of the respondents reported to never worry about running out of food before finding more food. The rest had some anxiety of some sort. Some only worried sometimes at 15%, while others rarely worried at 13%, and some often worried at 21%, and the worst case being always worrying at 16%. 26

27 Graph 5.15: Running-out before finding more food Except for Always males were reported higher in all options than females. The statistics above shows that more households are male headed which could be the reason why they worry more than their female counterparts on the running-out of food. 32. How often have you felt that you are not preparing enough food to feed your family? This was meant to establish the reported incidences of reduced food intake. The results of the study revealed that only 13% of the respondents never worry, or never felt not preparing enough food to feed their families. The rest of the respondents had some form of anxiety whether often, always, rarely, and sometimes. Often, at 28% is the highest level of anxiety, followed by sometime at 21%, then always at 20%, and finally rarely at 17%. Table 5.9: Not preparing enough food to feed the family Count of Respondent Column Labels Female Female (HH-Head Sex) Male(HH-Head Sex) Female Total Male Female(HH-Head Sex) Male(HH-Head Sex) Male Total Grand Total Row Labels Always Never Often Rarely Sometimes Grand Total As eluded above, the respondents were predominantly male and the households are also predominantly male headed. However, the results of the survey indicated that the household heads were cognizant of the fact that their households are not preparing enough foods due to inadequate supplies. 27
28 Graph 5.16: Not preparing enough food 33. How often have you spent the whole day without eating? Staying whole day without food is the most severe category of food insecurity in the household food security measure. By asking this question, the survey intended to reveal the number of farmers that are on the furthest end of food insecurity. Most of the farmers reported that they never stay whole day without food (34%). Then on 21% of the farmers reported that they often stay all day without food, followed by 16% who always stay whole day without food, 15% indicated that they sometimes stay whole day without food, and finally 13% said they rarely stay all day without food. Graph 5.17: Whole day without food Much as 34% seemed to be the most preferred option of the series in the graph, it does not imply that the majority of the farmers are eating every day. The largest percentage is spread amongst always, often, rarely and sometimes staying whole day without food. This implies that once in a while these families stay all day without food. 16% reported that they are always staying without food. The meaning of food may have a significant impact on response provided by this group. While 28
29 snacking,and staple other than nsima are less considered as food, the respondents may have reported not eating whole day whilst referring to nsima. 34. How often in the last year has your household not been able to eat what you are used to? Looking at both quantity and quality, 24% of the respondents always failed to eat what they were used to. A slightly higher percentage (25%) was that of those that reported that they often failed to eat what they were used to. 20% reported that this situation happens sometimes, 15% said it rarely happens, and 14% reported that it never happens. On average, 55% of the respondents were able to eat from all the good groups in the dietary recall. Whilst it is appreciated that diets change from time to time, and a one time-off dietary recall does not fully capture the exact picture of a household s daily diet, it still portrays a picture of what is being consumed more frequently. However, if the dietary recall represents what they are used to eating, then only 14% had never failed to eat what they were used to eating. 35. What was your household eating instead? Upon establishing the situation above, the study went further to find out that the copping mechanisms were. The table 11 below shows the different copping mechanisms used by the farmers whenever they were experiencing any food problems. The table shows the different mechanisms in a descending order. It starts with the most opted mechanism to the least. Table 5.10: Coping mechanisms DIET OPTIONS Yes No Yes (n) No (n) Work for food 56% 40% Cash for work 49% 48% Begged for food from other people 44% 52% Shifted to cheaper food 42% 55% Didn't eat nsima 32% 65% Ate less Staples 31% 65% Skipped meals 25% 72% Combined with cheaper food 22% 74% Didn't eat ndiwo 17% 80% Combined with wild food 8% 88% Shifted to wild food 7% 90% Food aid from Government 2% 94% Food aid from NGO 2% 94% Food aid from religious organization 0.8% 96% Other copping mechanisms not listed above included; other businesses, and exchanging tobacco for food. 29

30 36. In what month did you run out of your farm food after the 2012 harvest? Usually, farmers run out of their harvest 6 months after harvest. Against this background, a count of how many farmers ran out of food during the months of June, November 2013 it indicated that 196 farmers, representing 53% had ran-out. 47% still had their food after the usual 6 months after harvest time frame. January and February are considered the hunger season in Malawi. Only 37% of the respondents had food during this season. 12 farmers, representing 3% still had their maize until the next harvest in May, The survey indicated that the respondents ran out of their harvest at different times of the years and the table below show the different times in which they ran out of food. Table 5.11: Count of run-out months Graph 5.18: Run-out months Count of Respondent Column Labels Row Labels Female Male Grand Total January February March April May June July August September October November December Grand Total Have you run out of your farm food from the 2013 harvest? From the 2013 harvest, 62% of the farmers had already run out of their harvest 6 month after. The survey was conducted in December of 2013 but by this time, only 38% still had food from their last harvest. Comparing the 2012 and 2013 harvests, there is an increase in the number of people that ran out of their harvest in the later year. From 196 farmers to 218 farmers, with a 6% (n=22) increment, the trend can be devastating if it continues. Graph 5.22: 2013 Harvest Run out 30
31 38. If no, in what month do you think you will run out of your farm food from the 2013 harvest? This question is a follow up of the previous (Have you run-out of your 2013 harvest?). The table below answers the question when do you expect to run out of your 2013 harvest. However, it also isolates the farmers that had indicated that they have run out of their harvest but still indicated a projection of when they anticipate running out of their harvest. The first column indicates the months in which they anticipate their food to run out; the column labeled YES, indicates the farmers that had reported to have already ran out of their harvest in the previous question; and the column labeled NO indicates farmers that reported to still have their harvest, whom are very important regarding this question. Those that had reported to have run out were subtracted from the total so as to only have farmers that still have some of their harvest. Table 5.2: When Harvest is expected to run out Graph 5.19: When Harvest is expected to run out Count of Respondent Column Labels Row Labels No Yes Grand Total January February March April May 6 6 June July August 8 8 September October November December Grand Total
32 6. AGRICULTURAL PRACTICES The survey also inquired about which climate smart agriculture techniques the farmers are implementing on their farms. 39. In this past year, have you implemented any of the following practices? The table below shows how many people reported to be practicing a particular agriculture activity and the percentage. In the table, the results have been presented in a descending order in terms of the farmers that reported to have carried out the stated activity. Of the techniques listed in the table, the 5 most common are crop rotation, seed saving, intercropping, making and using compost manure, and No burning (keeping crop residues). Crop rotation is practiced by over half of the respondents. The least used techniques included; grey water harvesting, permanent beds, contour planting, rain water catchment, and mulching. Grey water harvesting was the least of all the practices. Only 6% (n=24) of the respondents were practicing grey water harvesting. 7% (n=27) of the respondents were using permanent beds. Contour planting was at 11% (n=41), while rain water catchment and mulching were both 16% (n=60) and (n=61) respectively. Table 6.1: Agricultural Practices Percentage Statistics No Yes No Yes Crop rotation Seed saving Intercropping Making and using compost No burning (keeping crop residues) Small scale irrigation All year round cropping Animal manure Agroforestry Swales Green manure Planting food trees Mulching Rain water catchment Contour planting Permanent Beds Grey water harvesting

33 40, 41, and 42.What crops did you grow this past year in your staple field, dimba, and around your home? Maize Table 16 below show the crops grown in the year 2012/2013 growing season, regardless of quantities. Maize remains the most grown crop amongst the farmers in the staple field. The popularly grown variety is the local maize variety (n=279), followed by the hybrid maize (n=192). However, 102 farmers (27%) grew both local and hybrid varieties. Further queries indicate that; 47% (n=177) of the farmers that participated in the survey only grew local maize. Those only growing hybrid maize were at 24% (n=90). In the wetland garden (Dimba), the majority of the farmers (n=167) grew hybrid maize than the local variety (n=123). However, comparing the farmers that grew the maize in the Dimba and those that did not, it was revealed that more farmers did not grow maize in the Dimba. 205 farmers reported that they did not grow the hybrid maize, and 250 reported that they did not grow the local maize. Around the homes, only a few farmers grow maize. However, of those that grow maize around the homes, more (46) grow the local variety, while 38 grow the hybrid maize variety. Regardless of the fact that more farmers grow the local variety, most of what is sold is the hybrid variety. There could be an overlap for farmers growing both local and hybrid, that most farmers keep their local variety for consumption and sell the hybrid maize variety. The statistics in the table below indicates that 25% (n=92) out of 373 farmers sold their hybrid maize, while 20% (n=75) of the 374 farmers sold their local maize. This could be attributed to the empirical evidence that local maize testes better than hybrid, or its storability and viability for seed in the next season that people prefer to keep the local variety. Pie Chart 6.1: Genetic Diversity Graph 6.1: Maize Varieties 33
34 Legumes This category includes; beans, ground nuts, pigeon peas, cow peas, and soya. The analyses were done on the percentage of the farmers who grew a particular crop of the legumes listed above, and a count of farmers that grew the different species together. The results of the study were as follows: Beans were reported as the most popular legume. 81% of the farmers reported to have grown beans in the previous year, while 19% declined growing beans. This is followed by ground nuts which were grown by 72% of the farmers against 28% who reported not growing. Groundnuts are followed by cow peas and soya at 58% and 57% respectively. The least on the list is pigeon peas at 4%. Analyses were also done on legume species diversity and the results were as follows: Farmers growing beans alone were at 53%. For those growing both beans and groundnuts were at 43%. Farmers growing groundnuts, beans, and pigeon peas were at 2%. 1% of the farmers had diversified groundnuts, pigeon peas, cow peas and beans. The more diverse group at 1% was that of farmers who grew, beans, groundnuts, pigeon peas, cow peas, and soya. Pie chart:3 below show the results. In the Dimba garden, production of legumes was very low, at an average of 12%. The most grown crop of the legumes in the dimba garden was beans at 41%. In home gardens, the most grown legume was beans. This was grown by 13% of the farmers. The rest of the legumes were grown by 5% of the farmers but pigeon peas which were grown by 1% of the farmers. 34
35 Table 6.2: Crops Grown in 2012/2013 Staple field Wetland Garden (Dimba) Home Garden Which crops did you sale Hybrid Maize Local Maize Beans Ground nuts Pigeon peas Tobacco Cow peas Sweet potato Irish potato Soya Cassava Sorghum Millet Rice Moringa Okra Pumpkin Mustard YES No YES No YES No YES No Rape Amaranth Chinese cabbage Black Jack Cabbage Tomato Onion Carrot Guava Manago Banana Rosella Lemon grass Avocado Citrus Mulberry Papaya Sugar cane Graph 6.2: Legumes Grown in percentage Pie Chart 6.2: Legume Specie Diversity Legumes grown in 2012/13 No Yes 2% 1% 1% Legume Specie Diversity Beans Soya 42% 57% Beans + G/nuts Cow peas Pigeon Peas G/Nuts Beans 4% 19% 28% 42% 58% 72% 81% 96% 43% 53% Beans + G/nuts + Pigeon Peas Beans + G/nuts + Pigeon P + Cow Peas Beans + G/nuts + Pigeon P + Cow Peas + Soya 35
36 Sweet Potato Sweet potato production is relatively low among the farmers. Most of the production is done in the staple field at 39%, some production is done in the Dimba at 25% and 7% in home gardens. The average production activities happening amongst the farmers are at 24%.Whilst sweet potatoes could be a potential alternative staple to maize; its production has remained significantly low. Irish Potato The average production of Irish potato amongst the farmers is 10%. Most of this production at 15% is done in the Dimba garden. In the staple field, only 12% of the farmers are growing Irish potato, while in the home gardens, only 3% reported growing Irish potato. Irish potato, another potential alternative staple to maize has not been exploited. Cassava The results of the survey indicated that no farmer is growing Cassava around their homes. 6% were growing Cassava in their staple field and 6% were growing Cassava in their Dimba gardens. On average, only 4% of the farmers are engaged in Cassava production. Sorghum Sorghum is still unpopular amongst the farmers in Dowa, under the survey. In the staple fields, only 2% produced Sorghum, likewise in the Dimba garden. In the home garden only 1% of the farmer produce Sorghum. On average, 1% on the farmers is growing Sorghum Millet Just like Sorghum, Millet is also unpopular amongst the farmers in Dowa. Only 2% of the farmers had produced Millet in the staple field and Dimba garden. As for the home garden, no farmer had attempted to grow Millet. Only 1% is growing Millet. Rice Rice is predominantly grown along the lakeshore in Malawi. Of the farmers under this study, only 1% was growing rice in their staple fields. 4% were growing rice in the Dimba garden. However, none of the farmers were growing rice around their homes. On average, 2% of the farmers were growing rice. Moringa The tree is promoted in Malawi as a medicinal tree. 9% of the farmers are growing the tree in the staple field. 5% of the farmers are growing Moringa in the Dimba garden. The most common place were the farmers are growing Moringa is around their homes. 11% of the farmers are growing it around their homes. On average, 8% of the farmers are growing Moringa. 36
37 Okra Okra is commonly grown in the staple field. 22% of the farmers reported growing it in the staple field. Only 8% were growing it in the Dimba, and 3% were growing it in the home gardens. However, on average the crop is not very popular amongst the farmers. It is grown on average by 11% of the farmers. Pumpkin Pumpkin is one of the most commonly grown vegetable in Malawi. Amongst the farmers in Dowa, 79% of the farmers reported that they were growing pumpkin in their staple field. In the Dimba gardens, pumpkin was grown by 56% of the farmers. Finally, 20% of the farmers were growing pumpkins around their homes. On average, 52% of the farmers are growing pumpkins in Dowa. Mustard 16% of the farmers who participated in the survey were growing Mustard in the staple field. More farmers at 44% were growing Mustard in the Dimba garden, while 5% were growing it around the homes. On average, 22% of the farmers are growing Mustard. Rape Rape in the staple field is only grown by 6.4% of the farmers under the study, while in the Dimba, it is grown by 19%. As of the home gardens, only 1% grew the crop. On average, 9% of the farmers were growing the crop. Amaranth Farmers do not always have to plant Amaranth in their staple field, Dimba gardens and areas around their homes as it grows on its own soon after the rains. However, Amaranth can also be grown through out the year in home garden and Dimba gardens. Of the farmers in Dowa 37% grow and or leave the Amaranth growing in the staple field. 25% grow of leave the Amaranth in their Dimba garden. And finally, 8% grow amaranth around their homes. Ob average, 23% of the farmers are growing Amaranth either in the staple field, home garden or in the Dimba garden. Chinese cabbage Chinese cabbage is grown in the staple field by 6 % of the farmers under the survey in Dowa. In the Dimbagarden it is grown by 11% of the farmers, and by 1% around the homes. Blackjack Blackjack is also a local vegetable. Usually farmers remove it as a weed in their fields. Some farmers leave it a pick the leaves for consumption. In the staple field, farmer growing and or leaving blackjack for consumption were at 43%, while in the Dimbagarden, they were at 24%. In the home gardens only 9% were growing or letting amaranth grow for consumption. On average, production of Blackjack is being done by 25% of the farmers. 37
38 Cabbage Cabbage is grown in the staple field by 4% of the farmers who participated in the survey. In the Dimbagarden, the crop is grown by 5% of the farmers. Around the homes, it is only grown by 1% of the farmers. On average, cabbage is being grown by 3% of the farmers under the study. Tomato Tomato is grown in the staple field by 26% of the farmers. In the Dimbagarden, it is grown by 30%. Around the homes, only 9% of the farmers grew tomato. On average 22% of the farmer were growing their own tomato. Onion Onions are not very popular amongst the farmer in this survey. In the staple fields, only 7% were growing onions. In the Dimbagarden only 9% were growing onions, while in home gardens, on 2% were growing onions at the time of the study. On average 6% of the farmers were growing onions. Carrot Carrots are the least of all crops in terms of production amongst the farmers in Dowa. With an average of 1%, it is grown by 1.6% of the farmers in the staple field, and 1.3% of the farmers. Guava In the staple field, only 6% had guavas growing. In Dimbagarden, 11% had guavas growing, while around the homes, only 1% of the farmers had guavas growing. On average, 6% of the population has guavas growing. Mango More mangoes are found in the staple field. 23% of the farmers have mango trees growing in the staple field. In the Dimbagardens 9% of the farmer had mango trees. Around the home, only 5% of the farmers had mango trees. On average, 12% of the farmers have mangoes growing on their land. Banana Results of the survey indicated that production of banana was as follow: 11% in the staple field and Dimbagarden and 8% in the home gardens. On average, 10% of our farmers were growing bananas on one of their land. Rosella Rosella is a bush that grows in the wild and in staple fields. In the staple fields, farmers remove it as a weed. However, some farmers keep it and use it for tea and eat it as a vegetable. Of the farmers that were under the survey, 12% were growing rosella, and or leaving it to grown in their staple fields for consumption. 2% of the farmers were growing and or leaving it to continue growing in their Dimbagarden for consumption. 2% were growing it in their home gardens. 38
39 Lemongrass The introduction of medicinal plants has built a desire amongst farmers to grow different plants in Dowa. Lemongrass is one of the crops that farmer are growing in Dowa. However, 4% of the farmers are growing it in their staple fields, 4% in their Dimba gardens, and 3% are growing it around their homes. Avocado Most farmers, who have avocado trees, have them around their homes and Dimbagardens. 3% have their avocado trees growing around their homes. 3% have their trees growing in their Dimbagardens, and 2% have them growing in the staple fields. On average, only 3 percent have avocado trees. Citrus Citrus trees are mostly grown around the homes. 5% of the farmer grow the citrus trees around their homes, 3% of the farmer grow them in their staple field, 3% grown them in the Dimbagardens too. However, only 4% of the farmers have got citrus fruit trees. Mulberry Of the few farmers that grow Mulberry, 2% grow it in the staple fields. 1% grew them in the Dimbagarden, and 2% around their homes. On average, only 2% of the farmers were growing mulberry at the time of the study. Papaya For papayas, 4% grown them in the staple fields, 3% in the Dimbagarden, and 6% grew the trees around their homes. On average, 4% of the farmers were growing papaya trees. Sugarcane Most sugarcane growers grow it in their Dimbagardens. 17% reported to be growing their sugarcane in the Dimbagarden, while for the staple field and the home garden; it was reported at 8% for both. 11% of the farmers under the study are sugarcane growers. Tobacco Tobacco is the biggest cash crop in Malawi. Amongst the farmers in Dowa, the production is mostly done in the staple field. 72% reported to have grown tobacco in the staple field. 6% reported to have grown tobacco in the Dimbagarden, while 16% reported to have grown tobacco around their homes. On average, 31% of the farmers under this survey have grown tobacco in the previous year. 43. Of the crops that you grew this past year, which did you sell? The farmers sold some of the crops that they grew, while some was kept at home for consumption and other purposes. Asked on which crops did they sale, the results of the survey indicates that: Most of the 39
40 farmers at 65% sold tobacco. Tobacco was followed by ground-nuts at 45%. Hybrid maize at 24.6% and local maize at 20%, which together was at 44.6%, where as for beans 42% reported to have sold their produce. Following the beans was soya which was reported to being sold by 41% of the farmers. 22% of the farmers were also selling cow peas, 20% were selling pumpkin greens, and 19% were selling mustard. Some crops are grown and sold only by a very few people. 15% of the farmers sold tomatoes, 13.4% of the farmers sold sweet potato, rape was sold by 11% of the farmers. The remaining crops were sold by less than 10% of the farmers. On average, sales of agriculture commodities is at 11.3% which implies that agri-business is very low amongst the farmers. 44. and 45. Do you own the following animals? If so, how many do you own? The survey also assessed ownership of livestock. The farmers were asked on which of the following stocks did they own; chickens, goats, pigs, cow, ducks, pigeons, and which others not listed. The results of the survey indicated that: 57% (n=212) of the farmers owned chicken against 43% (n=160) who did not; 35% (n=132) owned goats against 65% (n=243) who did not; 17% (n=67) owned pigs, while 83% (n=312) did not; 9% (n=33) owned cows, against 91% (n=340) who did not; 11% (n=42) owned pigeons, while 88% (n=330) did not own pigeons; Ducks were owned by 8% (n=31), while 92% (n=343) did not own. Results of livestock count were as follows: 1339 chickens, 437 goats, 148 pigs, 103 cows, 236 pigeons, and 369 ducks. The survey results also indicated that some farmers owned guinea fowls, birds, rabbits and sheep, which were not asked in the survey. Livestock Ownership No Yes 83% 91% 88% 91% 96% 65% 56% 43% 35% 16% 9% 11% 7% 3% Livestock Population Chickens Goats Pigs Cows Pigeons Ducks Others 0% 14% 9% 4% 50% 6% 17% Graph 6.3: Livestock Ownership Pie Chart 6.3: Livestock Population 40
41 46. and 47. This past year, did you use the following types of fertilizers. How much of the following types of fertilizers did you apply to your fields? The use of chemical fertilizers is on the higher side compared to organic fertilizers. The most popular fertilizer being Urea, but most used in terms of quantities were NPK followed by CAN. Of the organic fertilizers, animal manure was the most used method of fertilizing crops. After the animal manure was the green manure. Table 6.3: Types of Fertilizers No Yes Urea 108 (29%) 264 (71%) NPK 202 (54%) 169 (26%) CAN 293 (78%) 78 (22%) Animal Manure 293 (78%) 78 (22%) Green Manure 326 (87%) 44 (13%) In terms of quantities; accumulatively, the farmers had used 3208 kilo grams of Urea, 4314 kilo grams of NPK and 3329 kilo grams of CAN. Despite more people using Urea over the other fertilizers, Urea is being used in fewer quantities compared to the other fertilizer. Fertilizer Usage and Popularity Urea NPK CAN Animal Manure Green Manure Fertilizer Usage in Kgs Urea NPK CAN 13% 7% 13% 41% 31% 29% 26% 40% In terms of financial investments that were reported made on fertilizers, the survey indicated that the farmers made the following investments: Accumulatively, the farmers invested MWK 1,986, in purchasing on Urea, MWK 2,142, for purchasing NPK, and MWK 802, on CAN. For Urea, the average expense per person was MWK 28,783.00, while NPK it was MWK 33,469.00, and CAN MWK 20, For the farmers that paid for and used animal manure they together spent MWK 131,000.00, with an average expense of MWK 7, For those that used green manure and had to pay for it they together spent MWK 107, and on average, each farmer spent MWK 6,
42 Table 6.4: Source of Fertilizer Admarc Alliance ATC Vendor SFFRFM Nyiombo Urea NPK CAN Total Kulima Gold JTI Limbe Leaf Farmers world FISP Export Agola Relative and Friends Agriculture Development and Marketing Company (ADMARC) is the largest source of fertilizer for the farmers under the survey. After ADMARC is the Vendor. The vendor is a trader who moves around the communities, and may also have a seasonal stand in the market place. Farmers World, an agri-input company comes after the vendor, and then other agri-input companies such as Export Trading Company, Smallholder Farmer Fertilizer Revolving Fund of Malawi, and Kulima Gold. A few sourced their fertilizers from tobacco companies such as Limbe Leaf Tobacco Company, Japanese Tobacco Industry (JTI), and Alliance One. Some fertilizer was sourced from relatives and friends. For both animal and green manure, their sources were: Crop residues from the farm, and from relative. For animal manure in particular; the majority sourced it from kraals at home, and some bought from others and Central Poultry. 50. and 51. Did you use a coupon to purchase fertilizer or seed last year?if no, why not? The survey also asked the farmers on whether they had used a coupon to purchase fertilizer in the previous season, to see their purchasing power, and or whether they are heavily dependent on the subsidized fertilizer. It was also intended to delve the reasons why those that did not use coupons to purchase fertilizer did not do so. Table6.5: Farmers that used Coupons Count of Respondent Column Labels Grand Total Row Labels Female Male No Yes Grand Total
43 The results of the survey showed that: 44% of the farmers had used a coupon, while 56% did not. A gender disaggregated query indicated that; of the surveyed farmers, 57% of those that said yes, they had used a coupon were male farmers and 43% were female farmers. Table 6.6: Reasons for not using coupons Did not receive coupon Fertilizer not available Few Coupons Demande d Bribes Difficult Process Not Eligible No Money Name Missing Blank Count of Farmers Percentage Asked on why they did not use a coupon to purchase fertilizer, the farmers provided the following responses: Did not receive coupon, fertilizer not available, few coupons, demanded bribes, difficult process, not eligible, no money, and missing names. Did not receive coupon - The majority of the farmers, at 37% reported that they did not receive coupons. In their own words, some said they did not share some to us. Sentiments which have connotations that may insinuate thoughts that the criteria for selecting beneficiaries is not followed. Such sentiments insinuate that it is just a prerogative of the individuals that select beneficiaries and has less to do with the government criteria. Fertilizer not available Regardless of having the coupons, they were of no use because the fertilizer outlets from which the farmers were supposed to but it did not have any. As a result they did not use the coupons. Fewer coupons some farmers reported that there were only a few coupons available compared to the number of people that were there in the village. This implies that some farmers, whom according to the government criteria of selecting subsidy beneficiaries were eligible to get the coupons, did not get it still because there were only so much. Demanded bribes From both fronts, of the fertilizer seller and the people in charge of selecting beneficiaries, farmer reported malpractices. Regarding selection, (1) farmers reported that names were changed. A farmer could be registered but when the coupons come, the names that appear on the list would be different from those that registered. (2) Both the individuals charged to do the beneficially selection and the seller of inputs requested bribes from the farmers. (3) As for the seller alone, the farmers reported that the sellers were asking for extra money on top of the fixed price of MWK , if the farmer wants to buy fertilizer. 43
44 Difficult process Some farmers feel the process to get the fertilizer is very difficult. Despite the fact that they did not specify which part of the process, but there is need to re-evaluate the process to ensure efficiency. Not Eligible Some farmers were honest enough to state that they were not eligible to get the coupon. They fell short of the government criteria for determining beneficiaries. No Money for some farmers, despite being eligible, getting registered and receiving the coupon, they did not have even the subsidized amount of MWK As a result, they did not use the coupon. Missing Names Names of some farmers who registered went missing. It is not clear whether it is a glitch in the system, or a deliberate action by the individuals in charge of the registration. But after, the registration, some farmers find their names missing when it is time to receive the coupons. 52. How big is your field? The survey also queried the farmers on their land holding sizes in acres. The results of the survey were as follows in table 20 below. However, during the analysis, the acres were converted to hectares. Acres= unit of area (4840 square yards) used in English speaking countries. Hectares= A unit of area equal to 10,000 square meters. One hectare is equivalent to acres. Table 6.7: Land Holding Sizes Acres Hectares Count of Farmers Land holding size in Malawi is at an average of 0.2 hectares. However, the total number of acres under cultivation by the farmers under this survey was acres (473.2 hectares). The average land holding size amongst the farmers is 2.6 acres (1.0 hectares), 5 times higher than the national land holding size. 44
45 53. What was your staple field crop yield this past year (2013)? How many 50kgs bags? Table 6.8: 2013 Maize Yields Count of Respondent Column Labels Row Labels Female Male Grand Total 50Kg Bags Yield (50 Kgs X 78)
46 n/a (blank) Grand Total
47 Maize yields in the year 2013 were as follows: All the farmers under the study accumulatively harvested kg bags of maize. When weighed on a scale, a standard 50kg bag filled with maize weighs 78kgs. This implied that the total maize yields were Kgs. On average, each one of the farmers yielded kgs of maize. Cereal yield (kg per hectare) in Malawi was last measured at in 2013, according to the World Bank. Production data on cereals relate to crops harvested for dry grain only. Cereal crops harvested for hay or harvested green for food, feed, or silage and those used for grazing are excluded. Comparing World Bank s 2013 measurement of cereal yield (kg per hectare) with the findings of the CSA baseline survey (2013) it appears that the farmers are producing 38.9% less (kg per hectare). Instead on producing kg bags filled with 78kg of maize, the farmer are producing kg bags filled with 78kgs of maize. 54. and 55. How much of this did you sell? How much did you consume at home? (In 50kgs bags) Of the total produce (6060.4) 50kg bags, the farmers sold kg bags representing 28%. Table 6.9: How much maize was sold? Quantities Sold Count of Respondent Total Bags Sold Grand Total
48 The results of the survey indicated that: the farmers consumed kg bags of maize. This represents 84% of their total yields. The sum of what they consumed and sold exceeds their yields from 2013 by kg bags of maize. Possibly, the extra might have come from their Dimba garden production, which was not captured in the total harvest survey. Additionally, they might have sourced it through purchasing, but was reported as consumed. 56. Where do you get information on farming practices? Malawi follows a pluralistic approach to extension service. Government, NGOs, and private sectors can all provide extension services. Same farmers get extension and advisory services from different development organizations and similar, different, and sometimes conflicting subjects. Asked on the sources of extension amongst the farmers under this study in Dowa, the results were as in the table 23 below. 83% of the farmers get extension messages through the radio. 68% get extension messages through government extension officers, 62% get extension service from farmer associations and clubs. Between relatives, neighbors and friends it was at 48% and 45% respectively, with an average of 47%. Extension services from NGOs were at 46%. Research institutions extension was at 38%, Kusamala at 37%, private sector at 16%, Cell phones programs at 13%, Churches and Mosques at 8%, and finally donor funded projects at 8%. Table6.10: Extension Sources Extension Source No Yes Radio Government Extension Farmer Association Relatives NGO Friends/ Neighbors Research Kusamala Private sector Cell phone programs Church/ Mosque Donor funded projects CONCLUSION Farmers in our project area are highly susceptible to floods, droughts, erratic weather patterns and do not feel prepared to address these threats. Poor environmental conditions, such as low soil quality and economic institutions; such as the Farm Input Subsidy Program (FISP) not working as designed to 48
49 provide access to seeds, fertilizers, and markets; exacerbate these conditions. The FISP is clogged with corruption and there are glitches through which key variables fall and fail the entire system. According to this survey, 85 percent of the respondents reported that their income rarely or never meets their basic needs.although costs associated with fertilizers are relatively low compared to other parts of the world, 83% of the farmers in the project area are living on less than $2.50/day. Average fertilizer costs in the area were 27,600 MWK. In one month, a farmer living below the PPP $2.50/day line is expected to meet all their basic needs on less than 26,200 MWK. In addition, 91% of the respondents stated that their harvest quality and quantity was unsatisfactory or only fairly satisfactory. Comparing World Bank s 2013 measurement of cereal yield (kg per hectare) with the findings of the CSA baseline survey (2013) farmers are producing 16 bags of maize compared with 27 bags of maize, 40% less (kg per hectare) than the world average. Comparing the 2012 and 2013 harvests, there is an increase in the number of people that ran out of their harvest from 196 farmers to 218 farmers, if the trend continues it could be devastating. 52% of the respondents were; either sometimes, often, or always worried about running out of food before the next harvest. The results of this survey revealed economic, environmental, and social hardship in the project and the need to address food sovereignty and promote techniques that will lead to improved soil quality, crops, and improved access to food through promoting practices some farmers in the area are already using. These include crop rotation, seed saving, intercropping, and organic manures. This project is designed to promote all these practices in tandem with other less used techniques such as grey water harvesting, permanent beds, countour planting, rain water catchment, and mulching. In addition, there is a need to capitalize on upscaling production of indigenous crops such as amaranth and blackjack which already are left in the fields by 25% of the farmers in the project area. Upscaling current practices and promoting them in tandem with other CSA techniques is the focus of this project. The results of this survey compels Kusamala to engage in more qualitative studies on some of the issues emerging from the survey, apart from the comparative studies that are set to be done. There is need to ascertain the perceptions and feelings of the farmers on some of the new techniques that they are learning in the project so as to project possible sustainability of the new technologies. 49
50 APPENDIX A 50

51 51
52 52
53 53
54 APPENDIX B 54

55 55

56 56

57 57