Friday Aug 10, 2012 World Ag Supply & Demand Report
|
|
|
- Dulcie Hopkins
- 5 years ago
- Views:
Transcription


1 Friday Aug 10, 2012 World Ag Supply & Demand Report U.S. 2011/12 Old Crop Corn is Supportive Global Old Crop Corn is Slightly Bearish USDA estimates the 2011/12 U.S. corn carryout at 1,021 million bushels, up from 903 million bushels from last month. The 2011/12 US corn carryout estimate is 97 million higher than the average trade estimate of 924 million bushels. World corn carry out is projected at mmt vs. the July USDA estimate of mmt. The increase in world corn carry out stocks of 6.6 mmt is equivalent to million bushels U.S. 2012/13 New Crop Corn report is Supportive Global New Crop Corn report is Slightly Bullish USDA estimates the 2012/13 U.S. corn carryout at 650 Million bushels, down 533 million from Billion bushels. The 2012/13 US corn carryout estimate is 10 million lower than the average trade estimate of 660 Million bushels. USDA decreased expected yield by 22.6 bushels per acre to which decreased total production by 2.2 billion bushels. USDA slashed expected demand by Billion which is Billion less than the current year expectations. The year to year U.S. corn carry out is now projected at 371 million bu. decrease vs. 280 million bu. increase last month. World corn carry out is projected at mmt for USDA s vs. the July USDA estimate of mmt. The decrease in world corn carry out stocks of mmt from the prior month is equivalent to million bushels U.S. 2011/12 Old crop Soybean report is Friendly Global Old Crop Soybeans is slightly Friendly USDA decreased the 2011/12 U.S. soybean carryout to 145 million bushels, down 25 mil. bu. from 170 million bu. last month. The 2011/12 soybean carryout estimate is 13 million less than the average trade estimate. World soybean carry out is projected at mmt vs. the July USDA estimate of mmt The decrease in world soybean carry out stocks of 0.57 mmt is equivalent to 20.9 million bushels U.S. 2012/13 New Crop Soybean Friendly Global New Crop Soybeans is Slightly Bullish USDA estimates the 2012/13 U.S. soybean carryout at 115 million bushels, down 15 million bu. from 130 mil. bu. last month The 2012/13 soybean carryout estimate is 3 million above the average trade estimate of 112 mil. bu. World soybean carry out is projected at mmt vs. the July USDA estimate of mmt The decrease in world soybean carry out stocks of 2.28 mmt is equivalent to 83.8 million bushels


2 U.S. 2012/13 Wheat report is Slightly Bearish Global Wheat report is Slightly Bullish USDA increased the 2012/13 U.S. wheat carryout by 34 million bushels to 698 million bushels vs. 664 mil. Bu. last month. The 2012/13 all wheat carryout is 25 million above the average trade estimate of 673 million bushels. World wheat carry out is projected at mmt vs. the July USDA estimate of mmt. The decrease in world wheat carry out stocks of 3.32 mmt is equivalent to million bushels


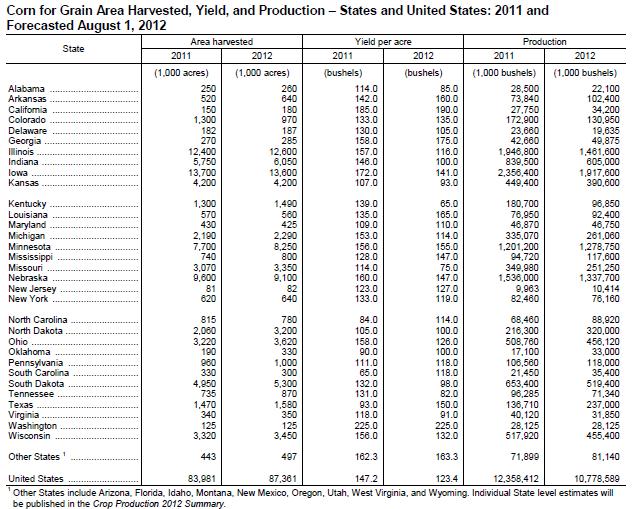
3 Global 2012/13 corn production is projected at mmt down from mmt last month. Foreign corn production for 2012/13 is mostly unchanged with increases for China, Argentina, Brazil, Mexico, and South Africa mostly offset by reductions for EU-27, Ukraine, India, Serbia, Russia, Croatia, Moldova, and Canada. Larger 2012/13 corn beginning stocks in the United States and Brazil partly offset lower U.S. and foreign coarse grain production. Brazil corn beginning stocks are raised 2.8 million tons based on higher reported production for 2011/12. Global corn trade is projected sharply lower this month in response to tighter U.S. supplies and higher prices. Corn imports are lowered for China, EU-27, Indonesia, Japan, South Korea, Mexico, Vietnam, Israel, Colombia, Peru, and Syria. In addition to the United States, corn exports are reduced for Ukraine, EU-27, and Serbia. Partly offsetting are export increases for Argentina, Brazil, South Africa, and Canada. Global corn consumption is projected 38.9 million tons lower with the United States accounting for more than three-fourths of the reduction. Foreign corn feeding drops 8.8 million tons.. World corn ending stocks for 2012/13 are projected at million tons down from million tons by million tons with the United States accounting for 13.5 million tons of the decline. U.S. Corn ending stocks for 2011/12 increased 118 million bushels to 1,021 million bushels, up from 903 million bushels from last month. Lower expected exports, reduced corn use for ethanol, and a small increase in imports account for the changes. U.S. Corn ending stocks for 2012/13 are projected at 650 million bushels down from billion bushels by 533 million bushels in prior estimates and down by only 371 million from the current year projection. The projected U.S. corn yield is lowered 22.6 bushels per acre to bushels as extreme heat and dryness continued, and in many areas worsened, during July across the Plains and Corn Belt. As forecast, the 2012/13 corn yield would be the lowest since 1995/96. Total U.S. corn supplies for 2012/13 are projected down 2.0 billion bushels and at a 9-year low.

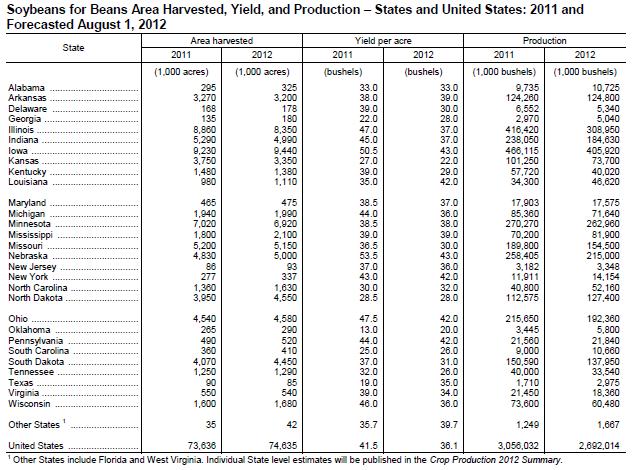
4 Global Soybean 2012/13 production is forecast at mmt down by 6.74 mmt from mmt last month. Lower soybean production is projected for the United States, Canada, and EU- 27 due to lower yields resulting from hot, dry weather. Soybean production is raised for Brazil and Paraguay as producers are expected to respond to sharply higher prices with increased plantings. Brazil s soybean production is projected up 3 million tons at a record 81 million. Global Soybean trade and consumption for 2012/13 are all reduced this month reflecting the impact of reduced supplies and higher prices. Projected soybean imports for China are reduced 1.5 million tons to 59.5 million as domestic soybean stocks contribute a larger component of soybean meal consumption. Soybean exports for Brazil and Argentina are forecast higher but only partly offset a reduction for the United States. Global soybean carry out for 2012/13 is projected at mmt down 2.28 mmt from mmt last month. Global oilseed production for 2012/13 is projected at million tons, down 8.5 million tons from last month. Reductions for soybeans, sunflowerseed, peanuts, and cottonseed are only partly offset by increased rapeseed production. U.S. Soybean 2011/12 ending stocks are decreased another 25 million bushels this month putting ending stocks at 145 million bushels. U.S. soybean exports for 2011/12 are increased 10 million bushels this month to 1.35 billion. The U.S. soybean crush is raised 15 million bushels to billion due to stronger-than-expected crush. These two changes account for the 25 million bushels increase in demand. U.S. Soybean 2012/13 supplies are projected 378 million bushels below last month s forecast due to lower beginning stocks and reduced production. Soybean crush is projected at 1.51 billion bushels, down 95 million reflecting the impact of higher soybean meal prices on meal exports and domestic disappearance. Soybean exports for 2012/13 are reduced 260 million bushels to 1.11 billion reflecting lower U.S. supplies. U.S. Soybean 2012/13 ending stocks are projected at 115 million bushels, down 15 million from last month and 30 million from 2011/12, leaving the stocks-to-use ratio at a historically low 4.2 percent. Soybean production is projected at billion bushels Down 358 million due to lower harvested area and yields. Harvested area is projected at 74.6 million acres, down 0.7 million from the July projection. The first survey-based soybean yield forecast of 36.1 bushels per acre is 4.4 bushels below last month s projection and 5.4 bushels below last year s yield. Soybean supplies for 2012/13 are projected 12 percent below last month to a 9-year low on lower production and reduced beginning stocks.


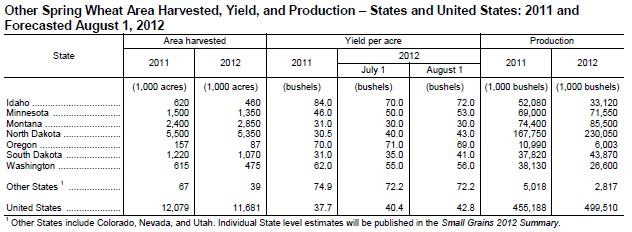
5 Global ending wheat stocks for 2012/13 are projected 3.32 mmt lower at mmt from an estimate of mmt last month. Global wheat supplies for 2012/13 are projected 2.1 million tons lower mostly reflecting a 3.7-million-ton reduction in foreign production. A small increase in 2012/13 world beginning stocks is partly offsetting with 2011/12 updates to trade and use for a number of countries. Lower expected production in the FSU- 12 accounts for most of this month s decline in world output. Production is lowered 6.0 million tons for Russia on reduced area and yield prospects due to July heat and dryness across most of the spring wheat growing areas. Spring wheat in adjoining areas of Kazakhstan was also affected by the same adverse weather reducing production prospects 2.0 mmt. Other reductions include a 0.8 mmt for Turkey based on, a 0.5 mmt for Argentina, a 0.3 mmt for Syria, and a 0.2 mmt for EU-27. Production is raised 2.9 mmt for India, 2.0 mmt for Ukraine, and 0.4 mmt each for Canada and Uzbekistan. Global wheat consumption for 2012/13 is raised 3.2 million tons as a number of countries are expected to shift feeding from corn to wheat. Wheat feeding is raised 1.0 mmt each for EU-27 and Ukraine, 0.5 mmt each for South Korea and Vietnam, 0.3 mmt for Israel, and 0.2 mmt each for India and Thailand. Global wheat imports for 2012/13 are raised with increases for several countries, in part, to support higher wheat feeding. Imports are raised 0.5 million tons each for EU-27, South Korea, and Vietnam, and raised 0.3 million tons for Israel. Imports are also raised 0.3 million tons for Brazil. Global wheat 2012/13 exports are raised, but much of the shift among countries also reflects reduced export prospects for Russia, which is lowered 4.0 million tons. Exports are raised 2.0 million tons for Ukraine, 1.0 million tons each for Canada and EU-27, 0.5 million tons each for Australia, Brazil, and Pakistan. Exports are lowered 0.7 million tons for Argentina, 0.5 million tons for Turkey, and 0.2 million tons for Uruguay. U.S. wheat supplies for 2012/13 are raised 54 million bushels with higher forecast production and an increase in projected imports. Production is forecast 44 million bushels higher with increased yields for winter wheat, durum, and other spring wheat. Feed and residual use is projected 20 million bushels higher, reflecting the tighter supply situation for corn. Winter wheat production is forecast at 1.68 billion bushels, up 1 percent from July and up 13 percent from Based on August 1 conditions, the United States yield is forecast at a record high 48.0 bushels per acre, up 0.3 bushel from last month and 1.8 bushels higher than last year. Other spring wheat production is forecast at 500 million bushels, up 6 percent from the July forecast and up 10 percent from last year. U.S. wheat ending stocks for 2012/13 are projected are projected 34 million bushels higher.


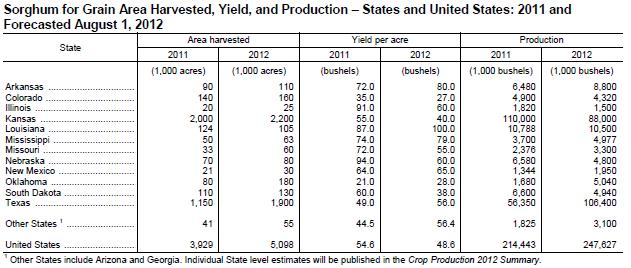
6 Global 2012/13 course grain supplies are reduced 56.5 million tons mostly reflecting the forecast 55.7-million-ton reduction in the U.S. corn crop. Larger 2012/13 corn beginning stocks in the United States and Brazil partly offset lower U.S. and foreign coarse grain production. Brazil corn beginning stocks are raised 2.8 mmt. Foreign corn production for 2012/13 is mostly unchanged with increases for China, Argentina, Brazil, Mexico, and South Africa mostly offset by reductions for EU-27, Ukraine, India, Serbia, Russia, Croatia, Moldova, and Canada. Reductions in barley production in FSU- 12, EU-27, and Turkey lower global barley production 1.1 million tons. A 2.5- million-ton reduction in India millet output also lowers world coarse grain supplies. Foreign sorghum production is lowered 0.3 million tons with a reduction for India. Global 2012/13 rice production is lowered 1.9 million tons to million, due primarily to forecast reductions for India, Brazil, and North Korea, which are partially offset by increases for China and South Korea. Beginning stocks are increased 0.8 million tons due to a 1.0-million-ton increase for India, which is partially offset by reductions for Brazil and Indonesia. World consumption is reduced 0.4 million tons. A 1.0-million-ton increase in China offsets an identical reduction for India. Consumption forecasts are also lowered for Brazil, North Korea, and the United States, partially offset by an increase for Indonesia. Global trade is changed little from a month ago. Global Rice ending stocks for 2012/13 are projected at million tons, down 0.7 million from last month, and a decrease of 3.2 million from the previous year. The largest stocks reductions for 2012/13 are for Brazil and Indonesia, each just over 0.3 million tons.


7 U.S. Corn USDA estimates the 2011/12 U.S. corn carryout at 1,021 million bushels, up 118 million from 903 million bushels from last month a result of lower expected exports of 50 million, lower ethanol use of 50 million and higher imports of 3 million bushels. U.S. Corn ending stocks for 2012/13 are projected at 650 Million bushels, down 533 million from Billion bushels. USDA decreased expected yield by 22.6 bushels per acre to which decreased total production by 2.2 billion bushels. The yields for several states were lowered with projections for South Dakota at 98.0, Indiana at 100.0, Illinois at 116.0, Michigan 114.0, Iowa 141.0, Nebraska 147.0, Minnesota USDA slashed expected demand by Billion which is Billion less than the current year expectations. As forecast, the 2012/13 corn yield would be the lowest since 1995/96. Total U.S. corn supplies for 2012/13 are projected down 2.0 billion bushels and at a 9-year low. The season-average 2011/12 farm price is projected at $6.30 per bushel. 2011/12 US ending stocks of 1,021 million bushel estimates provides for 8.2% carry out as compared to a 7.2% Carry Out / Use ratio last month and represents 30 days of usage as compared to 26 days estimated last month. 2012/13 US ending stocks of 650 million bushel estimates provides for a 5.8% carry out as compared to 9.3% Carry Out / Use ratio last month and represents 21 days of usage as compared to 34 days estimated last month. The season-average 2012/13 farm price is projected range is now $7.50 to $8.90 per bushel, up from $5.40 to $6.40 per bushel last month.


8 U.S. Soybeans USDA decreased the 2011/12 U.S. soybean carryout to 145 million bushels, down by 25 million bushels from last month. The U.S. soybean crush was raised 15 million bushels and exports were raised by 10 million both due to higher demand. USDA estimates the 2012/13 U.S. soybean carryout at 115 million bushels, down 15 million bu. from 130 mil. bu. last month 30 million from 2011/12, leaving the stocks-to-use ratio at a historically low 4.2 percent. Soybean production is projected at billion bushels, down 358 million due to lower harvested area and yields. Harvested area is projected at 74.6 million acres, down 0.7 million from the July projection. The first survey-based soybean yield forecast of 36.1 bushels per acre is 4.4 bushels below last month s projection and 5.4 bushels below last year s yield. If realized, the average yield will be the lowest since Soybean supplies for 2012/13 are projected 12 percent below last month to a 9-year low on lower production and reduced beginning stocks. The U.S. 2011/12 season-average farm soybean price was reset at $ The 2011/12 ending stocks estimated of 145 million bushel provides for a 4.6% Carry Out / Use ratio for the crop year as compared to 5.4% last month and represents 17 days of usage as compared to 20 days of usage last month. The 2011/12 Soybean meal forecast prices was set at $390 per ton while Soybean oil prices were set at cents per pound. The U.S. 2012/13 season-average farm soybean price range was reset $2.00 higher at between $15.00 and $17.00 per bushel and provides for a 4.2% Carry Out / Use ratio and represents only 15 days of usage. The 2012/13 Soybean meal forecast was placed higher at between $460 and $490 per ton. Also higher are the 2012/13 Soybean oil prices which were projected at between and cents per pound.


9 U.S. Wheat USDA estimates the 2012/13 U.S. wheat carryout at 698 million bushels, up 34 million bushels from 664 million bushels last month. The all wheat yield is now projected.9 higher at 46.5 bushels per acre. Production is forecast 44 million bushels higher with increased yields for winter wheat, durum, and other spring wheat. Feed and residual use is projected 20 million bushels higher, reflecting the tighter supply situation for corn. Winter wheat production is forecast at 1.68 billion bushels, up 1 percent from July and up 13 percent from Based on August 1st conditions the United States yield is forecast at a record high 48.0 bushels per acre, up 0.3 bushel from last month and 1.8 bushels higher than last year. Other spring wheat production is forecast at 500 million bushels, up 6 percent from the July forecast and up 10 percent from last year. USDA estimates 2012/13 ending stocks at 698 million which provides for a 28.6% Carry Out / Use ratio as compared to 27.4% last month and represents 104 days of usage as compared to 100 days last month. The 2012/13 U.S. season-average farm wheat price was increased to between at between $7.60 and $9.00 as compared to between $6.20 and $7.40 per bushel last month.

10 Year to Year Change


11 Carry out Matrix Yellow Highlights show current USDA Projections The 2012/13 Corn Balance sheet matrix shows potential yield and acres scenarios. The 2012/13 Soybean Balance sheet matrix shows potential yield and acres scenarios. The 2012/13 Wheat Balance sheet matrix shows potential yield and acres scenarios. The RED highlighted matrix cells indicate stocks to use carry out ratio that typically has been considered tight.
12
13
14 Minnesota West Ag Services is an equal opportunity provider This material has been prepared by a sales or trading employee or agent of Allendale Inc. and is, or is in the nature of, a solicitation. This material is not a research report prepared by Allendale s Research Department. By accepting this communication, you agree that you are an experienced user of the futures markets, capable of making independent trading decisions, and agree that you are not, and will not, rely solely on this communication in making trading decisions. DISTRIBUTION IN SOME JURISDICTIONS MAY BE PROHIBITED OR RESTRICTED BY LAW. PERSONS IN POSSESSION OF THIS COMMUNICATION INDIRECTLY SHOULD INFORM THEMSELVES ABOUT AND OBSERVE ANY SUCH PROHIBITION OR RESTRICTIONS. TO THE EXTENT THAT YOU HAVE RECEIVED THIS COMMUNICATION INDIRECTLY AND SOLICITATIONS ARE PROHIBITED IN YOUR JURISDICTION WITHOUT REGISTRATION, THE MARKET COMMENTARY IN THIS COMMUNICATION SHOULD NOT BE CONSIDERED A SOLICITATION. The risk of loss in trading futures and/or options is substantial and each investor and/or trader must consider whether this is a suitable investment. Past performance, whether actual or indicated by simulated historical tests of strategies, is not indicative of future results. Trading advice is based on information taken from trades and statistical services and other sources that Allendale Inc. believes are reliable. We do not guarantee that such information is accurate or complete and it should not be relied upon as such. Trading advice reflects our good faith judgment at a specific time and is subject to change without notice. There is no guarantee that the advice we give will result in profitable trades. Minnesota West Ag. Services, it's principals and employees assume no liability for any use of any information contained herein. Reproduction or rebroadcast without authorization is forbidden