Feed and Milk Outlook
|
|
|
- Calvin Golden
- 5 years ago
- Views:
Transcription

1 Feed and Milk Outlook Dairy Today Elite Producer Business Conference 2013 The Bellagio Las Vegas, NV Tuesday November 12, 2013 Joel Karlin (559)
2 Look at feed markets as of early November 2013 U.S. row crop production decent and far better than thought earlier in the year Record U.S. corn production offset by high usage, will see if optimistic USDA demand projections prove true Glitches in 2013 growing season weather hurt beans more than corn while continued buoyant demand keeps protein meal prices elevated Basis levels remain at record high levels linked to limited farmer sales given dissatisfaction with current prices, ample storage, and desire to defer any additional income till Inverted soybean market bringing more sales of that crop while end-users should make note that record large corn crop will eventually come to market More talk that high priced grain era may be ending on consecutive years of good output, use in bio-fuels plateauing, and speculative investor interest waning
3
4
5

6
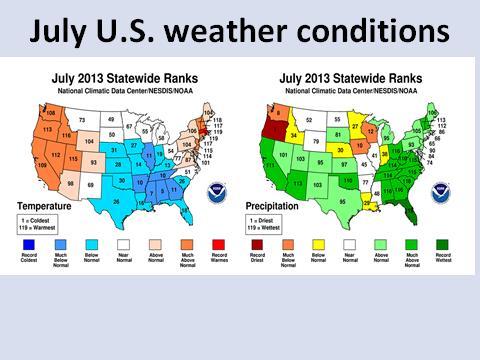
7 Review of 2013 U.S. growing season Heavy and in some case record Midwest spring rains help recharge subsoil moisture supplies but led to large amounts of intended acreage not getting planted Summer temperatures especially in July cooler than normal helping conserve moisture and aiding corn pollination Summer precipitation quite limited especially in August with soybeans more adversely impacted Last half September rains benefit still green soybean plants more than is normally the case Very late first fall killing freeze real blessing as it helps late developing corn and soybean plants reach full maturity adding to ear and pod weight

8 Where we were a year ago

9 Drought conditions at start of year rivaled episodes seen in 1930 s and 50 s
10 Drought returns to the Corn Belt

11 Big improvement in drought conditions prior to summer growing season

12 How did this happen, miracle spring rains
13

14

15 Warm September also quite favorable

16 Summer temps are average to below
17 Summer rains in core Midwest even less than in 2012 drought
18 Implication on yields from summer growing weather Old market adage that corn is a crop of July and soybeans of August Ample subsoil moisture reserves and cool July temperatures allowed corn to skate through growing season in reasonably good shape, especially during critical pollination period Dry 2nd half conditions compromised corn kernel fill (ear weights) though plant populations are record high Dry weather in August and 1st half of Sep really impaired soybean flowering, pod setting, and bean fill as moisture reserves were depleted resulting in far lower numbers of pods than usual Historically late plantings for soybeans that caused concern about possible fall freeze damage proved to be blessing in disguise as still green plants benefited from last half September moisture Outstanding conditions in states outside traditional corn and soybean belt elevated national yields. Particularly important for soybeans with large amount grown in Delta and Southeast offsetting more stressed beans in Midwest Historically late first fall freeze in much of Corn Belt allowed lagging soybean and corn crops due to late plantings and cool summer temperatures to reach full maturity.
19 Impact on acreage from heavy spring rains
20 Corn situation After 3 straight years of falling yields each worse than the prior season, record U.S. crop in 2013 on close to trend yields and high acreage Final crop report in Jan could show even higher output given reports of still better than expected results during last part of harvest and recent tendency for Nov to Jan yield increases USDA forecast of a 16.8% increase in total demand this year, 2 nd highest since 1975 seems rather optimistic given lower GCAU numbers, likelihood that U.S. corn exports this year are front-end loaded, and possible reduction in ethanol mandate Corn prices seen steady to maybe a shade lower thru year end but thereafter situation appears bearish. Large overhang of unsold inventories, decent start to South American growing season, and prospect of another large U.S. crop next year based on good soil moisture profile, corn holding its own vs. beans on $/acre basis, and ideas that if we can get 160 bpa plus with just so-so 2013 weather what will good season in 2014 bring. Net upshot is CN2014 may lose close to $1.00 by 7/4/14 Trend toward increased meat and dairy consumption in developing world will continue to necessitate large supplies of coarse grain and protein meals ensuring a solid demand base
21 Global demand for coarse grains has actually outpaced that for protein meals
22 Not difficult to build a bearish scenario for next year U.S. corn supply-demand in million bushels and acres USDA USDA 2012/13 Western 2013/14 USDA 2013/14 Western 2014/15 Western Planted Harvested Yield Beginning stocks 1, ,415 Production , ,989 14,057 13,956 Imports Ttl supply 13,517 11,931 11,931 14,837 14,910 16,396 Feed/residual 4,548 4, FSI 6,437 6, FSI for ethanol 5,011 4, Ttl domestic 10,985 10, Exports 1, Ttl use 12,528 11, Ending stocks ,887 2,415 3,196 Stocks/use 7.9% 7.4% 7.4% 14.6% 19.3% 24.2% Ave farm price $6.22 $6.89 $6.80 $4.50 $4.25 $3.50
23 Acreage second highest since mid 1930 s
24

25 Eastern Corn Belt, Delta, & Southeast all post record yields
26 USDA using record ear populations but below average ear weights

27 Plant populations increase but ear weights dependent on weather
28 Rainfall important but temperatures real key for corn yields
29 Final 2013 corn yield should not change much from Nov bpa estimate
30 USDA has set bar very high with demand projections

31 End of ethanol boom will forestall constant need for higher corn acreage allowing room for other crops
32 U.S. export commitments as % of final year projection have never been higher
33 After falling to 43 year low how much can U.S. corn exports rebound

34 Lower GCAU and more byproduct feeds such as DDG s do not support higher feed estimate
35 Forecasted 2013/14 corn price seems higher than what traditional scatter studies would imply; why is that?
36 Protein meal situation Prices are forecast steady to slightly higher than a year ago based on buoyant demand Soybean production slightly below trend as dry Aug and 1 st half of Sep more stressful for beans than corn Even though South America has larger exportable supplies this year than last, USDA projection of our overseas sales seems solid as both Argentina and Brazil are beset with logistical issues Heavy using protein meal monogastric sector (hogs, poultry) seeing much better margins than ruminants so estimate for crushings for soybean meal seem on track Low for protein meals likely already seen so end-uses looking for any pullback in values. Prices should remain firm into spring but a large 2014 South American crop and indications that U.S. farmers may plant over 80 million acre of soybeans may result in significant retrenchment in values
37 Tight this year but larger plantings next season will offer relief U.S. soybean supply-demand in million bushels and acres 2011/12 USDA 2012/13 USDA 2012/13 Western 2013/14 USDA 2013/14 Western 2013/14 Western Planted Harvested Yield Beginning stocks Production 3,094 3, ,270 3,485 Imports Ttl supply 3,325 3,239 3, ,435 3,725 Crushings 1,703 1,689 1, , Exports 1,362 1,320 1, , Seed Residual Ttl use 3,156 3,099 3, ,225 3,345 Ending stocks Stocks/use 5.4% 4.5% 4.5% 5.2% 6.5% 11.4% Ave farm price $12.50 $14.40 $14.40 $12.15 $11.50 $10.00

38 Yields higher than last year but third year in a row of below trend
39 Recent history suggests final soybean yield could be bpa above 43.0 Nov estimate

40 Eastern half of U.S. does very well and maybe upside for west with only 73% of crop mature when USDA did Nov lab testing
41 Dry 2 nd half of growing season results in very low number of pods though they are heaviest ever
42 Interestingly no real correlation between August precipitation and pod weights
43 Work we have done suggests soybean plants can compensate for lower numbers of pods with higher weighted pods
44 USDA which tends to understate soybean demand has more restrained projections than for corn
45 Why would processing rate be throttled back when crush margins are the highest ever
46 Usually July soybean meal hits its lowest point year prior to expiration
47

48 July 2014 soybean meal futures

49 Brazil and Argentina now account for half of global soy production and exports
50 2014 Dairy Outlook Most positive factor is explosion in U.S. exports in recent years that will only increase over time Asian populace especially in China starting to consume larger quantities of milk & dairy products Most negative factor is sentiment that lower feed costs will increase milk production All other major milk producing countries that saw output declines earlier in year recovering strongly
51 Milk output has rarely fallen below year ago levels over the past ten years
52 Cow numbers still quite a bit higher than low seen over past ten years

53 Spotty forage quality has slowed milk per cow productivity along with large number of heifers entering herd

54 Changing U.S. demographics results in less per capita cheese consumption

55 How accurate are milk futures predicting actual annual values?

56 At present, Asian nations have lowest per capita consumption of fluid milk
57 That is forecast to change in the coming years
58 China s interest in milk powder
59 Impact on global market

60 Outlook for Chinese dairy demand is quite robust
61 at Thank you and any questions Remember that if you want copy of this presentation or my weekly newsletter