GEOGLAM: Science-driven information supporting decisions in agricultural markets and food security through use of earth observations
|
|
|
- Sydney Williamson
- 5 years ago
- Views:
Transcription
1 GEOGLAM: Science-driven information supporting decisions in agricultural markets and food security through use of earth observations Inbal Becker-Reshef Program Scientist GEOGLAM Secretariat Co-Director Center for Global Agricultural Monitoring Research, University of Maryland A Group on Earth Observations (GEO) Global Agricultural Monitoring Initiative 5 th Meeting of the Agricultural Chief Scientists, Xi an, May 30-31
2 A GEO Initiative on Global Agricultural Monitoring through the use of earth observations Launched by G20 in 2011 (French Presidency), under Action Plan on Food Price Volatility and Agriculture Alongside the Agricultural Market Information System (AMIS) Vision: Strengthen the international community s capacity to provide actionable, science-driven, open, information at subnational to global scales, in support of policies, investments and decisions, in food security, and agricultural markets. Through use of coordinated, multi-sensor, Earth Observations (EO) Building on existing systems
3 Production forecast (% of final ) Context Wheat Production Forecasts vs. International Market Price: 2010, 2012 Production Forecasts (% of final estimate) Price ($/Ton) 30% 2010 Critical period for EO Final Estimate 2011 Need for improved timely, production forecasts 30% % 10%
4 An International Collaborative Initiative Based on common interests and challenges Building on existing systems, leveraging domestic and international activities Foundation in user-driven operational R&D Emphasis on transitioning research to operations & capacity building Structure Advisory Committee representing user community (Ag Departments) Chaired by USA (Ann Bartuska) and China (He Changchui) Members include: EC, Canada, South Africa, Japan, Greece, Australia/CEOS, African Union, WMO, AMIS, IFPRI, BMGF) Secretariat Distributed implementation team and projects leads


5 Pathway Civilian Space Sector In situ Met Data Commercial Space Sector Coordinating EO Data Acquisition, Access, Continuity Operational R&D Method Development & Improvement Markets & Trade Research-to-Operations Capacity Development for Operational use of EO Methods Strengthened Monitoring Systems National, Regional, Global Impact assessment Rural Development Investment & Insurance Actionable Information Food Aid Mitigation & Adaptation Supporting SDG s Vulnerability Assessments

6 GEOGLAM is aligned with SDGs MONITORING FOR EARLY WARNING IN SMALLHOLDER SYSTEMS R&D EFFORTS ON SUSTAINABLE AGRICULTURE INTERNATIONAL COORDINATION FOR R&D CROP MONITOR => TIMELY ACCESS TO MARKET INFORMATION TO REDUCE PRICE VOLATILITY


7 The GEOGLAM Community Open Community made up of international and national agencies concerned with agricultural monitoring including Ministries of Ag, Space agencies, Universities, & Industry 7 / 21
8 Our Broad Challenge: Development of robust, operationally viable methods for agricultural monitoring, forecasting, and assessments of global food production applicable at field to global scales across diverse agricultural systems Ensuring coordinated, sustained and accessible EO data Access to training data (in-situ and stats) building linkages with relevant platforms and networks Linking with the climate modeling community Technology transfer- transition into operational systems Capacity building and sustained relationship between R&D community & operational end users Ultimately improve global assessments by improving national monitoring Broad and effective communication to decision makers (farmers, extension, markets, private sector, insurance, food relief, policy & economics communities) Too big for one country or agency need for international coordination and collaboration
9 Opportunity: Big Data, Technological Innovation & international collaboration platform Unprecedented volumes of (free/cheap) data, supercomputing/cloud compute, innovative analysis tools, mobile and gps technologies, social media, etc. Specifically in EO- rapidly changing landscape Transformational for the agricultural monitoring community Promise for sustained observations in the future (Canada, India, China, EU, US, Belgium )

10 Traditionally relied on 1km to 250m resolution data Punjab, Pakistan, 250m MODIS

11 Now we have 30-10m resolution data Punjab, Pakistan, 30m Landsat 8


12 In near future 1 to 5 meter will be routine! Hand, Science News, 2015 CubeSat launches since 2003 new era for high/very high resolution data Promise for close to daily global, cheap, data Punjab, Pakistan, 0.5 meter, Worldview2
13 EXAMPLES OF GEOGLAM ACHIEVEMENTS
 www.geoglam-cropmonitor.")
14 GEOGLAM Crop Monitor for AMIS Response to AMIS request Objective: transparent, timely, crop condition assessments in primary agricultural production areas Reflecting an international consensus, building on existing systems 4 Crops: Wheat, maize, soybean, rice Focus: main production/export countries (G20) 14
15 Context: need for improved production forecasts & transparency Colors indicate different agencies Squares indicate reported end of season estimates Circles indicate inseason forecasts - Within season forecasts vary between agencies & years - Critical particularly in anomalous years


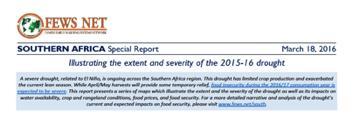
16 Crop Condition Maps Covering AMIS Crops Conditions as of May 28 th Quick and easy to interpret crop conditions oriented for econ and policy communities Crops that are in other than favorable conditions are displayed on the map with their crop symbol & driver.


17 Crop Conditions Pie Charts by Crop as share of AMIS total production As Share of total AMIS Exports As Share of total AMIS Production Crop Conditions as of May 28 th, 2015


18 GEOGLAM Crop Monitor Partners > 35 Partners and Growing


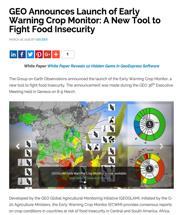
19 Operational Monthly Bulletin Since 2013 Published in the AMIS Market Monitor Strong collaboration between GEOGLAM and AMIS Bridging the gap between the EO and Econ communities First time the international community comes together to produce operational crop assessments


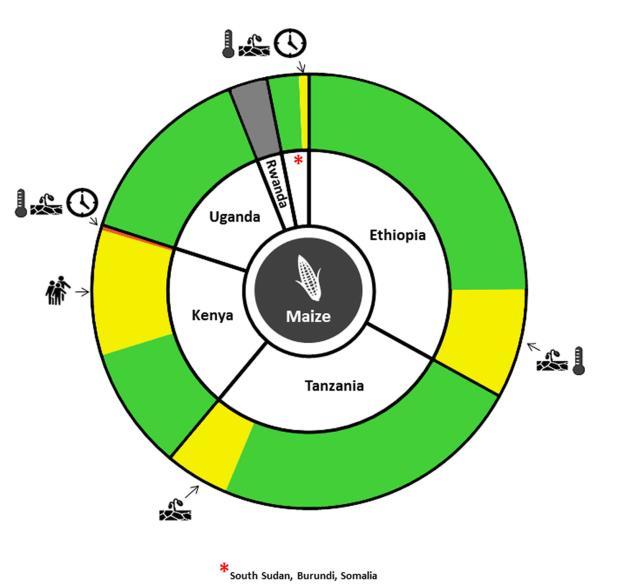
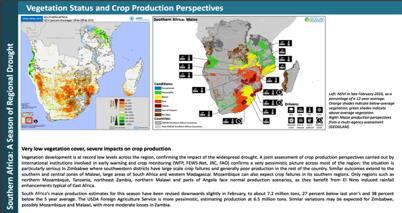
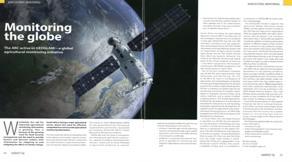
20 The Crop Monitor for Early Warning Focus on countries at risk of food insecurity Response to Early Warning Community Objective: build consensus & reduce uncertainty Current partners: USAID FEWS NET, WFP, JRC, FAO, ARC, ASIA RiCE, UMD Expanding to regional & national partners First bulletin published in Feb 2016 Already informing agricultural decisions News, press releases and official reports including joint press release by FEWS NET, JRC, WFP and FAO on current crisis in southern Africa 20

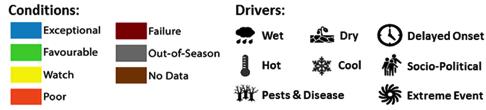
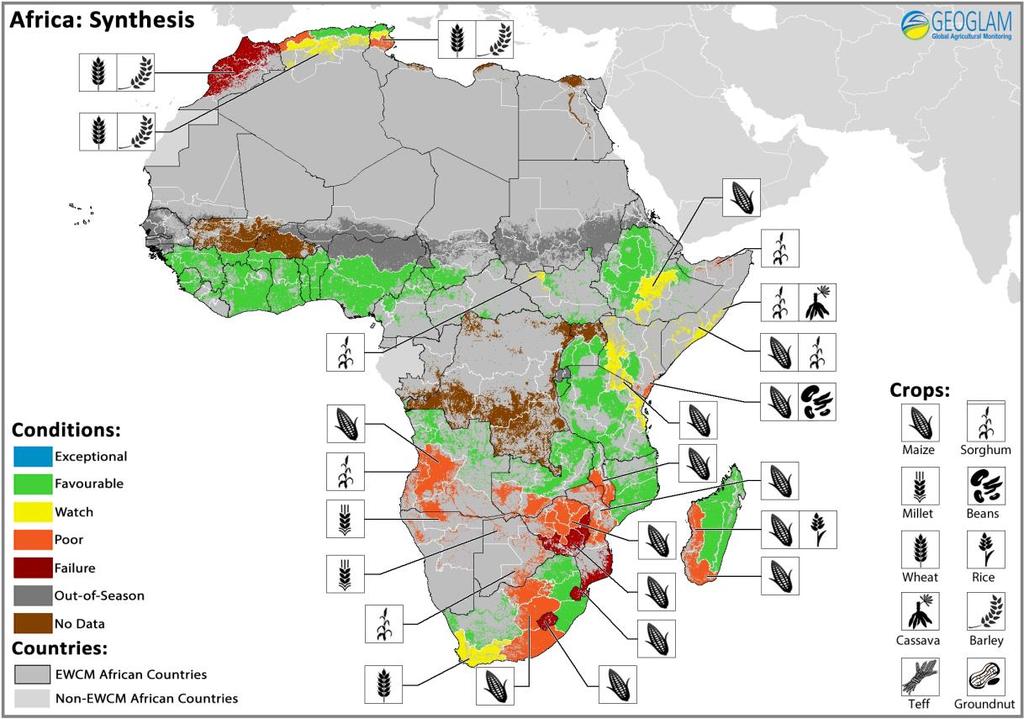

21 Africa May Assessment Maize East Africa Maize Southern Africa Maize Central America 21


22 In the news.. WFP VAM Report FEWS NET Special Report ARC, South Africa Financial Times Joint Statement 21

23 Countries Covered by Crop Monitors about 94% of world agricultural area


 Global")
")
24 New and Improved Global Data Sets Priorities for Cropland Mapping (EC SIGMA) Best Available Crop Type (UMD) Field Size Distribution (IIASA) Best available cropland mask (EC SIGMA) Growing Season & Crop Calendars (UMD) Global Cropping Intensity (China CropWatch) Cloud Cover (UMD) Global cropping intensity, / 14
 www.geo-rapp.")
25 Several Regional & Global Initiatives Launched Asia RiCE: focus on rice area and yield estimation in Asia Led by Japan (JAXA) in collaboration with ASEAN +3 countries, India, France, IRRI, MRC AFSIS, UN-ESCAP and others RAPP: Rangelands and Pasture Productivity Initiative: developing a global monitoring system Led and supported by Australia (CSIRO) China CropWatch: Serve as a science-based Chinese voice on global food security perception Led by China (CAS, RADI)


26 National Capacity Building: Tanzania Example
27 GEOGLAM R&D Component The implementation of any operational monitoring system requires an ongoing, user-driven, research component Develop best practices Incorporate new data streams and computing technology Develop and enhance models Linking with relevant communities Carried out through a number of large programs and projects including: JECAM (led by Canada AAFC and UCL Belgium) SIGMA (EC funded, VITO led consortium) Sen 2 Agri- (ESA funded, UCL led) MuSLI (NASA & ESA funded- multiple projects) STARS (BMGF funded, CIMMYT, ICRISAT, UMD, ITC led) RAPP & Asia Rice In collaboration with research and information initiatives Including: LTAR, AgMIP, GYGA, GSARS
28 GEOGLAM Research Agenda and Priorities Robust & scalable algorithm development In season area estimates Yield forecasting Early warning for countries at risk Impacts of extreme events Land use change planted crops, growing seasons, expansion & abandonment Yield gap where, why & how to increase food production Production vulnerability under current /future climate Successful resilience and adaptation strategies Innovation in data collection technologies especially small-holder systems Integration with market early warning models and systems Big (open) data, compute technologies > game changer for agricultural monitoring
 Representing diversity of global agricultural systems Coordination with international space agencies CEOS & private sector")
29 JECAM: Joint Experiment for Crop Assessment and Monitoring A Global Research Platform for Agricultural Monitoring R&D international network with over 30 sites, working on common research questions (crop area, condition, yield, scaling up from field, regional to national ) Representing diversity of global agricultural systems Coordination with international space agencies CEOS & private sector Developing data requirements, coordinating acquisitions and data sharing licenses (DEIMOS, FenYung, Radarsat-2, Pleiades, SPOT 5, RapidEye, Sentinel-1&2, Landsat ) Developing linkages with AgMIP, LTAR sites and other R&D networks Program Office led by AAFC- Canada and UCL-Belgium


30 Developing Automated User Ready Products: Crop condition, type, & area Sen2-Agri ESA Project Project Key Users EARLY AREA INDICATOR


31 Rice: early stage Rice: tillering stage Rice: reproductive stage Rice: maturity stage Non rice (forest, other LULC) Water (ocean, river, aquaculture) Land outside the Vietnam Mekong delta Rice monitoring & Damage Assessments: Mekong Delta Winter-Spring Rice 2015/16 March 2016: 1.4 Million ha rice March 2015: 1.7 Million ha rice 16.5% loss in rice area due drought and salt water intrusion caused by El Nino people affected, 67 Mil. $ estimated damage The Mekong Delta, Vietnam 300 km x 300 km 20 m resolution Based on uprecedented ESA S1 timeseries (radar data)

 Hansen et al.")
32 Land-use Change: Forest to Agriculture Example from Mexico: , (30m) Hansen et al. 2014


 Hansen et al.")
33 Land-use Change: Forest to Agriculture Year of conversion to agriculture Year of conversion: (30m) Hansen et al. 2014


34 Crop Type Identification, 30 meter resolution Ames Iowa, USDA National Agricultural Statistical Service (NASS) National level, annual product Example from Ames Iowa- US Corn Belt Critical for: Crop Area Estimation Crop Rotations Yield assessments and forecasting Yield gap Insurance Interventions and impact assessments
35 Forecast Production (MMT) Forecast Production (MMT) Forecast Production (MMT) Forecast Production (MMT) Forecast Production (MMT) Forecast Production (MMT) Yield Forecasting at National Scale Ukraine winter wheat US winter wheat production China winter wheat Official Production MMT Official Production MMT Official Production MMT Canada winter wheat Canada spring wheat Australia wheat Reliable forecasts (~ 10% error) 1.5 months prior to harvest for primary wheat production and export countries. Based on free, publically accessible data Official Production MMT Official Production MMT Official Production MMT Becker-Reshef, & Franch


36 Yield Forecasting at Field Scale Example: Indo-Gangetic Plains Average wheat yield 6 t/ha 4 t/ha 2 t/ha Jain and Lobell, in prep
37 With new field-scale yield data, can ask How does yield vary through space & time? (leading to improved crop specific risk assessment) How big are yield gaps? What causes yield losses? What are sources of recent yield gains? Which interventions are working best? When should insurance be triggered? Average within-county difference between corn yields on best and worst soils in U.S., based on SCYM yields Lobell and Azzari, in review
38 In Summary Bottom- up & top down, open initiative Platform for multi-lateral and bilateral cooperation Strong G-20 countries support Major contributions from many countries and international agencies Thank you! In-kind, secondments, large project funding and R&D calls Producing relevant information for food security and market stability Focus on user driven R&D & technology transfer Methods testing and inter-comparisons- developing best practices Strengthening national systems Developing linkages with relevant research platforms and initiatives
39 Final Thoughts International recognition need for more reliable, timely, transparent production information from field to the global scale to inform local to global decisions, interventions and policies informing & stabilizing markets, early warning of potential food shortages, damage assessments monitoring progress towards needed agricultural intensification to meet global food needs sustainably Science, data, and technology are rapidly advancing Revolution in cost and availability of satellite data and technology transforming our monitoring, forecasting and assessment capabilities Clearly geospatial EO one piece of puzzle- strengthen partnerships with relevant initiatives and programs Global challenge that can only be addressed through International collaboration and partnerships, across countries, organizations, sectors, and disciplines Innovation in science and technology Open sharing of data, information, methods and experiences Look forward to advancing and growing participation in this international initiative to deliver science-driven, actionable information further exchanges and a mutually beneficial relationship with the broader G-20 science community

40 Thank You Contact: Inbal Becker-Reshef
41 Russia Forecast Example: case for more timely information needed Year of major Drought in Russia resulted in 30% grain loss ~80% increase in price Harvest Final Estimate
 July 15th, 2012")
42 High Value for Crop Condition Monitoring Example 2012 Droughts: Crop NDVI Anomaly relative to Average ( ) July 15th, /31/2016