The Five R s or Environmental Responsibility: Refuse, Reduce, Reuse, Recycle, ROT
|
|
|
- Gerard Walsh
- 5 years ago
- Views:
Transcription

.")


 or polyester, the same polyester that competes with cotton in world fiber")
1 Weekly Publication of Cotton Association of India Edited & Published by Amar Singh 2015 No th February, 2015 Published every Tuesday Cotton Exchange Building, 2nd Floor, Cotton Green, Mumbai Phone: Fax: cai@caionline.in The Five R s or Environmental Responsibility: Refuse, Reduce, Reuse, Recycle, ROT With a Ph.D. in Agricultural and Resource Economics from Oregon State University in the USA, Dr. Terry Townsend is a consultant on commodity issues. He is currently working with the African Cotton and Textile Industries Federation (ACTIF). He served as executive director of the International Cotton Advisory Committee (ICAC) and has also worked at the United States Department of Agriculture for five years, analyzing the U.S. cotton industry and editing a magazine devoted to a cross-section of agricultural issues. By linking worldwide data on solid waste, population density, and economic status, Jenna R. Jambeck and co-authors writing in the Journal Science estimated that 275 million metric tons of plastic waste were generated worldwide in 192 coastal countries in 2010, with 4.8 to 12.7 million tons entering the ocean (Science 13 February 2015: Vol. 347 no pp ). The authors noted that world plastic production increased by 620% in the last 40 years, and without waste management infrastructure improvements, the cumulative quantity of plastic waste available to enter the ocean from land is predicted to increase by an order of ten by The word, plastic is an umbrella term used to describe a variety of molecules, including polyethylene terephthalate (PET) or polyester, the same polyester that competes with cotton in world fiber markets. There are about 45 different types of plastic, but six types account for the bulk of plastic production. Many containers are numbered on the bottom to indicate their molecular structure: Plastic #1 is PET, used in soda and water bottles and clothing. This is the most common form of polyester used in textile fibres. Plastic #2 is High Density Polyethylene (HDPE), used in soap bottles and milk jugs. Plastic #3 is Polyvinyl Chloride (PVC) (often known as vinyl), used in outdoor furniture, shrinkwrap and water bottles. Plastic #4 is Low Density Polyethylene (LDPE), used in produce bags and food containers. The little plastic bags used in markets are made from LDPE, and these bags often become contaminants in seed cotton. Plastic #5 is Polypropylene (PP), used in bottle caps and food containers. PP competes directly with many natural fibers, including jute, sisal, hemp and coir in rope and bagging applications, and PP is a major source of contamination in cotton because of its use in fertilizer and food bags that are often used by farmers in developing countries as seed cotton sacks.

2 2 24th February, 2015 Cotton Statistics & News Plastic #6 is Polystyrene (PS), used in packaging and foam cups. Plastic #7 is all other types of plastic polymers with a variety of uses. As reported in CNN, nearly every piece of plastic ever made still exists, regardless of whether it has been recycled. (Madison Park, CNN, February 12, 2015) While recycling programs have grown in recent decades, most trash ends up in the environment because plastic does not degrade, even after hundreds of years. The problem is particularly acute in developing countries with large populations because of weak systems of collection, disposal and safe long term storage of waste. Developed countries can afford organised systems of municipal door-to-door garbage collection, combined with incineration or safe disposal in landfills. However, most developing countries cannot afford such systems outside of major urban areas and therefore, the vast majority of plastic products used in developing countries end up as pollution in local, national and even world environments. Anyone who has traveled in rural areas of developing counties is probably shocked by the quantity of plastic waste that has accumulated just in recent decades. In the United States, recycling grew from essentially zero in the 1960s to account for 35% of all solid waste generated in 2012 (United States Environmental Protection Agency). Nevertheless, the amount of garbage added to the environment in the United States grew from 88 million tons in 1960 to 251 million tons in 2012 because population and income growth caused consumption to increase faster than recycling efforts, and because more synthetic materials were invented to replace natural ones. Non-cellulosic fibres contribute to the load of trash weighing on the world s environment, and the molecules in these fibres are not biodegradable. Polyester, nylon, acrylic and other non-cellulosic fibres are made from petroleum and rather than decomposing, these fibres break down into smaller and smaller pieces until they are too small to be seen by the naked eye. Eventually, these small pieces find their way into waterways and food supplies, damaging ecosystems, harming animals, contaminating food supplies and leading to chemical leaching. World production of polyester totaled more than 60 million metric tons in 2012, including 41 million tons of polyester staple and filament, almost all of which goes into textile products, and 23 million tons of film used to make bottles and other consumer products (PCI Fibers and Raw Materials). The polyester industry has put a heavy stress on recycling PET bottles, and they are the second most recycled material behind aluminum. However, polyester cannot be recycled endlessly, and there is leakage in even the most robust recycling programs. Further, only a small percentage of polyester, nylon, acrylic and other non-cellulosic fibers used in textile applications are recycled. Eventually, every molecule of polyester and the other oil-based fibres ends up in the environment somewhere. Some environmental activists, retailers and advocates of organic cotton have demonised the cotton industry for decades by exaggerating or misstating pesticide and water use, by misrepresenting labour issues, by overlooking the contribution of cotton to food security and by ignoring or minimising the economic and social benefits of cotton production. Rarely, if ever, do those who demonise cotton, mention the negative impacts associated with polyester production and disposal. This may be changing as even the most ardent activists are beginning to dimly perceive that the alternative to cotton is polyester, not organic fibres. And, as more attention is paid to the attributes of polyester, the issue of biodegradability will rise in importance. A cow feeds on plastic bags and other garbage along a stream in New Delhi, India. DavidGuttenfelder/Associated Press. Environmentalists have advocated the three R s of Reduce, Reuse and Recycle since the 1970s at least. But more recently, environmentalists have expanded their admonition to encourage

3 Cotton association of india 24th February,
 what s left.")

4 4 24th February, 2015 Cotton Statistics & News consumers to follow the Five R s: Refuse, Reduce, Reuse, Recycle and Rot ( com, Is Recycling Worth It?). Refuse what you don t need, Reduce what you do need, Reuse by avoiding disposables and buying secondhand, Recycle what you can t reuse, and Rot (compost) what s left. For all of cotton s problems with resource use, labour issues and health concerns, at least cotton and almost everything used to produce it are fully biodegradable. All the pesticides used in cotton production are biodegradable, all the fertilizers are natural substances themselves (nitrogen is a greenhouse gas and efforts must continue to reduce emissions; phosphate and potassium are natural substances that do not leach or evaporate), and water is obviously natural. In developed countries, fuel is used to power machinery, but every other input in cotton production can rot or is natural itself. In sum, when the full environmental load imposed by polyester production, use and disposal is considered, cotton has an insuperable advantage in that it can rot. Cotton does not become marine waste. Cotton does not foul waterways or roadsides. Cotton does not pollute soil. Cotton goes away. In a world moving toward more than 9 billion people and increased environmental stress, natural fibres will always have a place in the world economy. A Chinese boy jumping over trash.
 project, COTAAP has facilitated procuring of clean cotton from beneficiary farmers while Arvind")


5 Cotton association of india 24th February, Cotaap Corner 1. Allotment of incentives to farmers : As an important component of an Public Private Partnership (PPP) project, COTAAP has facilitated procuring of clean cotton from beneficiary farmers while Arvind Limited, Ahmedabad has provided funds for giving incentive to the farmers against the supply of clean cotton. As the harvesting of cotton is in its last phase in this area, all procurement schemes have been completed. About 5000 quintals of cotton have been purchased under this activity. As a part of promoting clean cotton harvest at the field level, a clean cotton harvest incentive has been provided to the farmers at the rate of Rs.75 per quintal. To date, more than 400 farmers have benefitted from this scheme. This initiative is an attempt to encourage farmers to supply contamination-free cotton and has dual benefits it promotes good post-harvest practices that bring better returns to the farmers and supply cleaner cotton to industry. 2. Collecting feedback from beneficiary farmers: about the impact of COTAAP schemes at the field level and also helps to understand the status of the farmers insofar as productivity is concerned in the current year. As the harvesting of cotton is in its last phase, the COTAAP staff has already started data collection by using feedback forms. 3. Celebration of Farmers Day : Under the Public Private Partnership for Integrated Agricultural Development (PPP-IAD) project, the COTAAP unit at Chopda conducted 10 Farmers Field Schools (FFS) in 10 villages in the tehsil during the year. The main objective of this scheme was to train 30 farmers on an actual farm and accordingly COTAAP conducted 19 trainings in 19 weeks, as per the guidelines set by Govt. of Maharashtra s Dept. of Agriculture. Also according to the guidelines, the termination of the FFS scheme had to be done by celebrating Farmers Day in the 20th week. Thus, Farmers Day was celebrated in 10 villages from 15th to 25th January Officials from the Agriculture Department attended all the events. The Krushi Darshani Diary for the year 2015, published by the Mahatma Phule Agriculture University, Rahuri, was distributed to the participating farmers. The COTAAP unit at Chopda is effectively providing agricultural extension services to farmers since the past nine years in the Chopda area. Cotton farmers are facing new challenges every year, and COTAAP on its part has always tried to support them by providing them solutions for their problems by implementing different schemes. In order to evaluate the impact of these activities, COTAAP provides feedback forms to farmers, where they are expected to provide information about all their components of cost of production and yield of cotton on their demonstration plot under scheme, etc. Evaluation of all the data collected from the farmers gives a clearer picture


6 6 24th February, 2015 Cotton Statistics & News REVIEW OF 2013/14 Summary The 2013/14 season began with global cotton stocks estimated at a record 17.1 million tons, up 18% from 2012/13. The season-average Cotlook A Index increased 3% to 91 cents per pound in 2013/14, rebounding from the fall in prices observed in the last two season. Poor returns in 2012/13 and higher prices for competing crops at planting time in the Northern Hemisphere, where 90% of cotton is produced, drove cotton farmers to plant less cotton in 2013/14. Consequently, cotton area receded 4% to 32.7 million hectares, and production fell by just 2% to 25.9 million tons in 2013/14 due to a 1% improvement in the world average yield to 792 kg/ha. After a season of 4% growth in 2012/13, demand for cotton by spinners was unchanged at 23.5 million tons in 2013/14, which is the second smallest in ten years. Despite the decrease in production, world ending stocks jumped 14% to 19.6 million tons, setting a new record. The global stocksto-use ratio rose from 73% in 2012/13 to 83%, the highest level since World War II. World cotton trade contracted by 10% to 9 million tons as Chinese imports dropped by 31% from 4.4 million tons in 2012/13 to 3.1 million tons in 2013/14. Shipments to the rest of the world increased 9% from 5.4 million to 5.9 million tons. Introduction World cotton production fell 2% to 25.9 million tons in 2013/14 after reaching a record of 27.8 million tons in 2011/12, slightly above the previous record set in 2004/05. The decrease in production was driven by reduced plantings, in reaction to lower prices received by cotton farmers in 2012/13. World cotton area shrank 4% to 32.7 million hectares in 2013/14. The average yield improved by 1% to 792 kg/ha in 2013/14. Cotton yields increased in three of the five largest producing countries, Brazil, China and India by 4%, 3%, and 9% respectively, while yields declined 4% in Pakistan and 7% in the U.S.A. The global production decrease in 2013/14 was driven mainly by China, where the crop dropped to 6.9 million tons from 7.3 million tons the previous year. The U.S.A. also experienced a tremendous decline in production to 2.8 million tons, 25% less than in the previous year. Production in Australia, Turkey and Uzbekistan dropped 105,000 tons, 60,000 tons and 20,000 tons respectively for a second season. In contrast, production in Brazil rose by 30% to 1.7 million tons, in India by 9% to 6.6 million tons and in Pakistan by 4% to 2.1 million tons. Production in Francophone Africa was little changed in 2013/14, reaching 934,000 tons. World cotton consumption remained stable in 2013/14 at 23.5 million tons. Higher cotton prices for most of the season offset the 3% gain in the global GDP. All but three of the ten largest consuming countries expanded mill use in 2013/14. Consumption in China, the world s largest consuming country, contracted 9% to 7.5 million tons and in Pakistan by 6% to 2.3 million tons. Brazil s consumption remained stable at 889,000 tons. Notably, India, Turkey and Bangladesh saw consumption grow to 5 million tons, 1.4 million tons, and 900,000 tons, respectively. In 2013, the share of cotton in global textile fiber end-use fell to 28%, continuing its downward trend for the fifth year.

7 Cotton association of india 24th February,
 increased by 9% to 5.")

8 8 24th February, 2015 Cotton Statistics & News In 2013/14, the volume of cotton traded internationally contracted by 10% to 9 million tons, though still above the 10-year average of 8.1 million tons per season. The high trade volume was sustained by a total shipment of 3.1 million tons of cotton to China. Shipments to other countries (world less China) increased by 9% to 5.9 million tons for the second season, further reducing China s share of imports from its record of 55% in 2011/12. Exports from the U.S.A. fell 22% to 2.3 million tons, accounting for 30% of world cotton exports in 2013/14. Exports from Australia and Brazil dropped 21% to 1.1 million tons and 48% to 485,000 tons respectively. India, on the other hand, saw exports rise 20% to 2 million tons. The global stocks-to-use ratio jumped to a new record of 83% in 2013/14, the highest level since World War II. In China, the stocks-to-use ratio jumped from 116% to 160%, its highest level on record. Outside China, the stocks-to-use ratio remained unchanged from 2012/13 at 30%. The season-average Cotlook A Index increased 3% to $0.91/ lb in 2013/14. Despite the decrease in world production in 2013/14, the value of world cotton production remained at $51 billion due to higher international cotton prices in 2013/14. In 2013/14, global cotton production exceeded consumption by 2.4 million tons. Following three consecutive seasons of surplus, global cotton stocks jumped 14% to 19.6 million tons, surpassing the previous record. The gain in world stocks is accounted for by China. At a record of 12.1 million tons in 2013/14, China s ending cotton stocks rose 26% while stocks in the rest of the world decreased by 1% to 7.5 million tons.
9 Cotton association of india 24th February, Last Season of Stockpiling by the National Cotton Reserve in China In 2013/14, China was the world s largest producer, consumer, and importer of cotton, accounting for 27% of world production, 32% of the world s consumption, and 35% of world imports. Chinese cotton area declined from 6.3 million hectares in 2007/08 for three consecutive seasons to 5.2 million hectares in 2010/11 due to lower revenues received by farmers and the increased attractiveness of competing crops. The sharp rise in seedcotton prices in 2010/11 reversed the downward trend, and cotton plantings in China rose by 7% to 5.5 million hectares in 2011/12, but then cut 10% to 5 million hectares in 2012/13. In 2013/14, area decreased further to 4.6 million hectares. Despite the official announcement of unlimited reserve procurement at 19,800 RMB/ton ($1.50/lb) in 2011/12 and at 20,400 RMB/ton ($1.47/lb) in 2012/13 and 2013/14, production shrank as grains became more profitable and production costs rose (labor in particular as farm workers are migrating to cities searching for urban employment). In 2013/14, weather varied across the many cotton regions in China, but was generally favorable during the growing season. The average yield increased by 3% to 1,506 kg/ha. Production fell 5% from 7.3 million tons in 2012/13 to 6.9 million tons in 2013/14. All of the five largest producing provinces saw losses in production in 2013/14, though in Xinjiang, the largest producing province in China, production declined by only 1% to 3.5 million tons. Between September 2013 and March 2014, the China National Cotton Reserve Corporation bought a total of 6.3 million tons of cotton, or 91% of the 2013/14 Chinese cotton crop, and 41% of the purchases came from Xinjiang. The China Cotton Index averaged 19,424 yuan/ton ($1.44/lb) for the season through the end of March Since then, the China Cotton Index steadily declined to 17,139 yuan/ton ($1.26/lb) at the end of 2013/14 due to the end of reserve purchases for the season and the announcement earlier in the year that China was making its cotton policy more market-oriented. After exceeding 10 million tons in 2006/07, 2007/08, and 2009/10, cotton consumption in China has trended down. Several factors affect the competitiveness of its textile industry, including rising production costs (labor, energy and credit), labor shortages, currency appreciation, and the high price of domestic cotton. In 2012/13, the lackluster economic situation in Europe and in the U.S.A. (the two major export destinations for China s textile products) and the continuing uncertainty of the government s domestic cotton policy and financial policy contributed to a reduction in cotton spinning activity in China. As a result, cotton consumption contracted 4% to 8.3 million tons in 2012/13. With higher international and domestic prices in 2013/14, consumption fell a further 9% in 2013/14 to 7.5 million tons. Unlike cotton lint which is subjected to the annual 1% tariff-rate import quota (TRQ) of 894,000 tons, there is neither quota nor tax on imports of cotton yarn. Thus, yarn imports have been on the rise, mostly from other countries in Asia. At the same time, Chinese textile manufacturers are switching to polyester at a rapid pace, further undermining the competitiveness of cotton. China imported 3.1 million tons of cotton in 2013/14, down from 4.4 million tons in 2012/13. The gap between domestic and world cotton prices stimulated a record import of 5.3 million tons of cotton in 2011/12. The Chinese government continued to stockpile its national cotton reserve with domestic and imported cotton in 2012/13 and 2013/14, maintaining the gap between prices. However, declining mill use in China has led to a reduction in imports. The U.S.A. is the largest cotton exporter to China, and U.S. shipments increased from 50,000 tons in 2001/02 to 1.3 million tons in 2011/12 during which India overtook the U.S.A., exporting 1.94 million tons of cotton to that destination. Indian shipments dropped below 1 million ton in 2012/13 while the U.S. shipments were close to the previous season s level. However, with record production in India and a 25% reduction in the U.S.A, India surpassed the U.S.A. again with India exporting over 1.1 million tons to China and the U.S.A., 575,000 tons. Other major suppliers of Chinese cotton imports include Australia, Uzbekistan, and Brazil. For the past five seasons, African countries contributed on average 10% of total exports to China. The top three
10 10 24th February, 2015 Cotton Statistics & News exporting countries were Burkina Faso, Cameroon and Mali. In late January 2014, the Chinese government announced that it would be implementing a target price program for cotton limited only to cotton grown in Xinjiang. At the time of this writing, it has not announced how it will handle the large volume of cotton stocks it holds, except to say that they would not be released unless to calm a rising market in a period of tightened supply. At its peak in March 2014, stocks in the Chinese cotton reserve were estimated to exceed 13 million tons. The government reduced the reserve through auction sales, but only 1.7 million tons were sold between March and the end of July 2014, which is about half the amount sold during the same time period last season. The government held an extended auction through the end of August, but only 330,000 tons were sold. In August 2014, the government cotton reserves stood at just over 11 million tons. At the end of 2013/14, the private sector in China was estimated to hold just under 1 million tons, and China s ending stocks for the season are estimated at 12.1 million tons, up 26% from the preceding seasons and more than sufficient for one year of use. China s stocks-to-use ratio jumped from 116% to 160% by the end of 2013/14 while the stocks-to-use ratio for the rest of the world was 30%, unchanged from 2012/13. (To be continued...) Source: COTTON: Review of the World Situation, September-October 2014 Cotton Yarn Production (In Mn. kg) Month (P) (P) April May June July August September October November December January February March Total P Provisional (Source: Office of the Textile Commissioner)


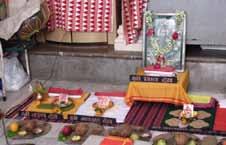

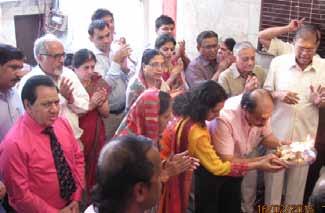


11 Cotton association of india 24th February, Glimpses of the Mahashivratri festival celebrated at the Bhid Bhanjan Mahadev Temple at Colaba on 17th February 2015
12 12 24th February, 2015 Cotton Statistics & News Sr. No. Growth Standard Descriptions with Basic Grade & Staple in Millimetres based on Upper Half Mean Length [ By law 66 (A) (a) (4) ] UPCOUNTRY SPOT RATES Grade Standard Grade Staple Micronaire Strength /GPT Spot Rate (Upcountry) Crop FEBRUary th 17th 18th 19th 20th 21st 1 P/H/R ICS-101 Fine Below mm (29800) (29800) (29800) (29800) (29800) 2 P/H/R ICS-201 Fine Below H mm (30300) (30300) (30300) (30300) (30300) 3 GUJ ICS-102 Fine 22mm (21900) (22000) (22000) (22000) (21900) 4 KAR ICS-103 Fine 23mm (27000) O (26700) (26400) (26000) (25900) 5 M/M ICS-104 Fine 24mm (28200) (27900) (27600) (27600) (27500) 6 P/H/R ICS-202 Fine 26mm (30200) (30500) (30700) (31000) (30900) 7 M/M/A ICS-105 Fine 26mm L (27000) (27200) (27400) (27600) (27400) 8 M/M/A ICS-105 Fine 26mm (27400) (27600) (27800) (28000) (27800) 9 P/H/R ICS-105 Fine 27mm (30500) I (30800) (31000) (31300) (31200) 10 M/M/A ICS-105 Fine 27mm (27900) (28100) (28300) (28500) (28300) 11 M/M/A ICS-105 Fine 27mm (29000) (29200) (29400) (29600) (29400) 12 P/H/R ICS-105 Fine 28mm D (30900) (31200) (31400) (31700) (31600) 13 M/M/A ICS-105 Fine 28mm (30000) (30200) (30400) (30600) (30400) 14 GUJ ICS-105 Fine 28mm (30200) A (30400) (30600) (30800) (30600) 15 M/M/A/K ICS-105 Fine 29mm (30500) (30700) (31000) (31200) (31000) 16 GUJ ICS-105 Fine 29mm (30700) Y (30900) (31100) (31300) (31100) 17 M/M/A/K ICS-105 Fine 30mm (31400) (31700) (32000) (32200) (32000) 18 M/M/A/K /T/O ICS-105 Fine 31mm (33400) (33400) (33400) (33600) (33400) 19 A/K/T/O ICS-106 Fine 32mm (34400) (34400) (34400) (34600) (34400) 20 M(P)/K/T ICS-107 Fine 34mm (42000) (42000) (41500) (41500) (41000) (Note: Figures in bracket indicate prices in Rs./Candy) (Rs./Qtl)