SUPPLY MANAGEMENT QUALITY. WATER, AGRICULTURE & FOOD Opportunities and Challenges
|
|
|
- Magdalene Hardy
- 5 years ago
- Views:
Transcription
1 SUPPLY MANAGEMENT QUALITY WATER, AGRICULTURE & FOOD Opportunities and Challenges


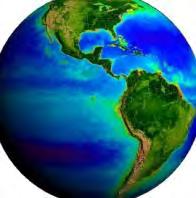
2 Water and Alberta s Agriculture Industry Alberta is at a water management crossroads, and critical decisions are needed to determine the right path to follow. Agriculture needs to be an important consideration in those decisions.
3 Annual River Discharges and Use Total outflow from Alberta s rivers is about 105 million acre-feet per year. Total volume withdrawn 3.8 million acre-feet (3.6%). Total volume consumed 2.1 million acre-feet (2%). Bow River River South Saskatchewan River
4 Alberta Watersheds Hay River Watershed Peace River Watershed Athabasca River Watershed Beaver River Watershed North Saskatchewan River Watershed South Saskatchewan River Watershed Milk River Watershed Transfer of water between these watersheds is not allowed without special provincial legislation. Bulk export of water is also not allowed.


5 Major Alberta Watersheds Agricultural land Hay River Watershed Peace River Watershed Athabasca River Watershed Beaver River Watershed North Saskatchewan River Watershed South Saskatchewan River Watershed Milk River Watershed

6 Consumed Water in Alberta 15% 5.4% 4.3% 71% 97.5% of consumptive use is from surface water. 2.5% of consumptive use is from groundwater. Currently 500,000 domestic wells in Alberta. About 7,000 new wells are added each year.
7 Groundwater We understand much less about our groundwater resources than our surface water resources. Groundwater is an important resource for Alberta s agriculture industry and rural residents.

8 Groundwater Well Distribution

9 Groundwater Reliance Percent volume licenced as groundwater


10
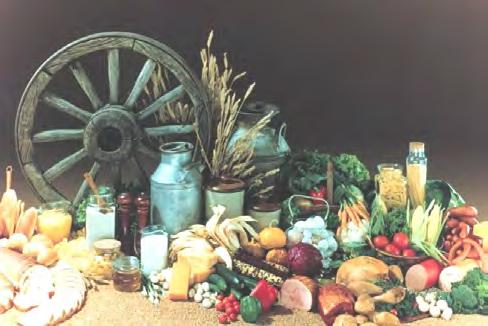
11 Agriculture and Food Production Before organized agriculture, the earth could feed only about 600 million people. The Earth s population is currently about 6.5 Billion a 10-fold increase. This population is expected to increase to 9.2 Billion by 2050.
12 Future World Food Requirements World food requirements could double in the next 40 years. Population will grow from 6.5 Billion to 9.2 Billion. Per capita food consumption will increase.
13 Per Capita Food Consumption ( ) 3500 Kcal World Developed Countries
14 Future World Food Requirements World food requirements are expected to double in the next 40 years. Population will grow from 6.5 Billion to 9.2 Billion. Per capita food consumption will increase. Significant changes in diet.


15 Changing Diets There is a shift towards more animal protein in the developing countries. Per capita meat consumption in developing countries is expected to increase from 26 kg. in 1997/98 to 37 kg. in This is a result of increasing economic development and per capita incomes.


16 Implications to Cereal Production 1 kg of chicken meat requires: 3 kg of grain equivalents; 1 kg of pork meat requires: 5 kg of grain equivalents 1 kg of beef requires: 8 kg of grain equivalents;
17 Water Requirements Product Unit Equivalent Water (m 3 /Unit) Cattle Head 4,000 Sheep and Goats Head 500 Fresh Beef Kilogram 15 Fresh Lamb Kilogram 10 Fresh Poultry Kilogram 6 Cereals Kilogram 1.5 Citrus Kilogram 1 Pulses, roots and tubers Kilogram 1
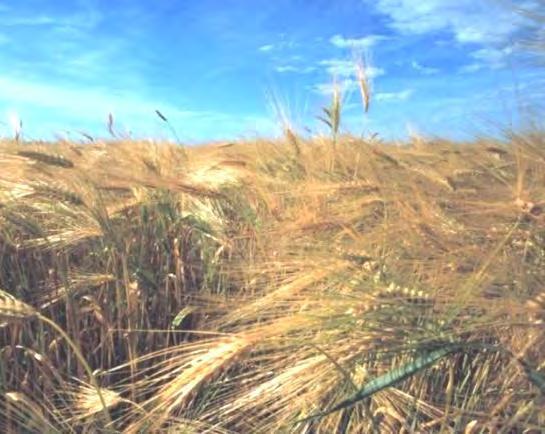
18 Food Production About 60% of the world s food is produced on rainfed lands. Significant increases in production on rainfed lands are difficult genetic engineering has not yet developed high yielding, drought-resistant varieties.


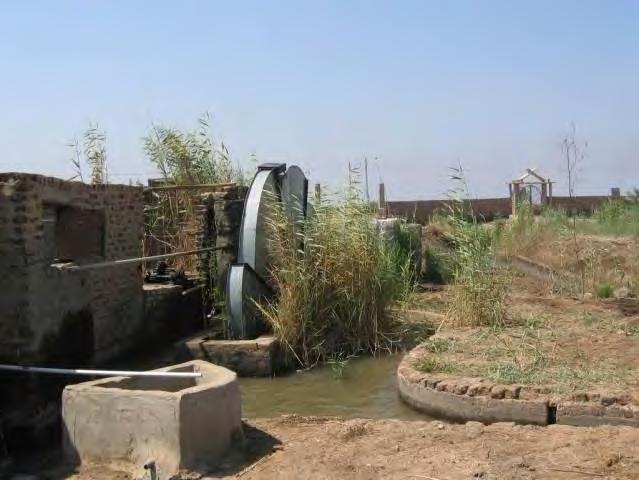
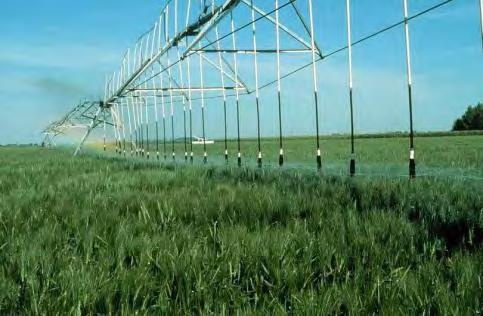
19 Irrigated Food Production About 40% of the world s food, and 60% of cereal production is from irrigated lands. Irrigation makes up about 17% of the total arable land base. It is estimated that up to 80% of future food requirements will be met by irrigation.


20 Land and Water Land was the major focus during the 20 th Century. Water will be the dominant focus of the 21 st Century.
21 Water Use In 1995, the human population withdrew 3,906 km 3 of water annually (31% of the readily available water). By 2025, withdrawals will increase by 22% to 4,772 km 3 (38% of readily available water). Withdrawals in developing countries will increase by 27%, while developed countries will increase by 11%. Global Water Outlook to 2025 Rosegrant et al 2002
22 Projected Water Scarcity in 2025 Physical water scarcity Economic water scarcity Little or no water scarcity Seckler et al, 2002
23 Planning For Food Food-poor but cash-rich countries are buying up agricultural rights in developing countries and bread basket countries. South Korea 99 year lease on 3.2 million acres in Madagascar. China 100,000 acres in Australia. Japan 500,000 acres in the U.S. Russia recently restricted exports of wheat.
24 Groundwater Use "Many of the most populous countries of the world - China, India, Pakistan, Mexico, and nearly all of the countries of the Middle East and North Africa - have literally been having a free ride over the past two or three decades by depleting their groundwater resources. The penalty of mismanagement of this valuable resource is now coming due, and it is no exaggeration to say that the results could be catastrophic for these countries, and given their importance, for the world as a whole" (Seckler et al., 1999, Director IWMI).
25 Groundwater Many countries currently rely on Fossil groundwater for irrigation. These groundwater resources are being depleted at an increasingly rapid rate. And once they are gone, they are gone forever.


26 Fossil Groundwater Use for Food Production Saudi Arabia 643% in excess of recharge Libya 712% in excess of recharge

27 The Ogallala Aquifer In the 1950s, the Ogallala irrigated 2.5 million acres. Today it irrigates 16 million acres.

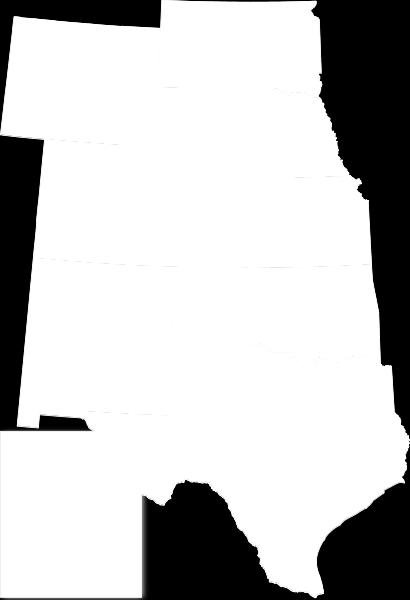
28 The Ogallala Aquifer
29 The Ogallala Aquifer* It underlies 174,000 square miles. Nebraska 64,400 sq. miles Texas 36,080 sq. miles New Mexico - <10,000 sq. miles Oklahoma - <10,000 sq. miles South Dakota - <10,000 sq. miles Wyoming - <10,000 sq. miles The aquifer contains 3.3 billion acre-feet of water. Alberta s total annual water supply from all rivers is about 0.1 Billion acre-feet. * M. V. Guru the Ogallala Aquifer July, 2000 (Kerr Centre for Sustainable Agriculture)
30

31 Alberta is positioned to play a major role in helping meet future world food needs.

32 Australia s Macquarie Agricultural Funds Management concludes that heroic efforts will be needed to feed a global population. those countries with a robust agricultural sector, sustainable farming practices, modern infrastructure, reliable water access, and safer political structures will increasingly become the global agricultural powerhouses.

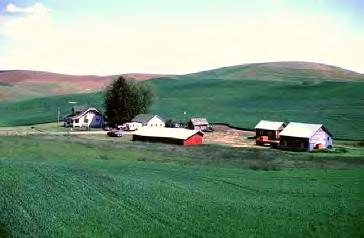
33 Production and Diversification Alberta s advantages: a large agricultural land base; a strong dryland agriculture; and a world-class irrigation system.
34 Production Potential Alberta has significant room to increase crop and livestock production in response to world markets. The agriculture industry needs access to adequate, good quality water to meet the potential of a growing world marketplace.

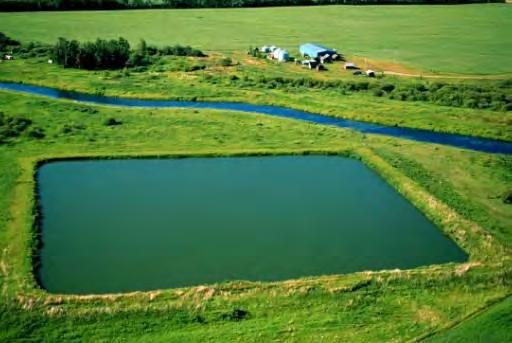
35 Water for Agriculture Household Rivers/Streams Livestock Dugouts Groundwater Irrigation
36 Alberta s Water Supply As a province, Alberta has an abundant supply of water.
37 Alberta s Water Supply Alberta has an abundant supply of water. However, water supplies aren t always in the right place, and at the right time.
38 Mean Annual River Discharges Edmonton River 5.14% Only 10% of the renewable water supply serves more than 90% of the province s population. Red Deer Calgary Bow Oldman R. Medicine Hat Lethbridge Milk 0.22% 1.4% 4.47% 1.53% 0.35% 0.24%
39 Water For Life Strategy Outcome Safe drinking water for all Albertans. About 500,000 Albertans depend on unregulated drinking water. Groundwater wells Streams and rivers Farm dugouts.

40 Water Availability Many areas of the province are chronically short of water. Alberta Water Pumping Program