SIA - Salmon Farming. June Bergen. Leroy Seafood Salmon Site SIA Group 1
|
|
|
- Alfred Marsh
- 5 years ago
- Views:
Transcription

1 SIA - Salmon Farming June 2018 Bergen. Leroy Seafood Salmon Site


2 Salmon is a fantastic product Source: Marine Harvest Healthy, Omega-3, vitamins Convenient, sushi, smoked Good taste, digestible 2
3 Very efficient and competitive (I) Lowest Feed Conversion Ratio 3
4 Very efficient & competitive (II) Low use of water and carbon footprint 4
 million tns")
5 We are talking about a tiny market Global production (weight equivalent) million tns
6 Strong global demand growth. Price neutral demand growth at historically 6-8%. Europe is the most developed market / Penetration in Emerging Markets still very low 6

7 But massive potential in Emerging Markets Source: Marine Harvest Q118. Salmon consumption per capita is highest in Europe. The US is catching up. But Emerging Markets are a massive source of future demand 7
8 Salmon consumption per capita in EU and China EU 2.1 kg/capita CHINA 0.1 kg/capita 8
9 Limited supply growth Farmed salmon is mainly produced in Norway and Chile, accounting for 75% of the total the rest in the UK, Faroe Islands, North America, New Zealand and Tasmania Natural Conditions Sea Water, protected location, fjords Sea currents Defined temperature (8-14 degrees Celsius) Industrial Conditions Concentrated industry Sanitary regulation Logistics 9

10 Geographical limits Only few geographical locations are suitable: only Norway and Chile with size 10

11 Salmon farming needs protected fjords 11

12 There are biological risks. Total biomass in the sea, sea conditions, number of players. A number of illnesses: sea-lice, infections, pancreas disease, anemia, algae bloom.. Chile had 2 large crisis in the past decade. Norway also learnt before. Strict sanitary controls are needed Sea-lice is a real issue for the industry 12
13 Regulation is a must Norway has one of the most restrictive sanitary conditions in the world of salmon farming. Maximum allowed biomass. License system. Traffic light growth model Chile developed a new model in

14 Limited supply: wild & farmed salmon Farmed salmon has been the solution. Until
 of 3% next few years")
15 limited supply growth Supply Growth: CAGR(e) of 3% next few years 15


16 Norway & Chile close to full capacity Norway: c50% of global salmon production Chile: c25% of global salmon production 16
17 Structural undersupply & higher prices. The sector struggles to grow supply & demand is very strong. Higher prices will balance supply and demand. High prices are here to stay, unless some tech revolution 17
18 It s not short term, it s a change of regime Changes of regime are not usual Salmon farming used to be cyclical, volatile and with mid-cycle returns around cost of capital The sector experienced a change of regime. Strong demand over the years coped with limited supply have led to higher prices. Salmon is scarce The sector makes 20% ROIC on average at current prices 70 NOK kg We will not be back to historical returns as 1) sector is structurally undersupplied and 2) costs have gone up by 50% in 6-7 years 18
19 A word on costs. When we started our analysis, back in 2011, costs per kg. were 20 NOK per kg, now at 33+ NOK per kg. Feed prices have substantially moved up. Sanitary issues are very costly on treatment costs Cost per KG. of salmon produced 19

20 Farmed salmon is now vegetarian Mix of salmon feed

21 Main risks? Technology Expensive Ocean farms On shore farming Genetics Slow Salmar OceanFarm 21
. 22")
22 Marine Harvest. The EGG concept. Closed system. Improves sanitary conditions. Capex, maintenance and opex still unclear Given 6 licenses (16 requested). 22

23 Atlantic Shapphire 350mn $ CAPEX Project in Florida 23

24 And many other less advanced projects. Number of projects but few real pilots. Marginal capacity. Higher CAPEX. Not a risk in the mid term, next 5y Sea cage project. Early times 24

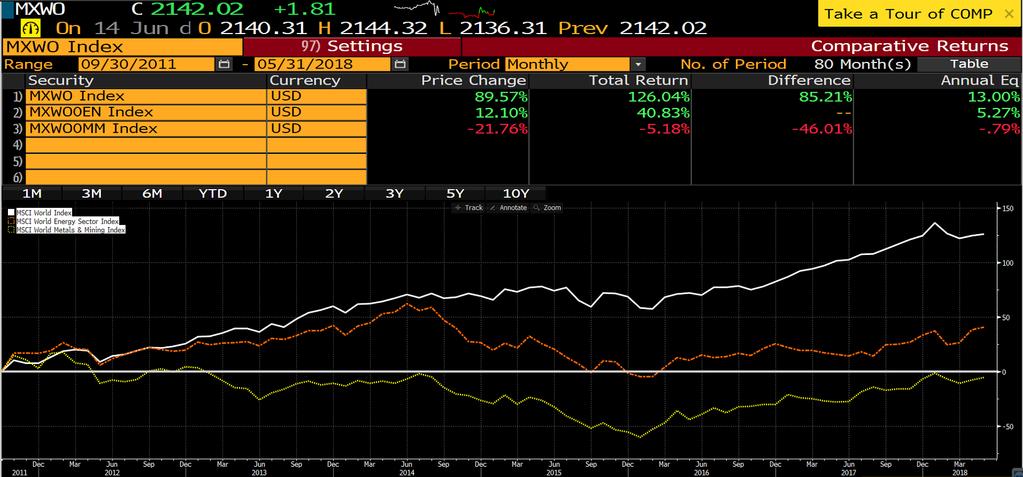
25 Shares have massively outperformed 25
26 But still cheap. PER (19) between 8.5x-14.5x. Bakkafrost 14.5x MHG 12.4x Leroy 10.3x NRS 9.3x Grieg 8.5x. Dividend Yield(s) 4-6%. Bakkafrost 4% MHG 6% Leroy 4% NRS 5% Grieg 5%. IRR s: 10-13%. Between 10-13% IRRs at normalised prices and returns Should you be the owner of one of these fish farms, would you sell it at a PER of 12x? 26

27 Counting the fish Q&A Session Bergen. Leroy Seafood Salmon Site March 18 27
28

29
30

31

32 2016 SIA Group