Improving Water Use Efficiency in Irrigated Agriculture in CARICOM
|
|
|
- Brice Pierce
- 5 years ago
- Views:
Transcription


1 Improving Water Use Efficiency in Irrigated Agriculture in CARICOM
2 CIFSRF CARICOM PROJECT RESULTS DISSEMINATION WORKSHOP Trinidad and Tobago March 05, 2012 C. A. Madramootoo, Raffaella M. P. de Carvalho, O. Homenauth, Melvin James, Kemuel Jn Baptiste 4
3 Water and Land Resource Management Develop and test innovative water conservation and modern irrigation practices to conserve water and reduce agrochemical contamination of soil and water Implement irrigation scheduling techniques to enhance water use efficiency


4 Field Research Sites Guyana Black Bush Polder Parika St Kitts Mansion Stapleton St Lucia Black Bay

5


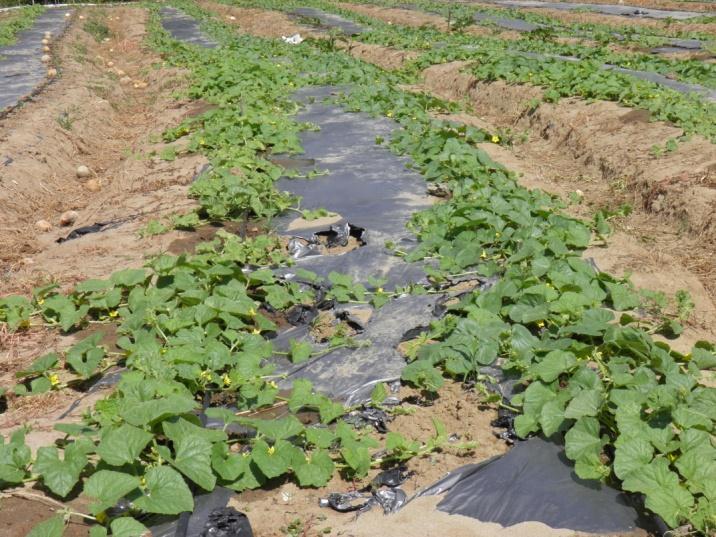
6 Cropping started in Guyana in March 2012 Cropping started in St Kitts in May-June 2012 Cropping started in St Lucia in November 2012

7

8
9 Yield (Kg/ha) Yield (kg/ha) on experimental sites - May to August Bora (kg/ha) Tomato (Kg/ha) Parika Black Bush Polder

10 Black Bush Polder

11 Percent % Major constraints Flooding - Major constraint Total Guyana St. Lucia St. Kitts Trinidad and Tobago 3 YES NO
12 Rainfall Depth (mm) Rainfall Time Series for 1956 to Albion Jan Feb Mar Apr May Jun Jul Aug Sep Oct Nov Dec Month of the year Average monthly rainfall from 1956 to 2004 Actual monthly rainfall for 2005 Average monthly rainfall from 2005 to 2011
13 Surface runoff Return flows (Q,L) Madramootoo Lab Soil Water Plant Dynamics Model IRRIG, PRECIP ET Active root zone Capillary fluxes Soil Water Reservoir Capillary fringe Leaching Fraction Interflow Percolation GW accretion Upward GW movement Subsurface drainage Return flows (Q,L)
14 Rainfall Depth (mm) Rainfall Time Series for 1956 to Albion 2012 cropping season superimposed Jan Feb Mar Apr May Jun Jul Aug Sep Oct Nov Dec Month of the year Average monthly rainfall from 1956 to 2011 Average monthly rainfall for 2012

15


16 ETcrop = ETo * Kc


17 Determination of the Soil Water Retention Curve Pressure plate apparatus Soil Water Plant Dynamics Lab
18 % VWC 65.0 Soil Water Retention Curve BBP1_00-15 BBP1_ %sand %silt %clay BBP1_30-45 BBP2_00-15 BBP2_ BBP2_ BBP3_ BBP3_ BBP3_ Pressure applied (bars) Average values
19 % VWC 60.0 Soil Water Characteristics Curve low range pressure Avg Avg Avg Field Capacity at 0.33 bars Pressure applied (bars) Avg00-30 Avg00-45
20 Depth (mm) Soil Water Plant Dynamics Model Simulations Monthly Rainfall, Runoff, Deficit and ETc for 2012 Rainfall Runoff Deficit ETc Jul Aug Sep Oct Nov Dec*
21 Depth of Water (mm) Soil Water Plant Dynamics Model Simulations Irrigation Schedule for September 2012 Surplus Deficit Daily Soil Moisture Field Capacity Allowable Soil moisture Deficit Aug September
22 Soil Water Plant Dynamics Model Simulations Monthly Summary - Rainfall, ET, Runoff and Deficit for 2012 Rainfall ETo ETc Perc Surplus Deficit Month mm mm mm mm mm mm Jul Aug Sep Oct Nov Dec* Total * Up to December 12, 2012
23 Irrigation Scheduling based on real-time soil moisture sensing


24 Decagon in-situ capacitance/frequency domain sensors
25 VWC % Decagon Pro-Check Soil Moisture Calibration Curve - Mansion y = x R² = y = 4E-07x x R² = RAW values
26 THANK YOU! ACKNOWLEDGEMENTS Dr Felix Jaria and Mr Kenton Ollivierre of the Brace Centre for Water Resources Management, McGill University. Mr Thomas Jackson, Mme Illis Watts, and Mme Raquel Welch of the St Kitts Department of Agriculture Mr Monero of the St Lucia Ministry of Agriculture. The farmers in the three countries for allowing us to conduct this research on their farms