Which of these pictures accurately shows the country of Jamaica?
|
|
|
- Patricia Cannon
- 5 years ago
- Views:
Transcription


1 Ch.9 - Development Which of these pictures accurately shows the country of Jamaica? The World is Divided between Relatively Rich and Relatively Poor countries.where? WHY? IMPACT.


2 What is Development? Process of improving the material conditions of people through diffusion of knowledge and technology Constantly improving health and prosperity of people Every country lies along the a continuum of development Divided up between MDCs and LDCs Three factors: economic, social, and demographic


3 HDI Human Development Index HDI #1 - Norway Configured by the United Nations Gross Domestic Product (economic, Literacy Rates, Level of Education (social), and Life Expectancy (demographic) combined to create HDI HDI ranges from United States is ranked #10 in the World HDI #192 - Niger
")
4 HDI (2005)
5 Economic Indicators of Development Economic Indicators: - Gross Domestic Product (GDP) - Types of Jobs - Productivity - Raw Materials - Consumer Good

6 Gross Domestic Product (GDP) Total output of good and service DIVIDED by Population Closely measures average yearly income in a country Does not look at distribution of wealth
7 Types of Jobs Primary Sector extract materials from earth through farming, mining, fishing, etc. - 60% in LDC; 5% in MDC Secondary Sector manufacturing that process, transform, and assemble raw materials into products - Increasing in LDC; Decreasing in MDC Tertiary Sector providing goods and service in exchange for money (retail, banking, education) - Limited number of jobs in MDC; Majority of jobs in MDC
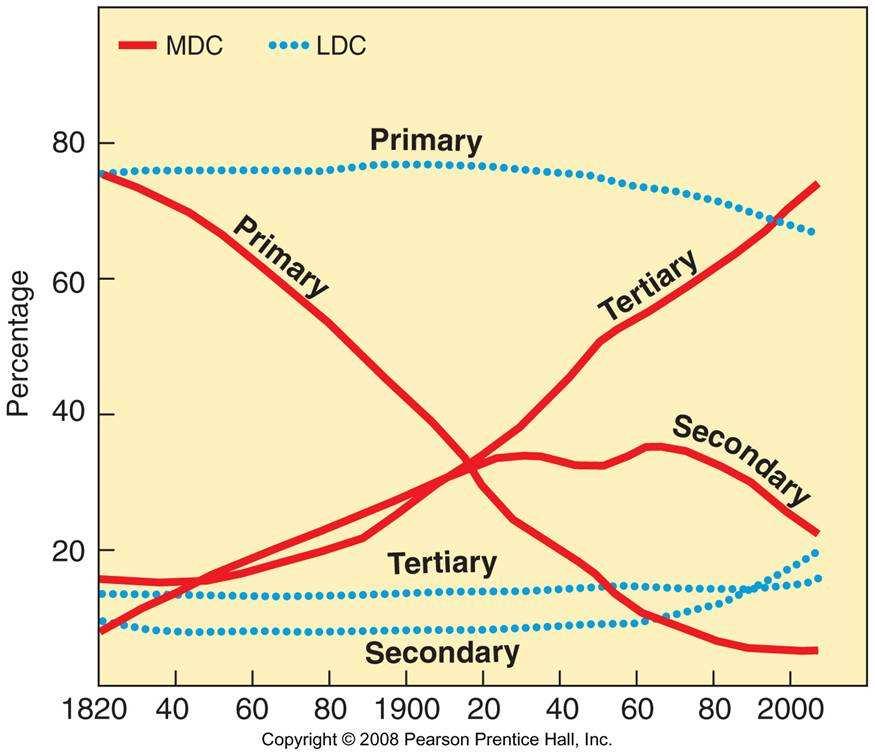
8
9 Raw Materials & Consumer Goods Raw Materials: - Wide Possession and Variety of raw materials led to Industrial Nations - Colonization - Development in LDCs depends on raw materials and demand (Ex. Oil) Consumer Goods: - Transportation and Communication sectors - Greater exposure to cultural diversity, social characteristics, etc. - Closing the gap in access to communication between MDCs and LDCs

10 Cell Phones per 1,000 persons

11 Social Indicators on Development Social Indicators: - Education/Literacy - Health/Welfare Health Clinic in Uganda

12 World Literacy Rates

13 Health Expenditure as % of GDP

14 Demographic Indicators of Development Demographic Indicators: - Life Expectancy - IMR - CBR/CDR - NIR Japan boost the highest life expectancy in the world (82.6 yrs)
")
15 Avg. Life Expectancy U.S.A. ranks #38 in the World (78.2 yrs)
 - Less Developed Regions Latin-America, Middle East, Sub-Saharan Africa, South")
16 - More Developed Regions Anglo-America, Western Europe, and Eastern Europe. Also includes the South Pacific and Japan (not regions) - Less Developed Regions Latin-America, Middle East, Sub-Saharan Africa, South Asia, East Asia, and Southeast Asia - The North-South Split
17 More Developed Regions: Anglo-America America (HDI 0.94): Natural Resources and Minerals Worlds Leading Consumers Success in Tertiary Job Sector World s s Largest Food Exporter Western Europe (HDI 0.93): Low NIR causing reliance on immigrant labor Economic Core Area see map on next slide Elimination of Economic Barriers with EU Eastern Europe (HDI 0.80): Declining HDI Dismantling of Communists System Benefit from EU Membership

18
19 Less Developed Regions: Latin America (HDI 0.80): Level of Development high along coastal cities High Agricultural Production Huge Gap in Income Distribution East Asia (HDI 0.76): Driven by China (1/3 of Worlds Economic Growth) Regional Economic Inequalities Straining Resources Management, Quality Control, Banking, and Legal Protection = WEAK Middle East (HDI 0.68): Reliance of Imports Large Percentage of Oil Gap between Countries with Oil and those Without Oil Low Levels of Literacy and Education amongst Women
20 Less Developed Regions: Southeast Asia (HDI 0.58): Geographical Obstacles Poor Soil, Volcanic Eruptions, Mountains, Typhoons, and Continuous Heat Cheap Labor Market Resources: Tin, Palm Oil, and Rubber South Asia (HDI 0.58): 2 nd Highest Regional Population & 2 nd Lowest Per Capita Income Unfavorable ratio of Resources to Population Large Service Market (think Customer Service Operators) Sub-Saharan Saharan Africa (HDI 0.51): Diamond Industry Poor Health and Education Levels Political Instability


21 GDI Gender Development Index GDI #1 - Norway Configured by the United Nations Uses same indicators as HDI, but its adjusted to reflect disparity between males and females GDI ranges from United States is ranked #10 in the World (identical to HDI) GDI #177 Sierra Leone
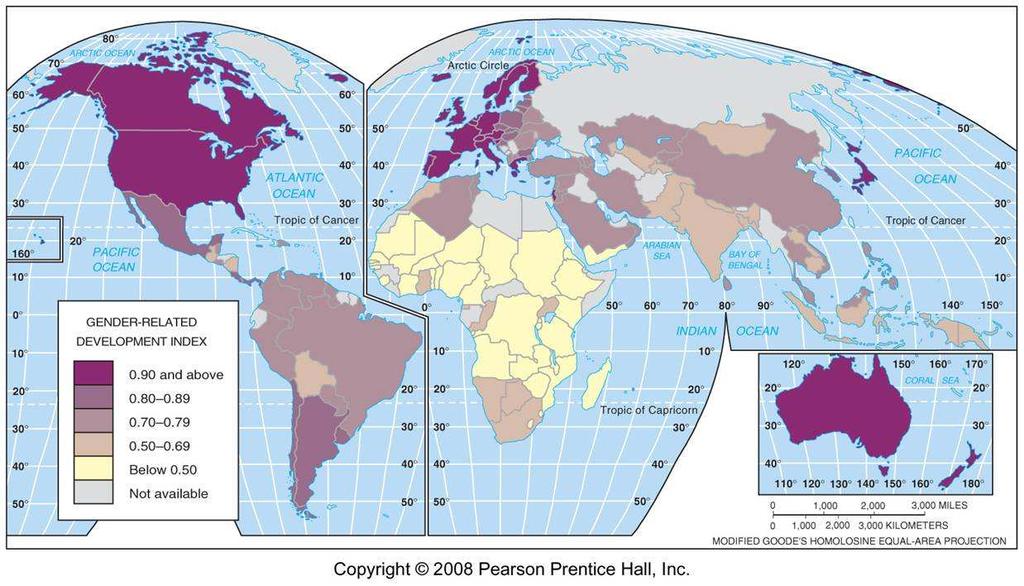
22 GDI
 Males $46,456 compared to")
23 World Income Gap U.S.A. (2003 Report) Males $46,456 compared to $29,017 for Females

24 Male vs. Female in Education

 GDI ranges from 0.00-1.")
25 GEM Gender Empowerment Measure GEM #1 - Sweden Configured by the United Nations Measure the ability of women to participate in achieving improvements Calculated by combining income, professional jobs, managerial jobs, and elected jobs) GDI ranges from United States is ranked #18 in the World GEM #110 Yemen
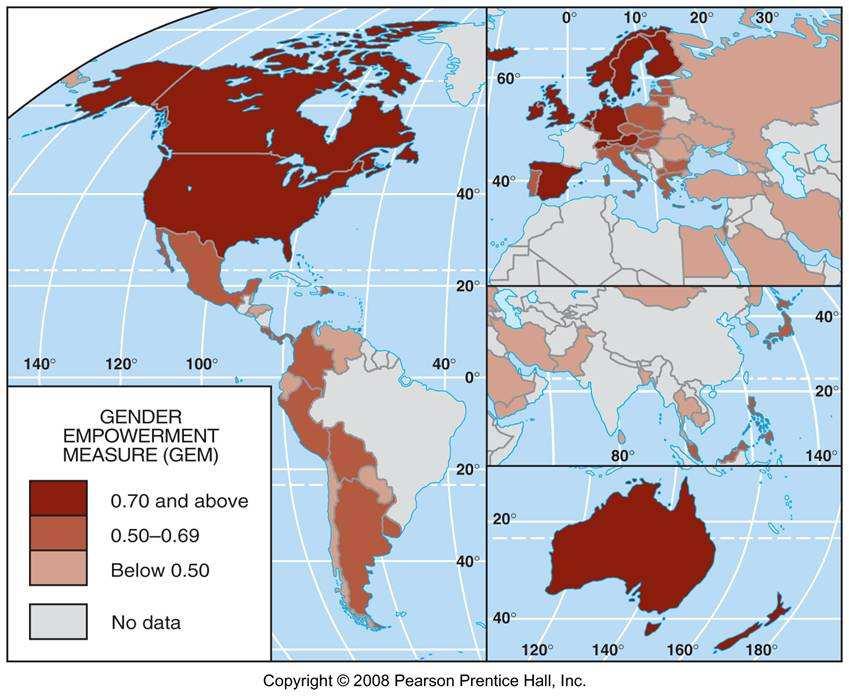
26 GEM

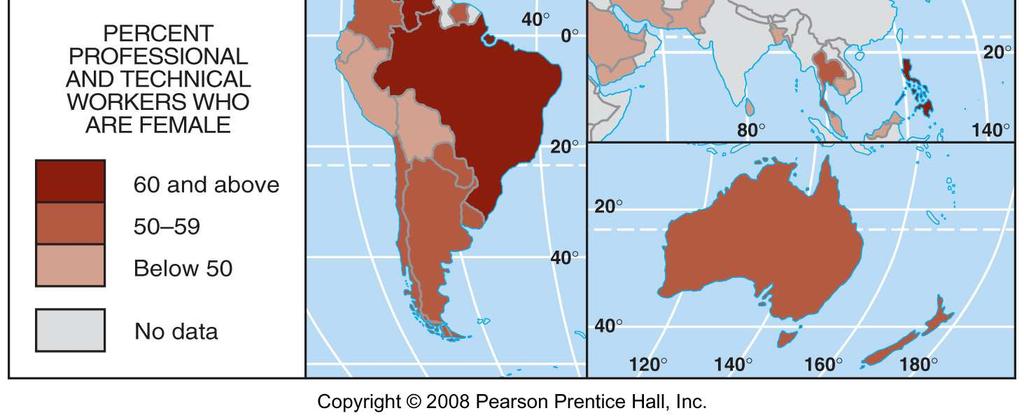
27 Women Holding Professional Jobs
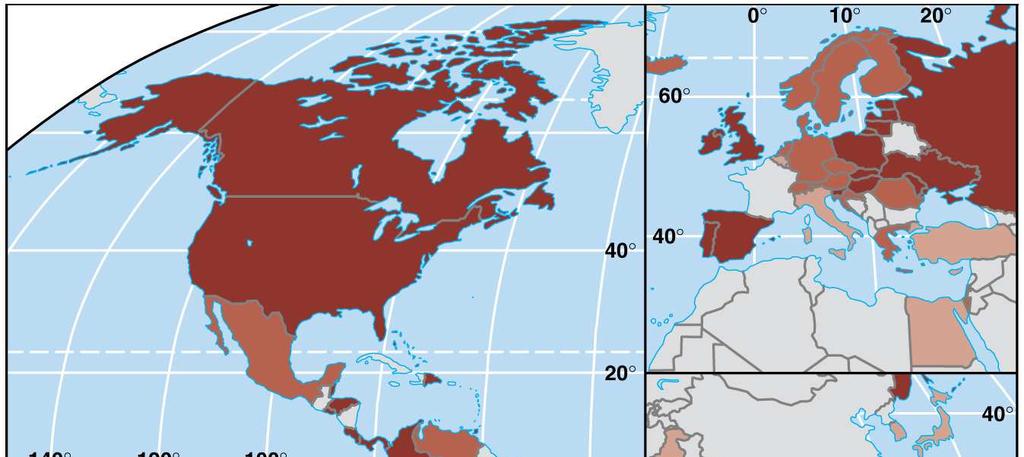
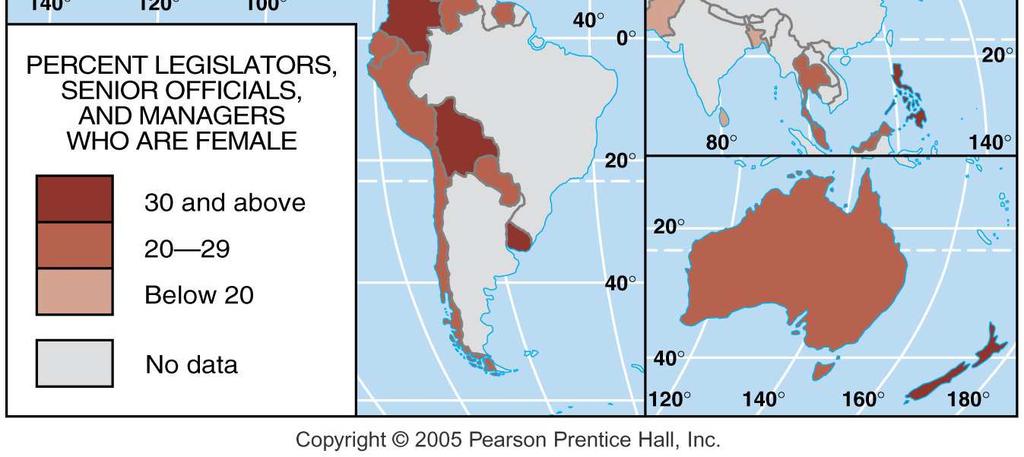
28 Women Administrators and Managers
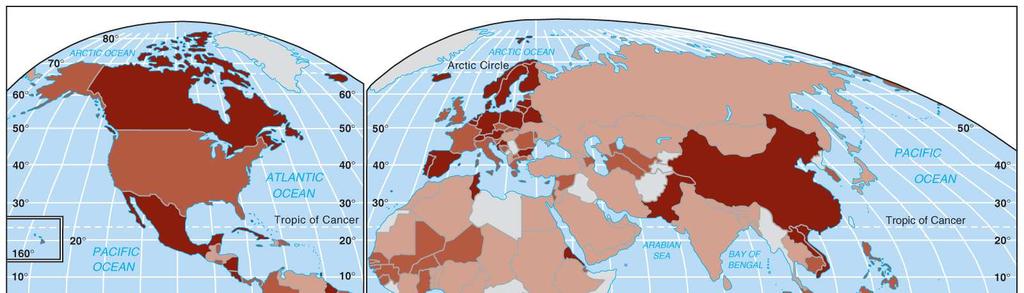
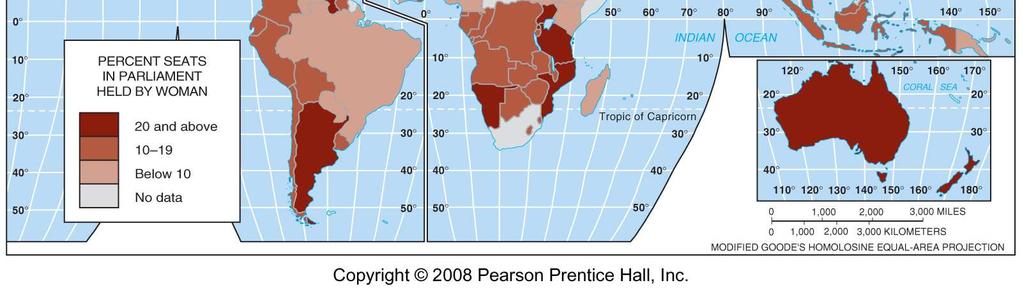
29 Women in Government
30 Amazing Stats 1/5 of World s s Population living in MDCs consumer 5/6 of the World s s Goods 14% of World s s Population who lives in Africa consume less than 1% of the World s s Goods Europeans spend more on Ice Cream ($11 billion) than the cost of providing a working toliet to the 2 billion people currently without one ($9 billion) Americans spend more on make-up ($8 billion) than the cost of providing schools for the 2 billion in the world in need of them ($6 billion)

31 Progress.?
32 LDCs: : Two Models to Development 1.) Development through Self Sufficiency - Elements of Self-Sufficiency Sufficiency - Problems with Self-Sufficiency Sufficiency 2.) Development through International Trade - Rostow s Developmental Model - Examples of International Trade - Problems with International Trade


33 Development through Self-Sufficiency Sufficiency Balanced Growth Approach across all Sectors Limit imports and set high taxes on imported goods Businesses supposed to produce goods for consumption, not export Popular method in 20 th century original model for China and India


34 Problems with Self-Sufficiency Sufficiency 1. Inefficiency: - lack of competition leads to controlled prices, no incentive to improve quality, increase production, or reduce prices 2. Large Bureaucracy: - needed to administer development, which often led to corruption and abuse. - led to rising black market for foreign products at inflated prices


35 Development thru International Trade Identify unique and demanded economic assets Identify products they can manufacture and distribute cheaper than another country Funds will finance other development W.W. Rostow 5-stage model of development through International Trade
36 Rostow s Development Model 1.) The Traditional Society hasn t t started development, high % of pop. engaged in agricultural 2.) The Preconditions for Takeoff well educated leaders invests in technology and infrastructure 3.) The Takeoff Rapid growth in limited economic activities 4.) The Drive to Maturity Diffusion of technology causes rapid growth in other industries. Workers become skilled and specialized 5.) The Age of Mass Consumption Economy shifts from v industry to production of consumer goods


37 Rostow s Development Model Each country is in one of the 5 stages (MDCs( in stages 4-5, 4 while LDCs in stages 1-3) 1 If U.S.A, Western Europe, Japan, etc. could development following this model, why can t t other countries? End of colonization means LDCs now control their natural resources and labor markets