2019 Grain Market Outlook
|
|
|
- Elizabeth Reeves
- 5 years ago
- Views:
Transcription

1 2019 Grain Market Outlook Ness City, Kansas January 7, 2019 DANIEL O BRIEN EXTENSION AGRICULTURAL ECONOMIST

")
2 Topics to be discussed.. 1) Macroconomic forces at work in the U.S. & where they are taking U.S. Agriculture 2) Grain Market Overview Through Fall 2019 Corn & Grain Sorghum Wheat Soybeans & Cotton Dow Jones Industrial Index (INDX) Weekly Chart: August 2016 through January 4, 2019

3 U.S. Fed: Bank Prime Loan Rate Changes 1950 through December 2018 August % Rate July % Rate Dec % Rate Oct % Rate Dec % Rate U.S. Dollar Index (ICE Futures) Weekly Chart: July 2016 through January 4, 2019
 Weekly Chart:")


4 Light Crude Oil (CME Futures) Weekly Chart: August 2016 through January 4, 2019 Unleaded Gasoline (CME Futures) Weekly Chart: August 2016 through January 4, 2019


5 CRB Commodity Index Weekly Chart: August 2016 through January 4, 2019 U.S. Dollar Index (ICE Futures) Monthly Chart: January 1973 through December 28, Index # January 4,
6 U.S. Dollar Index vs Kansas Grain $ s 2006 Dec. 28, 2018 U.S. Dollar Index US Dollar Index Corn Wheat Soybeans Sorghum $7.92 $4.81 $3.52 $3.06 $18 $16 $14 $12 $10 $8 $6 $4 $2 $0 Kansas Grain Prices (USD$ per bu) Unpredictable Grain Markets in The Ups & Downs of U.S. Trade Tensions U.S. Abandonment of the Trans Pacific Partnership (TPP) o Potential impact on U.S. wheat exports vs TPP Countries NAFTA (U.S.-Mexico-Canada) o Mexico grain purchases from the U.S. o Canada grain export competition vs U.S. (Wheat, Oilseeds) U.S. vs China o Soybeans & Sorghum (Need of both With & Without Scenarios)
7 USDA Market Facilitation Payments (MFP) A. Direct payments to farmers of soybeans, sorghum, corn, wheat, cotton, dairy & hogs. Soybean MFPs = $1.65 /bu x 50% of production ($3.700 bln) Sorghum MFPs = $0.86 /bu x 50% of production ($156 mln) Wheat MFPs = $0.14 /bu x 50% of production ($119 mln) Corn MFPs = $0.01 /bu x 50% of production ($ 96 mln) Cotton MFPs = $0.06 /lb x 50% of production ($277 mln) Market Facilitation Payments (MFP) more A. Direct payments to farmers of soybeans, sorghum, corn, wheat, cotton, dairy & hogs. Hog MFPs = $8.00 /head x 50% of production ($290 mln) Dairy MFPs = $0.12 /cwt milk x 50% of MPP Production ($127 mln) No Adjustments for Low Yields in 2018 The aid is based on this year's production. It will not be adjusted for those who suffered low yields due to factors such as drought. DTN Chris Clayton 8/27/2018
8 Economic Impact of U.S.-China Tariffs (Hayes, Hart ISU ) The U.S. will continue to export soybeans to China, BUT this means that a 25% wedge will exist (i.e., 25% Tariff = 25% Wedge) o o o IF the U.S. was equal to 50% the World Soybean Production, THEN the U.S. Soybean price should fall by 12.5% (1/2 of 25% wedge ) BUT the U.S. only produces 33% of World Soybean Production, SO the U.S. Soybean price will be down $1.75 /bu IF Soybeans are $1.75 lower THEN U.S. Corn will be $0.70 /bu lower Economic Impact of U.S.-China Tariffs (Hayes, Hart ISU ) Based on old crop MY 2017/18 Ending Stocks, U.S. Corn $ AUG2018 were $0.50 /bu lower than they would usually be (Now $0.35-$0.50 /bu - KSU) U.S.-China Possible Impact on U.S. Export Competitiveness US soybean producers do NOT have a 25% cost advantage over Brazil If this Trade War between the U.S. & China goes on long enough, the U.S. will likely need to downsize U.S. soybean production by 30% As a result IF Soybeans are $1.75 lower THEN U.S. Corn will be $0.70 /bu lower. (because U.S. Corn Acres-Production will have increased)
9 Cortney Cowley Federal Reserve Bank of KC Omaha Branch Grain Market Events to Come. 1) 2018 U.S. Corn & Soybean harvest (USDA - Jan-Feb 2019 ) o Corn 2018/19 < bln bu? End Stocks < bb? o Soybeans 2018/19 < bln bu? End Stocks < 955 mb? 2) U.S. HRW Wheat Seedings (USDA - Jan-Feb 2019 ) o Increase in response to HRW wheat $ s in 2018??? o OR poor Fall2018 seeding conditions to HRW Acres 2019???
10 More Grain Market Events to Anticipate. 3) 2019 South America Crop Plantings (Nov Jan 2019 ) Soybeans S.Am 2019 Up 5-10%? Existing or New Acres? Corn S.Am 2019 Down 5%? 2 nd Crop Impact (Exports)? Argentina export taxes & Brazil domestic issues are a wildcard 4) Break Dormancy for 2019 HRW Wheat Crop (March 2019 ) Uncertain crop conditions affecting Kansas HRW Wheat at that time (?) More Grain Market Events to Anticipate. 5) 2019 U.S. Spring Crop Plantings (April-May 2019 ) Soybeans U.S mln ac.? U.S.-China Trade Status? Corn U.S mln ac.? More if South America 6) 2019 U.S. HRW Crop Development (April-June 2019 ) Q? What will the protein &/or quality condition of the 2019 crop be? Q? What cross over HRS vs HRW wheat market impacts will occur?
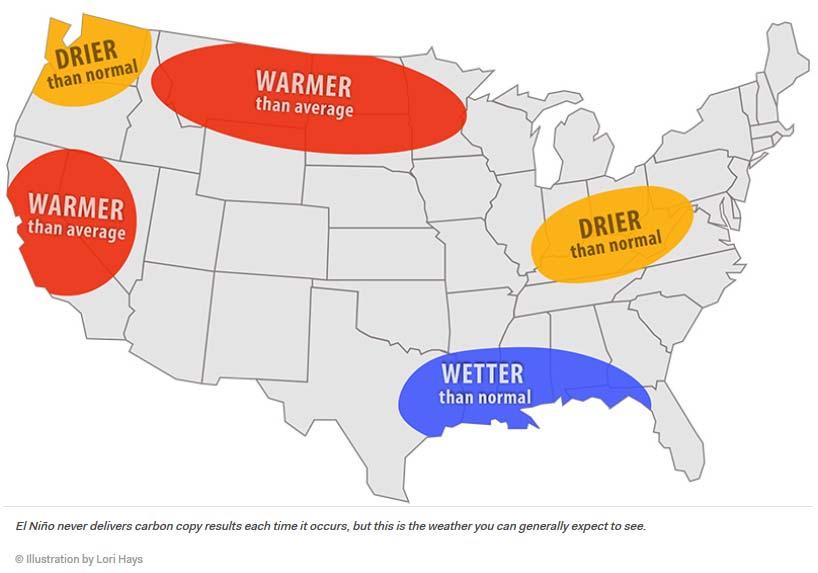
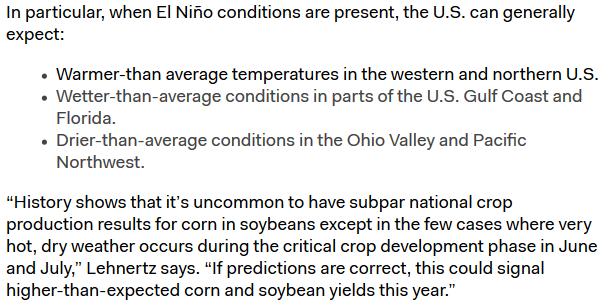
11 Yet Still MORE Events to Come. 7) 2019 South America Crop Development (Jan-May 2019 ) El Nino forecast 2019 Wetter than normal in Spring-early Summer, but NOT a certain impact on their crops 8) 2019 U.S. Crop Developments (May-Oct 2019 ) El Nino forecast 2019 Generally positive for U.S. crops, but also NOT a certain effect in the U.S. growing season

12
 Monthly Chart: January 1973 through December 14, 2018 92.")
13 Yet Still MORE Events to Come. 9) 2019 U.S. HRW Wheat Harvest (June-July 2019 ) Q. Yields: What are the odds of a normal-to-large 2019 U.S. HRW crop yield & production vs a short crop??? Q. Protein Quality: What are the odds of a normal-to-low protein crop in 2019 for U.S. HRW wheat vs a high protein crop??? These outcomes have serious market implications in Kansas! U.S. Dollar Index (ICE Futures) Monthly Chart: January 1973 through December 14, Index # Dec. 14, 2018


14 U.S. Dollar Index vs Kansas Grain $ s 2006 Dec. 14, 2018 U.S. Dollar Index US Dollar Index Corn Wheat Soybeans Sorghum $7.92 $4.81 $3.52 $3.06 $18 $16 $14 $12 $10 $8 $6 $4 $2 $0 Kansas Grain Prices (USD$ per bu) Corn & Sorghum Markets
15 U.S. Corn Supply-Use 2018 U.S. Corn Production 2017 Crops Moderate-Large End Stocks are limiting U.S. Corn Price$ s Low $ s supporting New Crop MY 2018/19 Corn Use o Ethanol 2018/19 = bln bu (Near record vs bb last year) o Livestock Feed 2018/19 = bln bu (10 year high vs bb in 2007/08) o Exports 2018/19 = bln bu (vs bb in 17/18 & in 15/16) o Other FSI 2018/19 = bln bu (Record high vs bb last 2 years) U.S. Grain Sorghum Supply-Use 2018 U.S. Grain Sorghum Production = 2017 Crops Poor Exports are limiting U.S. Sorghum Price$ s Low $ s supporting New Crop MY 2018/19 Sorghum Use o Feed Use 2018/19 = 150 mln bu ( vs 100 mb 2017/18 & 133 mb 2016/17 ) o FSI (Ethanol+) 2018/19 = 110 mln bu (vs 100 mb 2017/18 & 115 mb 2016/17 ) o Exports 2018/19 = 100 mln bu ( vs 205 mb 2017/18 & 238 mb 2016/17 ) o Total Use 2018/19 = 360 mln bu (vs 364 mb 2017/18 & 485 mb 2016/17 )
 Grain Sorghum: Low Price$ s (Hurt by trade issues) o End Stocks 2018/19 39 mln bu ( Exports; Ethanol & Feed Use) o % Stocks/Use 2018/19 10.8% S/U (vs 9.")
16 U.S. Corn & Sorghum Stocks.. Corn: Moderate Stocks & % S/U o End Stocks 2018/ bln bu (vs bb last year) o % Stocks/Use 2018/ % S/U (vs 14.5% Stx/Use last year) Grain Sorghum: Low Price$ s (Hurt by trade issues) o End Stocks 2018/19 39 mln bu ( Exports; Ethanol & Feed Use) o % Stocks/Use 2018/ % S/U (vs 9.6% Stx/Use last year) CME Corn Futures Monthly Chart: November 2009 December /4/2019 MARCH 2019 $3.83 1/4/2019 $4.12 ¼ $3.83 $2.90 $3.18 ¼ $3.01 $3.28 ½

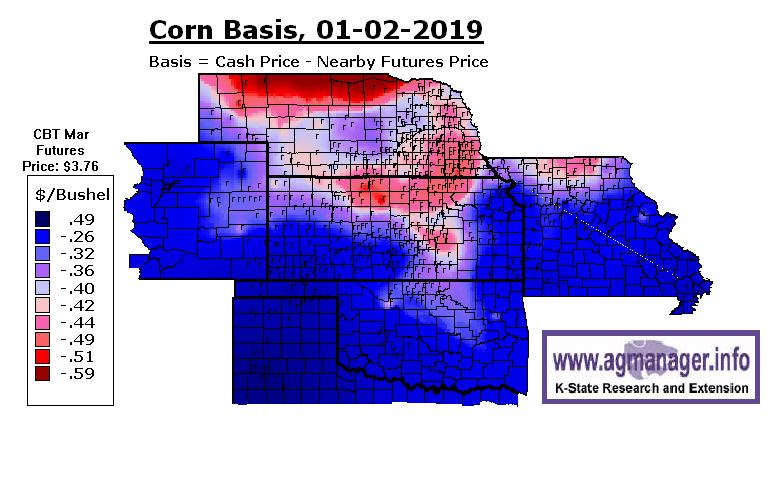
17 CME Corn Futures Weekly Chart: November 2016 January 4, 2019 $4.12 ¼ MARCH 2019 $3.83 1/4/2019 $3.83 $3.28 ½ Corn Cash & Futures $ s Ness City, KS Local Elevators January 4, 2019 Price $/bu $6 $5 $4 $3 $0.03 $ /mo $ /mo $ /mo /mo $3.83 $3.91 $3.98 $4.00 $4.04 $3.61 $3.65 $3.74 $3.70 $3.43 $2 $1 $0 $2.03 $2.03 $2.28 Futures Low $ High $ Mktg Loan-Saline Co.
18
19


20 U.S. Corn Acreage U.S. Corn Production & Supplies bb Supplies last 3 years


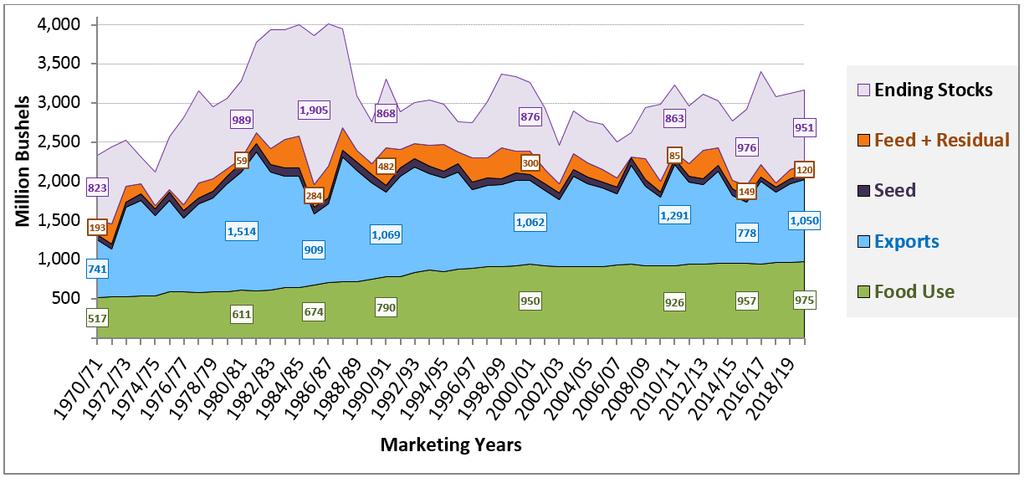
21 U.S. Corn Use By Category Each Year U.S. Corn Use Together by Category End Stocks Exports Ethanol Livestock Feed


22 U.S. Corn Exports Weekly thru Dec. 20, 2018 U.S. Corn Ending Stocks & % Stx/Use % End Stocks-to-Use , , ,731 1, ,293 2,140 1,781 1,571 8,000 7,000 6,000 5,000 4,000 3,000 2,000 1,000 0 Million Bushels Marketing Year


23 U.S. Corn % Stocks/Use vs Price$ MY 2006/07 Through Current MY 2018/19 Including possible Higher & Lower U.S. Corn Export Scenario Outcomes For Current MY 2018/19 U.S. Corn % Stocks/Use vs Price$ MY 2006/07 Thru Next Crop MY 2019/20 Including preliminary U.S. Corn Supply- Demand & Prices For Next Crop MY 2019/20

")
24 U.S. Corn % Stocks/Use vs Price$ Corn $Prices responding either strongly or weakly to % Stocks/Use higher or lower flexibilities World Corn (Maize) Production Regions

25 World Corn Supply, Use & Stocks U.S. Corn Price$ vs World % Stocks-to-Use MY 1973/74 through New Crop MY 2018/19

26 U.S. Grain Sorghum Production Regions Sorghum Cash & Futures $ s Ness City, KS Local Elevators January 4, 2019 $6 Price $/bu $5 $4 $3 $2 $1 $0 $3.83 $3.91 $3.98 $4.00 $4.04 $3.18 $3.21 $3.36 $3.08 $1.84 $1.84 $2.09 Futures Low $ High $ Mktg Loan-Saline Co.
27
28


29 U.S. Sorghum Usage Marketing Years 2006/07 thru 2018/19 (as of December 11, 2018) U.S. Sorghum Stks/Use & Price$ Marketing Years 2005/06 thru Next Crop MY 2019/20


30 Wheat Markets World Wheat Market Prospects: Still Large Supplies But less of a Buyer s Market Lower Production - BUT - Record Usage Forecast for 2018/19 o 1 st year lower after 5 consecutive record high World wheat crops Smaller 2018 crops: E.U., Australia, Russia, Ukraine, China, Pakistan More competitive buying pressure in World Trade o Tight supplies among Top 7 World Wheat Exporters o NOT MUCH evidence YET of stronger U.S. wheat exports
31 U.S. Wheat Supply-Use Market support from World crop problems & higher protein in the 2018 U.S. HRW crop o Marginally lower U.S. & World Wheat Stocks Markets still expect U.S. Wheat Exports to increase some o Exports 2018/19 = bln bu (vs 778 mb bb range since 2008/09) o Food Use 2018/19 = 970 mln bu (vs Level+ Use since MY 2012/13) o Feed Use 2018/19 = 110 mln bu (vs 50 mb 2017/18 vs mb since 2012/13) o HRW Exports 2018/19 = 320 mln bu (vs 371 mb & 455 mb last 2 years) U.S. Wheat Stocks.. All U.S. Wheat: Lower but Large Stocks o End Stocks 2018/ mln bu (vs bb last year) o % Stocks/Use 2018/ % S/U (vs 55.5% Stx/Use last year) U.S. HRW Wheat: Still Large Carryover (also lower) o End Stocks 2018/ mln bu (vs 581 mb last year) o % Stocks/Use 2017/ % S/U (vs 76.0% Stx/Use last year)

32 2018 U.S. Wheat Quality & Grades HRW Wheat % protein, 61.1 lb test, 1.2% defects o Versus 11.4% protein, 60.8 lb test wt, 1.1% defects in 2017 SRW Wheat % protein, 57.5 lb test, 1.3% defects o Versus 9.5% protein, 58.8 lb test wt, 1.7% defects in 2017 Soft White Wheat % protein, 61.7 lb test, 0.6% defects o Versus 9.6% protein, 60.9 lb test wt, 0.6% defects in 2017 HRS Wheat % protein, 61.7 lb test, 0.8% defects o Versus 14.6% protein, 61.2 lb test wt, 1.0% defects in 2017 CME Kansas Hard Red Winter Wheat Monthly Chart: November 2009 December /4/20198 MARCH 2019 $5.07 January 4, 2019 $6.01 $5.90 ½ $5.07 $4.59 $3.85 $3.91 ¼
33 CME Kansas Hard Red Winter Wheat Weekly Chart: December 2016 January 4, 2019 $5.90 ½ $5.34 ¼ $5.07 $3.85 $3.91 ¼ $4.50 $4.56 ¾ MAR 2019 $5.07 Jan. 4, 2019
34

35 Wheat Cash & HRW Wheat Futures Ness City, KS Local Elevators - January 4, 2019 Price $/bu $8 $6 $4 VSR Affect?? $5.07 $5.19 $5.28 $5.40 $5.57 $4.67 $4.73 $4.52 $0.06 /mo $ /mo $ /mo $ /mo $2 $2.75 $3.19 $0 Futures Low $ High $ Marketing Loan


36 U.S. Wheat Seeded Acreage 2019 Winter Wheat Acres?? - Favorable market prospects - Higher Old & New Crop $ s U.S. Wheat Acreage


37 U.S. Wheat Production & Supplies U.S. Wheat Use by Category


38 U.S. All Wheat Exports Weekly thru December 20, 2018 U.S. Hard Red Winter Wheat Exports Weekly through 10/18/2018

39 U.S. Wheat Ending Stocks & % Stx/Use % End Stocks-to-Use ,181 1, ,000 3,500 3,000 2,500 2,000 1,500 1, Million Bushels Marketing Year U.S. Wheat Ending Stocks & Prices MY 2006/07 Through Current MY 2018/19 Including possible Higher & Lower U.S. Wheat Export Scenario Outcomes For Current MY 2018/19

40 U.S. Wheat Ending Stocks & Prices MY 2006/07 Thru Next Crop MY 2019/20 Including preliminary U.S. Wheat Supply- Demand & Prices For Next Crop MY 2019/20 U.S. Wheat Price vs U.S. Stocks-to-Use


41 World Wheat Production Regions World Wheat Supply, Use & Stocks
 vs World % Stx/Use MY 1973/74 Current MY 2018/19 World Wheat % S/U has modestly improved")
42 Wheat Stx/Use: Top 7 Exporters vs ROW Tight supplies among the Worlds Top 7 Exporters: Argentina, Australia, Canada, E.U., Russia, Ukraine, & U.S. U.S. Wheat Price ($) vs World % Stx/Use MY 1973/74 Current MY 2018/19 World Wheat % S/U has modestly improved

")
43 U.S. Wheat $ vs Non-China % Stx/Use MY 1973/74 New Crop MY 2018/19 BUT World-Less-China % Stocks/Use are the TIGHTEST since 2007/08 (< MY 2012/13) Soybean Markets
44 U.S. Soybean Market Prospects in 2019 A. U.S.-China Trade Dispute HAS has LIMITED U.S. export shipments & forward purchases & HAS affected U.S. Soybean prices B. USDA forecasts U.S. Exports to be large despite Tariffs Foreign buyer switching between U.S. & South America, & some trans-shipments have occurred among countries C. Market Focus in Winter-Spring So. America 2019 crop prospects their response to high 2018 $ s U.S. Soybean Supply-Use 2019 U.S. Soybean Production Record** billion bu. Large U.S. & Global Soybean Stocks limit U.S. Price$ s Low Price$ s DO support Current MY 2018/19 Use *** o Soy Crush 2018/19 = bln bu (New Record vs bb last year) o Exports 2018/19 = bln bu (Down vs & bb last 2 years) o Total Use 2018/19 = bln bu (Down vs & 4214 bb last 2 years) o SBM Exports 2018/19 = mln tons (vs & mln tons last 2 years)
 o % Stocks/Use 2018/19 23.25% S/U (High vs 10.")
 o End Stocks 2018/19 4.4 mln bales (4.3 & 2.75 mb last 2 years) o % Stocks/Use 2018/19 24.0% S/U (22.55% & 15.")
45 U.S. Soybean & Cotton Stocks.. Soybean: Large Stocks & % S/U o End Stocks 2018/ mln bu (High vs 438 mb last year) o % Stocks/Use 2018/ % S/U (High vs 10.20% last year) Cotton: Large 2018 Crop & Growing Stocks o Production 2018/ mln bales (20.9 & 17.2 mb last 2 years) o End Stocks 2018/ mln bales (4.3 & 2.75 mb last 2 years) o % Stocks/Use 2018/ % S/U (22.55% & 15.1% last 2 years) CME Soybean Futures Monthly Chart: Nov through December /4/2019 JAN 2019 $9.11 Jan. 4, 2019 $10.82 ½ $8.75 $8.53 $9.00 ¼ $8.30


46 CME Soybean Futures Weekly Chart: November 2009 through January 4, 2019 $10.82 ½ JAN 2019 $9.11 Jan. 4, 2019 $9.28 $9.11 $8.14

47 Soybean Cash & Futures Price$ s Ness City, KS Local Elevators - January 4, 2019 Price $/bu $15 $12 $9 $6 $3 $0.04 $ /mo /mo $ $0.06 /mo 375 /mo $9.13 $9.26 $9.38 $9.50 $9.54 $9.52 $9.61 $8.41 $7.91 $7.81 $7.69 $6.20 $5.00 $5.00 $0 Futures Low $ High $ Marketing Loan


48 U.S. Soybean Acreage U.S. Soybean Production & Supplies


49 U.S. Soybean Exports Cumulative Weekly (12/20) U.S. Soybean Use & End Stocks End Stocks Exports Domestic Crush


50 U.S. Soybean Ending Stocks & % Stx/Use % End Stocks-to-Use 25% 20% 15% 10% 5% 0% -5% -10% % 4.5% 4.5% % % % % % % 793 2,250 2,000 1,750 1,500 1,250 1, Million Bu. Marketing Year U.S. Soybean $ vs U.S. Stocks-to-Use MY 1973/74 through Current MY 2018/19 + KSU Alt Scenarios MY 2006/07 Through Current MY 2018/19 Including possible Higher & Lower U.S. Soybean Export Scenario Outcomes For Current MY 2018/19


51 U.S. Soybean % Stocks/Use vs Price$ MY 2006/07 Thru Next Crop MY 2019/20 Including preliminary U.S. Soybean S-D & Prices For Next Crop MY 2019/20 U.S. Soybean % Stocks/Use & Prices


52 World Soybean Supply, Use & Stocks So. America Soybean Supply-Demand MY 2007/08 through New Crop MY 2018/19


53 Cortney Cowley Federal Reserve Bank of KC Omaha Branch China Soybean Supply-Demand MY 2007/08 through New Crop MY 2018/19


54 Soybean Importer Purchases Million Metric Tons % /yr To 2016/17 90 Chinese increase of 37.7 mmt in soybean imports over 8 years % /yr % /yr % /yr China EU-28 SE Asia Mexico Rest of World 2010/ / / / / / / / / % /yr 32 Up 16.5 mmt over 8 years U.S. Soybean Price ($) vs World % Stx/Use MY 1973/74 Current MY 2018/19 World % Stocks/Use has INCREASED since MY 2012/13


55 Questions? Daniel O Brien Extension Ag Economist Blog: KSUGrains on Twitter & Facebook