Feed the Future Innovation Lab for Small Scale Irrigation Integrated Modeling and Scaling. Photo Credit Goes Here
|
|
|
- Jeffery Emil Cannon
- 5 years ago
- Views:
Transcription


1 Feed the Future Innovation Lab for Small Scale Irrigation Integrated Modeling and Scaling Photo Credit Goes Here
2 CONTRIBUTION OF MODELING TO PROJECT IMPACT External Advisory Committee Stakeholder consultation at multiple levels around results National champions Stakeholder consultation: opportunities, constraints Research design, analytical tool development Implementation of field interventions, data collection, surveys, interviews and focus groups Analysis of constraints, opportunities IDSS ex ante and ex post analysis Sharing products that can continue to be accessed for analysis, planning and implementation Capacity development: research methods, analytical tools, microfinance, gender, field/local Year 1 to Year 2 Year 3 Year 4 Capacity development materials and platforms continue to be used Year 5 Post project exit
3 Key Questions to answer for ILSSI How much water/land is available for irrigation? How many farmers/households can it support? How sustainable is it? o Now into future What are the bottlenecks & opportunities? o technologies, social/cultural, economics What are the optimum mixes of interventions? What difference will it make? o income, health, and in the lives of people What changes in policy, practice and investments are necessary? o local, regional, national
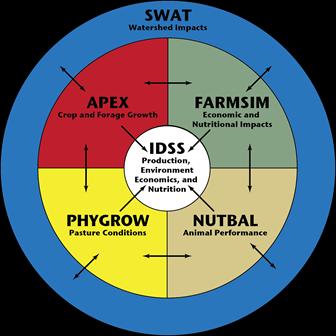

4 Integrated Decision Support System
5 Integrated Decision Support System (IDSS) Used in ILSSI APEX Production Farming system Environment SWAT SWAT model to analyze the biophysical and environmental impacts of intensification of the interventions at the watershed scale FARMSIM APEX model to analyze cropping systems and to quantify benefits on Socio-economics crop yields at the farm scale FARMSIM assesses economic & nutrition impacts at the household
6 SWAT MODEL Predict the impact of land management practices on water, sediment, and agricultural chemicals in watersheds with varying topography, soil, land use, weather, and management conditions. A product of over 45 years of USDA/Texas A&M University cooperation. EPA and USDA NRCS/ARS use the SWAT model to predict the impact of land use management change/climate smart agriculture, and Best Management Practices (BMPs) on water quality and quantity, respectively. SWAT model is open source public domain with QSWAT (QGIS) interfaces. SWAT-CUP for calibration/sensitivity/uncertainty analysis, and Over 3,000 SWAT users and 30 active developers worldwide; more than 1,600 graduate students engaged in research; Estimate more than 1000 users in Africa. More than 3000 peer reviewed publications worldwide (1.3 papers/day)
7 APEX MODEL APEX: Agricultural Policy / Environmental extender Predict the impact of farm intervention on water, sediment, crop yield and agricultural chemical yields at field or small watersheds scale. Management capabilities includes: irrigation, drainage, best management practices (buffer strips, filter strips, grass water ways etc), fertilization, manure, reservoir, crop rotation, pesticide application, grazing and tillage. A product of over 45 years of Blackland Research and Extension Center, Texas A&M. EPA and USDA NRCS/ARS use the APEX model to predict the impact of agricultural management. APEX model source code is public domain, with public domain ArcAPEX and WinAPEX interfaces.
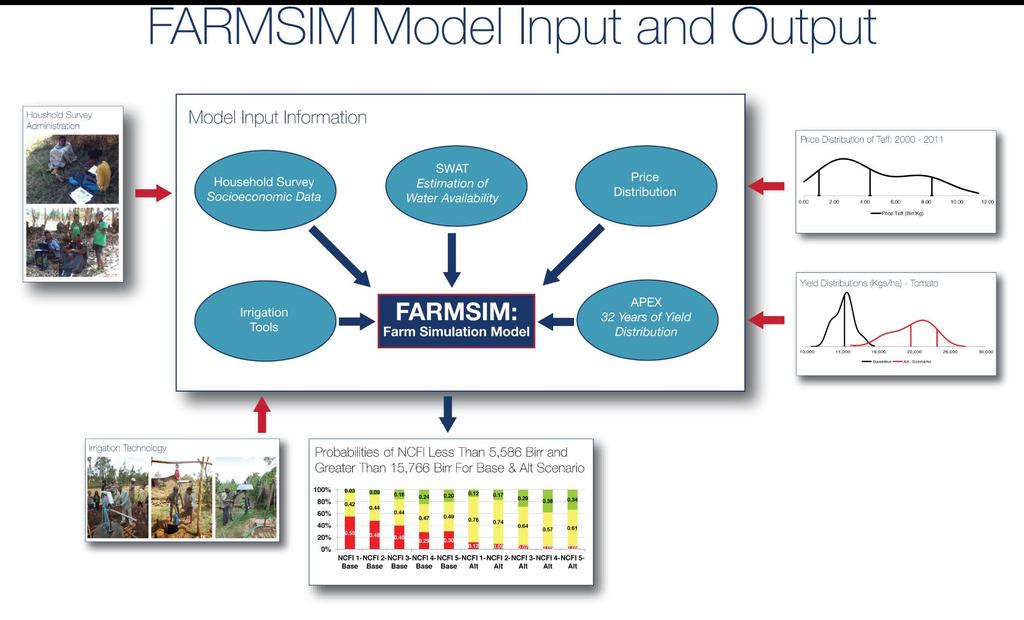
8 FARMSIM FARMSIM is a Monte Carlo farm level income and nutrition simulation model Small farm version of FLIPSIM a 40 year model at Texas A&M Simulates annual production, consumption, and marketing of crops and livestock on a small holder farm under alternative technology assumptions Stochastic prices and yields for crops and livestock incorporate risk Not an optimization, but a simulation of What could be if technology is adopted at different rates. Projects changes to a farm family s income and nutrition uptake for alternative technologies Calculates NPV, B/C and IRR to evaluate alternative technologies
9

10 IDSS WORKFLOW IWMI
11 IDSS Contributions to the ILSSI project until now: Ex-ante analysis on small scale irrigation helped to scope the existing small scale irrigation (SSI) and understand their impact on agricultural production, environmental sustainability and economic and nutrition outcomes. Ex-post analysis on small scale irrigation the impact of SSI on agricultural production environmental sustainability and economic and nutrition outcomes was further explored using field collected data. Gap and constraint analysis helped us identify factors that limit the adoption of SSI and to suggest positions for mitigations. Upscaling analysis helped to study the potential for expanding SSI and its impacts. Capacity building will be presented in a separate slide.

12 ILSSI study sites in Ethiopia

13 ILSSI study sites in Tanzania

14 ILSSI study sites in Ghana /Dimbasinia
15 Ex-ante analysis Ex-analysis relied on existing small scale irrigation (SSI) in each of the three countries, Data was obtained from literature and secondary sources (e.g. biophysical and socio-economic data was received from partner research institutions), IDSS used all these inputs to understand their impact on agricultural production, environmental sustainability and economic and nutrition outcomes. Four sites in Ethiopia, and three each in Ghana and Tanzania were studied.
16 Ex-ante case study: Dimbasinia site, Ghana

17 Calibration for Dimbasinia watershed SWAT calibrated parameters for a nearby watershed in White Volta basin transferred to Dimbasina SWAT site; APEX was setup for SWAT subarea; APEX is calibrated for Corn and Sorghum and the calibrated parameters for these crops were transferred back to SWAT Calibrated crop yields are entered in FARMSIM for economic analyses
18 Calibration for White Volta Basin SWAT model calibration was done using streamflow at the Pwalugu river gauging station in White Volta. Dile et al., Individual SWAT modeling report in Dimbasinia

19 APEX Calibration for Dimbasinia watershed APEX was setup for selected SWAT subarea; APEX model was calibrated for the base period for rainfed corn and sorghum, and validated with FAOSTAT and SPAM crop yield data. SWAT site: 34.8km 2 APEX site: 27.6 ha SWAT model APEX model
20 CALIBRATION SWAT/APEX RUNOFF 200 APEX Simulated (mm) R² = Nash-Sutcliff Efficiency (NSE)= 0.88 R-square value of SWAT Simulated (mm) Worqlul et al., Individual APEX modeling report in Dimbasinia
21 APEX BASELINE AND SCENARIOS Baseline: continuous planting of rainfed non-fertilized crops (maize and sorghum); Scenario 1: multiple cropping of non-fertilized maize with irrigated vegetables (maize + tomato, maize + pepper, maize + fodder); Scenario 2: multiple cropping of non-fertilized sorghum with irrigated vegetables (sorghum+ tomato, sorghum + pepper, sorghum + fodder); Scenario 3: multiple cropping of fertilized maize with irrigated vegetables (fertilized maize + tomato, fertilized maize + pepper, fertilized maize + fodder); Scenario 4: multiple cropping of fertilized sorghum with irrigated vegetables (sorghum + tomato, sorghum + pepper, sorghum + fodder)
22 RAINFED CROP MANAGEMENT -IFPRI SURVEY Maize and Sorghum Practice Dates Baseline With fertilizer Tillage 15-May Tillage 1-Jun Tillage 15-Jun DAP fertilizer application 15-Jun Don t apply 50 kg/ha Planting 15-Jun 1st stage urea fertilizer application 15-Jul Don t apply 25 kg/ha 2nd stage urea fertilizer application 15-Aug Don t apply 25 kg/ha Harvest 15-Oct
23 IRRIGATED CROPS MANAGEMENT Operation Tomato Pepper Fodder practice (Oats/Vetch) Tillage 10-Nov 23-Nov 30-Nov Tillage 25-Nov 8-Dec 15-Dec DAP application (50 kg/ha) 25-Nov 8-Dec 15-Dec Planting 25-Nov 8-Dec 15-Dec 1st stage urea application (25 kg/ha) 25-Nov 8-Dec 15-Dec 2nd stage urea application (25 kg/ha) 25-Dec 7-Jan 10-Jan Harvest 11-Apr 26-Apr 13-Feb
24 BASELINE AND SCENARIO-1/3 MAIZE YIELD Application of fertilizer (50 kg/ha urea and 50 kg/ha DAP) increased maize yield significantly compared to without fertilizer application; Crop rotation significantly improved soil fertility especially when maize is planted after legumes (fodder); Worqlul et al., Individual APEX modeling report in Dimbasinia
25 Stream flow Environmental impacts the ex-ante analysis indicated that the average monthly stream flow will be reduce by 25% with the implementation of irrigation from the shallow groundwater aquifer. There will be consistent reduction for monthly stream flows both on the high flows and low flows Dile et al., Individual SWAT modeling report in Dimbasinia

26 Long-term Environmental impacts on groundwater recharge ( ) The average areaweighted irrigation was 248 mm, and shallow groundwater recharge was 227 mm. The annual shallow groundwater recharge cannot support the irrigation water requirement for producing pepper and Napier grass during the dry season. Reduce area of irrigation to sustainably irrigate.
27 FARMSIM: Nimbasina community-ghana Field data collected in 2014 by Africa Rising-IFPRI Baseline and alternative scenarios differ only on input costs and yields for grains and irrigated crops Simulation of profitability & nutrition with rain-fed grain crops and irrigated vegetables and fodder Irrigation costs: o Equipment costs: 2260 to 3000 GH /family (Diesel and solar pump + accessories); pulley/bucket system: 250 GH o Operational costs (fuel, maintenance, rental): GH /ha
28 Economic and nutrition results Average values show economic profitability of investing in diesel pump with multiple cropping of sorghum, vegetables (tomato & pepper), and fodder Percentage change in the profit of Alt. vs. Baseline is positive and doubled for diesel pump use compared to pulley and solar pump Increase in daily intake of all nutrition variables from Baseline to Alt. scenarios and meets all minimum requirements except for calcium
29 Conclusions for the Ex-ante Case Study Large water resource potential in the Dimbasinia watershed. However, the average annual irrigation water requirement for cultivating pepper/tomato and fodder was more than the average annual shallow groundwater recharge. The addition of 50 kg/ha of urea and 50 kg/ha of DAP doubled maize and sorghum yields. Additional fertilizer, multiple cropping, and irrigation performed better than baseline scenario. The diesel pump (rented or owned) was the preferred water-lifting technology.
30 Ex-post analysis Ex-post analysis used field experimental data to fine-tune the IDSS tools The field data were collected by IWMI in each of the three countries, Four sites in Ethiopia and three sites each in Ghana and Tanzania were studied with several experimental fields in each site/watershed. The field data was instrumental to understand the impacts of SSI on agricultural production, environmental sustainability and economic and nutrition outcomes The ex-post analysis, thereby, was used to study gaps and constraint analysis and upscaling on SSI.
31 Ex-post case study: Robit site, Ethiopia
 Amount of water required for dry season irrigation for tomato = 1,500,000 m 3 ~40% of the")
32 Resource assessment at watershed scale: Robit case, Ethiopia Average annual rainfall = 1,400 mm Average annual groundwater recharge = 280 mm (~4,000,000 m 3 over the watershed or 20% of the rainfall) Average annual surface runoff = 520 mm (~7,000,000 m 3 over the watershed or 37% of the rainfall ) Amount of water required for dry season irrigation for tomato = 1,500,000 m 3 ~40% of the groundwater recharge At the watershed scale, groundwater recharge can support irrigation for vegetables (in suitable areas) in a sustainable manner.

33 Land suitability for irrigation ~57% of the watershed is suitable for irrigation. Major rainfed crops were maize, teff, and finger millet. Dry season irrigated crops were tomato and onion. (others can be considered also)

34 Environmental Impacts of SSI at the watershed scale The average monthly stream flow at the outlet of the Robit watershed reduced by ~6%, minor reductions in high flows. No major environmental impact such as erosion due to SSI


35 Robit surface runoff and shallow groundwater recharge The average annual surface runoff in the Robit watershed ranges b/n 441 mm/year and 534 mm/year. The average annual groundwater recharge in the Robit watershed ranges b/n 247 mm/year and 317 mm/year
36 Robit watershed water production function of tomato Irrigation management: Irrigation interval 2-days Fixed irrigation Furrow irrigation application The average tomato yield ranges from 23 ton/ha and 37 ton/ha with 100 mm and 850 mm of irrigation, respectively. The optimal water required to maximize tomato yield (400 mm/year) is greater than the shallow groundwater recharge (247 mm to 317 mm). Water will be a constraint in Robit watershed if the source of irrigation is only groundwater.

37 Water use function and pumping time of tomato Water lifting technologies specification Over irrigation effect: Limits irrigation expansion; Costs more time and money; The pumping hours to irrigate 0.04 ha for 400 mm of irrigation Worqlul et al., Gap and constraint analysis in Robit. will be 6, 33, 33 and 67 hours using motor, rope & washer, solar, and pulley & bucket pumps, respectively.
38 Optimizing water use efficiency Water balance components of drip and flood/furrow irrigation Drip Flood Flood (furrow) vs. drip irrigation on tomato yield Drip irrigation improves crop water productivity, while Flood irrigation causes water loss as depicted with higher surface runoff and percolation at field level.
39 Optimizing water use efficiency Crop yield and water stress days of drip and flood irrigation Drip irrigation vs. flood irrigation effect on tomato yield For the same amount of irrigation, drip irrigation can increase yield by 60% (i.e. 43 ton/ha with drip vs 27 ton/ha with flood irrigation).
 Fertilizer use efficiency of tomato in Robit watershed Optimal fertilizer use: o 200 to 250 kg/ha Urea with 50 to 100 kg/ha DAP o Farmers applied 100 to 200 kg/ha DAP with 200 to 400")
40 Fertilizer use efficiency of tomato Robit Fertilizer use plan Urea (NPK ) and DAP (NPK ) Tomato fresh weight (t/ha) kg/ha DAP 50 kg/ha DAP No DAP Urea (kg/ha) Fertilizer use efficiency of tomato in Robit watershed Optimal fertilizer use: o 200 to 250 kg/ha Urea with 50 to 100 kg/ha DAP o Farmers applied 100 to 200 kg/ha DAP with 200 to 400 kg/ha urea
41 FARMSIM: Robit kebele-ethiopia Field data collected in 2015 & 2016 by IWMI- IFPRI used to specify irrigation scenarios Baseline and alternative scenarios differ only on input costs and yields for irrigated crops (grains input & yields were kept constant) Simulation of profitability & nutrition with rain-fed grain crops, irrigated vegetables and fodder
42 Baseline conditions: Baseline: No or minimal irrigation; Scenario description Alt. Scen mm: Alt.1--P-OI: Pulley used in optimally irrigated systems ( mm) Alt. Scen mm: Alt.2--R&W-OI: Rope & Washer pump used in optimally irrigated systems; WLT technology Alt. Scen100mm: Alt.3--P-UI: Pulley used in under-irrigated systems (100 mm) Alt. Scen250mm: Alt. Scen250&Drip: Alt.4--P-GW: Pulley used in irrigated systems with groundwater (GW) only; Alt.5--P_Drip-GW-: Pulley used in drip-irrigated systems with GW only; Alt. Scen250&Furrow: Alt.6--P_Furrow-GW: Pulley used in furrow-irrigated systems with GW only; Irrigation technology & constraints Alt. ScenFert_Low: Alt.7--P-OI&LF: Pulley used in Optimally irrigated & low fertilized systems; Fertilizer technology & Alt. ScenFert_High: Alt.8--P-OI&HF: Pulley used in Optimally irrigated & high fertilized systems; constraints
43 Profitability of SSI: Cost-Benefit analysis (B/C ratio and IRR) o Probability distribution of benefit-cost ratio (Alt. 1-Pulley/Baseline) o Profitability of irrigation technologies requires: B/C > 1 o Avg. B/C = 5.3 and probability of B/C > 1 is 100% o Probability distribution of internal rate of return-irr (Alt. 1-Pulley/Baseline) o Profitability of irrigation technologies requires: IRR > Discount rate (0.10) o Avg. IRR = 160% and probability of IRR > 0.1 is 100% Conclusion: SSI-Pulley use is profitable
44 Constraint analysis: SSI technology Prob Cumulative distribution function (CDF) of net cash farm income (profit) Alt.3--P-UI Alt.4-P-Furr_GW Alt.5--P-Drip_GW Constraint: insufficient groundwater in Robit (250mm) to satisfy irrigation needs *Optimal irrig. conditions require mm Comparison of profit and ranking of 3 alternative scenarios under limited available groundwater (GW) for irrigation (100 and 250 mm) Alternative scenario (Alt. 5) using drip irrigation is more profitable and efficient in drought or limited water availability Lowest ranking and least profitable alternative scenario is Alt. 3 that uses furrow irrigation in extremely dry conditions (100 mm available only)
45 Constraint analysis: fertilizer technology Profit (Birr/ha) Average profit and fertilizer rates of urea & DAP (year 5) Comparison of profit for tomato production using 18 fertilizer scenarios combining urea and DAP rates from APEX model: *3 levels of DAP: 0, 50, and 100 (Kgs/ha) *6 levels of urea: 0, 60, 120, 180, 240 and 300 (kgs/ha) Urea (Kgs/ha) Profit-DAP0 Profit-DAP50 Profit-DAP100 Simulation results show profitability for a combination of DAP : Kgs/ha and urea: Kgs/ha (field trial rates) Least profitable scenarios involve the use of urea only (no DAP) for tomato production
46 Conclusions and implications of ex-post and gaps/constraint analysis Farm simulation results show profitability of using a pulley for vegetable/fodder irrigation Drip irrigation showed higher profitability (and efficiency) in dry conditions compared to furrow irrigation Economic profitability of SSI technologies when optimal rates of urea and DAP are used Nutrition results showed improvement of quantity intake from baseline to alternative scenarios and met the minimum daily requirement except for fat and calcium
47 Commercial Vegetable Home Gardens (CVHGs) CA: Conservation Agriculture CT: Conventional Tillage Robit & Dangishita, Bahir Dar -13 farmers Yemu, Tamale -15 farmers Mkindo, Morogoro- 15 farmers Each Farmer: 50 m 2 CA plot 50 m 2 CT plot

48 APEX model setup Dangishita Watershed (Ethiopia) User defined plot (50 m 2 ) GIS data layers preprocessing Input climatic data Integrate operation schedule
49 Summary findings CVHGs under CA - APEX simulated stream flow with reasonable performance measures at Dangishita, Ethiopia (NSE = 0.64, RSR = 0.21, PBIAS = 6%) - Evapotranspiration was found to decrease under CA (Dangishita 5%; Robit 7%; and, Mkindo 3%) as compared to CT - Runoff was found to decrease in Ethiopia under CA (Dangishita 4% and Robit 1%) - APEX simulated lower yield under CA in Dangishita, Robit and Mkindo due to higher nitrogen stress - Continuity of Work: - Collect two more season of data at all sites ( ) - Calibrate/validate APEX model for crop yield - Assessing large-scale and long-term impacts of CA practice in CVHGs
50 UPSCALING ANALYSIS, WHY? ILSSI s field, ex-ante and ex-post studies as well as other research has shown that small scale irrigation provides an opportunity for dry season cultivation to generate additional income. The main questions though are: o What is the appropriate scale of investment? o o Where are those locations with high investment potential? and What are the environmental and socio-economic impacts? Upscaling helps to assess the potential for expanding small scale irrigation. It also helps to study the impacts of intensification of small scale irrigation on crop production, environmental sustainability, and economic and nutrition outcomes.

51 Upscaling analysis Suitability analysis SWAT modeling Agent-Based Model (ABM) Studied crops include: tomatoes, cabbages, peppers, chickpeas, lentils and fodder Dile et al., Upscaling methodological report
 80 40 0 80 85 90 Percent")
 is found to be suitable with the preliminary")
52 Preliminary suitable irrigable land in Ethiopia 120 Suitable area (1000km 2 ) Percent threshold (%) 12 % rainfed land (6.0 M ha) is found to be suitable with the preliminary suitability analysis.
 to 892 mm (in humid regions)")

53 Water resources potential The average annual surface runoff ranges b/n 4 mm (in arid regions) to 892 mm (in humid regions) across the country. The annual average groundwater recharge ranges b/n 0 mm (in arid regions) to 915 mm (in humid regions) across the country

54 Potential for vegetable production During good climatic years, onion yield b/n 1,367 kg/ha and 6,417 kg/ha can be produced across Ethiopia. During bad climatic years, onion yield of b/n <385 kg/ha and 4,354 kg/ha can be produced across Ethiopia.

.")
55 Irrigation for dry season cropping (e.g. onion) Irrigation water requirement during the dry season to cultivate onion ranges b/n <53 mm and 304 mm during high yielding seasons (across the country). Irrigation water requirement during the dry season to cultivate onion ranges b/n <18 mm and 279 mm during high yielding seasons (across the country).


56 Probability of irrigation adoption and water scarcity The Ethiopian Great Rift Valley and Lake Tana areas are region found to be the regions with highest adoption probability for small scale irrigation. At the same time, small scale irrigation development may pose water scarcity in the Great Rift Valley.
57 Estimated small-scale irrigation adoption potential in Ethiopia Regions (ha) Vegetables (ha) Pulses & Root crops (ha) Total (ha) Net revenue (million USD/yr) Number of beneficiaries Affar Amhara 200, , , ,802,963 Benishangul- Gumuz 11, , ,739 Gambella ,864 Harari ,355 SNNP 87,942 41, , ,300 Tigray 9, , ,389 Oromiya 179, , , ,874,494 Somali ,811 Total 489, , , ,541,221 About 0.8 million ha of land is economically and biophysically suitable for small-scale irrigation development in Ethiopia million ha will be used for vegetable production and 0.3 million ha will be used for pulse and root crop production. The net income from the small scale irrigation adoption will be ~250 million USD/year. Amhara, Oromia and SNNPR have the highest small scale irrigation adoption potential.
58 Outputs Several reports have been produced using IDSS tools - individual model per site reports, integrated site reports, and country reports for the three ILSSI countries. Several raw or processed data were generated and shared to partners, such as: Groundwater depth, Digital Elevation Model (DEM void-filled), High-resolution soil and land use, and Potential land suitability for small-scale irrigation (SSI) Tools and models SWAT/APEX/FARMSIM models, Land suitability mapping tool, and Weather data bias correction tool
59 Outcome IDSS showed that the source of the water, and the most profitable technologies were different in each site and country, e.g. o Solar pumps are found to be economical and workable. o Labor was the major limitation on using low cost technology. Increased use of nutrients together with irrigation substantially improved agricultural production thereby providing a higher economic dividend. IDSS analysis showed that environmental impacts of SSI were minimal to modest as the interventions were implemented only on most suitable areas for irrigation a fraction of watershed area. IDSS analysis was critical to identify strategies to mitigate gaps and constraints of SSI. Upscaling showed promising results in terms of potential expansion/intensification, adoption and economic profit. More in depth small scale irrigation options need to be investigated such as water harvesting, ponds/tanks for communal irrigation.


60 PUBLICATIONS
61 Thank you! & Questions?