Trends of Area, Production and Productivity of Linseed in Different Districts of Chhattisgarh, India
|
|
|
- Merilyn Foster
- 5 years ago
- Views:
Transcription


1 International Journal of Current Microbiology and Applied Sciences ISSN: Volume 7 Number 07 (2018) Journal homepage: Original Research Article Trends of Area, Production and Productivity of Linseed in Different Districts of Chhattisgarh, India D.R. Agashe*, A.S.R.A.S. Sastri, Pandurang Bobade and Rajni Agashe Department of Agro meteorology, Indira Gandhi Krishi Vishwa Vidalaya Raipur C.G., India *Corresponding author A B S T R A C T K e y w o r d s Area, Production and Productivity, Linseed Article Info Accepted: 06 June 2018 Available Online: 10 July 2018 Time trend analysis of area of linseed shows that the area is decreasing at an alarming rate in all the major linseed growing districts including Raipur (@1812/yr; R = 0.85**), Rajnandgaon (@849/yr; R = 0.72**), Bilaspur (@824/yr; R = 0.78**), and Durg (@348/yr; R = 0.32), however decreasing area in Durg is not statistically significant. The reason being that in Chhattisgarh linseed crop is cultivated under utera cultivation under rice based rainfed cropping. The area in Raigarh (R = 0.87**) and Surguja (R = 0.83**) districts is increasing but these districts are not important as far as linseed area is concerned. The under Bastar district showed no sign of change. The production of linseed positively increased in Raigarh (R=0.80**), Bastar (R = 0.52**) and Surguja (R = 0.44*) districts due to increased area in these districts. Whereas, there is decreasing trend in Raipur (R = 0.38*) and Bilaspur (R = 0.05). The districts of Durg (R = 0.27) and Rajnandgaon (R= 0.14) also show increasing production trend, which is non-significant. The productivity of linseed is significantly increasing in all districts due to introduction of high yielding varieties and agricultural mechanization in recent years. Introduction India ranks third in the world in respect to area and production of linseed. Linseed is the principal oilseed crop grown in Chhattisgarh under utera in rainfed conditions. It occupies 34 % share in total oilseeds production in the state and 17% in India. The total area of linseed is 162 thousand ha, production is 74.7 thousand tonnes and productivity is 288 kg ha- 1 (Hegde, 2005). Despite the premier position, the country holds in the production of oilseed, the productivity level has remained virtually static in the last couple of year with no major breakthrough in achieving productivity enhancement and yield stabilization. This is mainly due to cultivation of oilseed crops under rain-fed condition (76%) and the vulnerability of the released cultivars to an array of stresses, both biotic and abiotic in nature. Materials and Methods The present study is carried out in the state Chhattisgarh, which came in to existence on 711
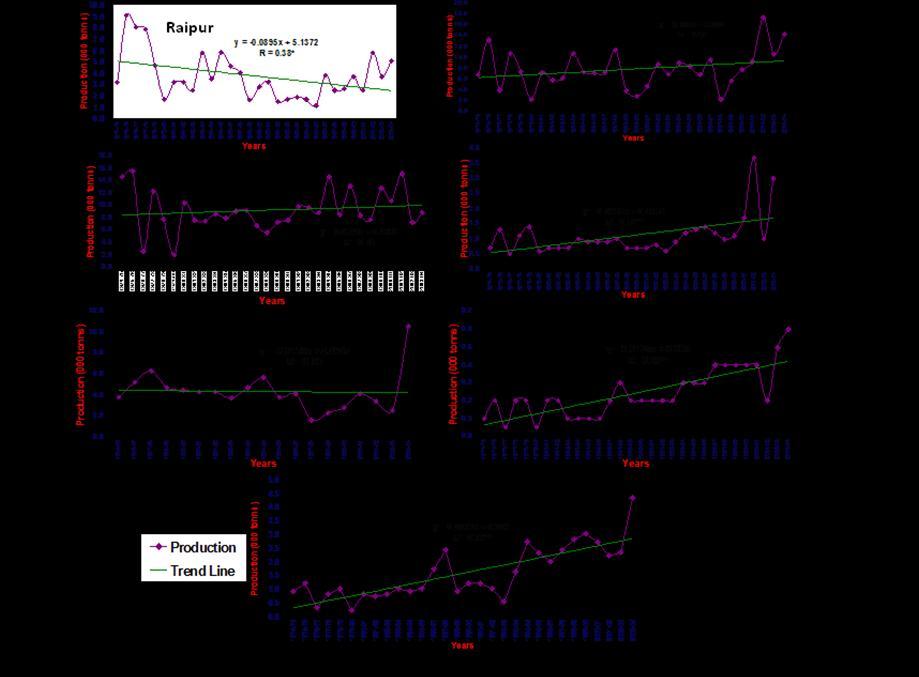
2 1 st Nov as a result of bifurcation of M.P. state. It lies in eastern part of India and located between N and N latitude and E and E longitude. Orrisa surrounds it in the east in the west by M.P. and Maharashtra, in the north by U.P. and Jarkhand and in the south by Andhra Pradesh. The study was carried out in 7 undivided districts of Chhattisgarh regions, which are: Table.1 The long term crop data in regard to area, production and productivity for groundnut sesames, linseed, rapeseed-mustard, soybean and total oilseeds that are grown during kharif and rabi seasons of different districts of Chhattisgarh were collected from the published records of department of Agriculture, Government of Madhya Pradesh, Bhopal and Government of Chhattisgarh, Raipur. Data were obtained for the period to and were used in present study. Trend analysis For temporal analysis of area, production and productivity of oilseeds crop in undivided districts of Chhattisgarh the time trend equations were constructed as: Y = a + b X S.No Station Latitude Longitude 1 Raipur N E 2 Durg N E 3 Rajnandgaon N E 4 Bastar N E 5 Bilaspur N E 6 Raigarh N E 7 Surguja N E Where, Y = area, production, productivity X = year a = intercept b = slope The slope indicates the trend of area, production and productivity over the study period. Results and Discussion Area The time trend pattern of the area of linseed in Raipur is depicted in Figure 1.1, which, shows that area is gradually decreasing. The largest area was observed in the year (73.4 thousand ha) and the lowest area was found in the year (11.3 thousand ha). The regression equation is Y = X and R value is 0.85, which is highly In Durg district, area of linseed largely fluctuated during the study period with decreasing trend as shown in Figure 1.1. The highest area was observed in the year (59.9 thousand ha) and the lowest area was observed in the year (24.1 thousand ha). The time trend regression equation is Y = X and R value is 0.32, which is non- significant. In Rajnandgaon district, the area of linseed decreased gradually as shown in Fig The 712
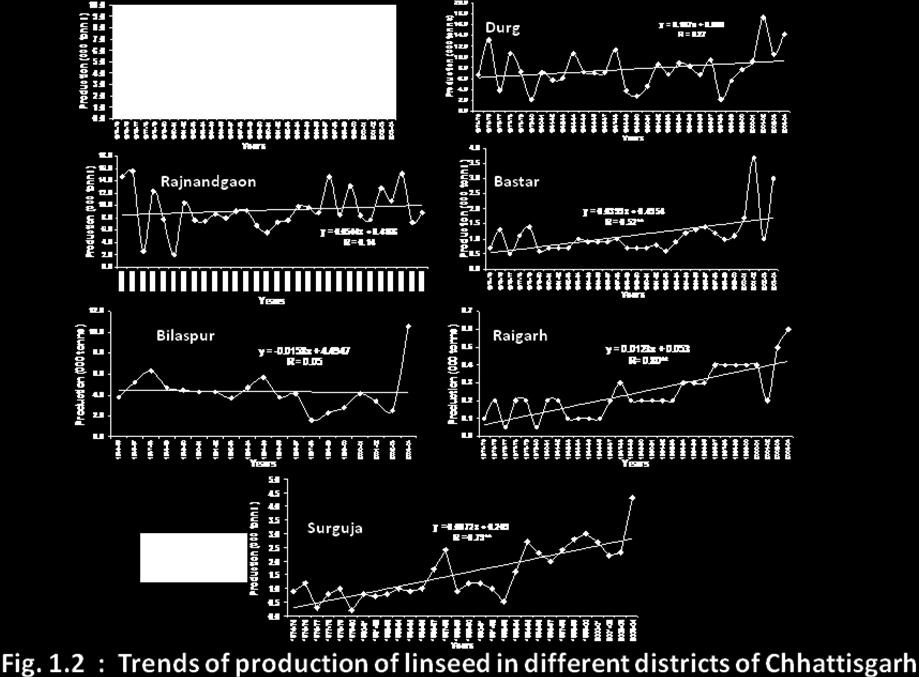
3 highest area of 74.0 and the lowest area of 22.5 were observed in the years and , respectively. The trend of regression equation is Y = X and R value is 0.72, which is statistically highly The time trend pattern of area of linseed for different years in Bastar district is shown in Fig Figure shows high interannual variability. The highest area was observed in the year (10.8 thousand ha.) and the lowest area was found in the year (2.8 thousand ha). The regression equation is Y = X and R value is 0.16, which is non- significant. Linseed crop in Bilaspur district was introduced in and since then the area is continuously decreasing as shown in Fig The highest area was observed in the year (33.3 thousand ha) and lowest area was observed in the year (7.7 thousand ha). The time trend equation is Y = X and R value is 0.78, which is In Raigarh district, the area under linseed in increases slowly (41 ha/ year -1 ) but constantly as shown in Fig The highest area was found in the year (2.1 thousand ha) and the lowest area was found in the year (0.5 thousand ha). The regression equation is Y = X and R value is 0.87, which is highly significant at 1% probability level. In Surguja district, the area of linseed has increased considerably during the study period as shown in Figure 1.1. The highest area was found in the year (15.0 thousand ha) and the lowest area was found in the year (3.1 thousand ha). The regression equation is Y = X and R value is 0.83, which is highly significant at 1 % probability level. Time trend analysis of area of linseed shows that the area is decreasing at an alarming rate in all the major linseed growing districts including Raipur (@1812/yr; R = 0.85**), Rajnandgaon (@849/yr; R = 0.72**), Bilaspur (@824/yr; R = 0.78**), and Durg (@348/yr; R = 0.32), however decreasing area in Durg is not statistically significant. The reason being that in Chhattisgarh linseed crop is cultivated under utera cultivation under rice based rainfed cropping. The area in Raigarh (R = 0.87**) and Surguja (R = 0.83**) districts is increasing but these districts are not important as far as linseed area is concerned. The under Bastar district showed no sign of change. Production In Raipur, linseed production witnessed high degree of fluctuations with overall negative trend as shown in Figure 1.2. The highest production was found in the year (9.1 thousand tonnes) and the lowest the production was found in the year (1.1 thousand tonnes). The time trend equation is Y = X and R value 0.38, which is significant at 5 % probability level. The production pattern of linseed in Durg for different years has been depicted in Figure 1.2. A large year-to-year variation has been observed in linseed yield during study period. The highest production was found in the year (16.3 thousand tonnes), whereas, lowest production was found in the year (2.1 thousand tonnes). The regression equation is Y = X and R value is 0.27, which is non-significant. The production of linseed has highly fluctuated in Rajnandgaon as shown in Figure 1.2. The highest production was found in the year (15.6 thousand tonnes) and the lowest in the year (2.0 thousand tonnes). The regression equation is Y = X and R value is 0.14, which is non- 713
, whereas, lowest production was found in the year 1976-77 (0.5 thousand tonnes). The regression equation is Y = 0.0399 X +0.4954 and R value is 0.")
 and the lowest production was observed in the year from 1997-89. The regression equation is Y = - 0.0158 X +4.4947 and R value is 0.05, which is non-significant.")
4 significant. In Bastar district, the production of linseed stagnated in the different years as shown in Figure 1.2. The highest production was found in the year (3.7 thousand tonnes), whereas, lowest production was found in the year (0.5 thousand tonnes). The regression equation is Y = X and R value is 0.52, which is significant at 1 % probability level. The production of linseed in Bilaspur followed large-scale interannual variations as shown in Figure 1.2. The highest production was observed in the year (10.8 tonnes) and the lowest production was observed in the year from The regression equation is Y = X and R value is 0.05, which is non-significant. The production pattern of linseed in Raigarh district observed slow but steady growth as shown in Figure 1.2. The highest production was found in the year (0.6 thousand tonnes), whereas, lowest production was found in the year (0.05 thousand tonnes). The regression equation is Y = X and R value is 0.80, which is highly The linseed production in Surguja district observed large year-to-year variations with overall positive growth of 0.79 tonnes per year as shown in Figure 1.2. The highest production was found in the year (6.7 thousand tonnes) and the lowest production was found in the year (0.2 thousand tonnes). The time trend regression equation is Y = X and R value is 0.79, which was highly significant at 1 % probability level. The production of linseed positively increased in Raigarh (R=0.80**), Bastar (R = 0.52**) and Surguja (R = 0.44*) districts due to increased area in these districts. Whereas, there is decreasing trend in Raipur (R = 0.38*) and Bilaspur (R = 0.05). The districts of Durg (R = 0.27) and Rajnandgaon (R= 0.14). 714

5 715
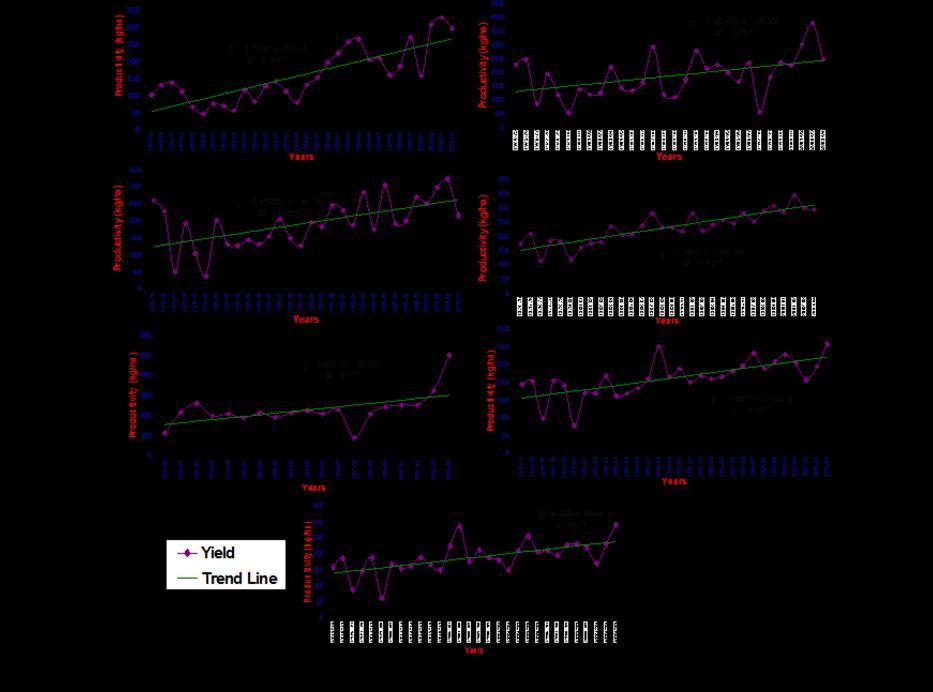
6 Productivity In Raipur district, the linseed productivity increases (Fig. 1.3) at the rate of 7.4 kg/ha/year. The highest productivity was found in the year (326 kg ha -1 ) and the lowest yield was found in the year (64 kg ha -1 ). The regression equation is Y = X and R value is 0.81, which is highly The trend of productivity of linseed showed, fluctuations in Durg district in different years as shown in Figure 1.3. The highest productivity of 384 kg ha -1 and the lowest productivity of 58 kg ha -1 were observed in the years and , respectively. The time trend equation is Y = X and R value is 0.45, which is significant at 5 % probability level. The trend of productivity of linseed in Rajnandgaon district has been depicted in Figure 1.3, which showed overall positive growth of 4.8 kg/ha/year. The highest productivity was found in the year (324 kg ha -1 ), whereas, lowest productivity was found in the year (40 kg ha -1 ). The regression equation is Y = X and R value is 0.59, which is highly In Bastar district, the productivity of linseed consistently increased as shown in Figure 1.3. The highest productivity of 343 kg ha -1 and the lowest productivity of 114 kg ha -1 were observed in the years and The time trend regression equation is Y = X and R value is 0.87, which is highly The productivity of linseed in Bilaspur district also increased as shown in Figure 1.3. The highest productivity was found year (516 kg ha -1 ) and the lowest productivity (93 kg ha -1 ) was found in the year (94 kg ha -1 ). The time trend regression equation is Y = X and R value is 0.55, which is In Raigarh district, the productivity of linseed increased consistently as shown in Figure 1.3. The highest productivity was found in the year (309 kg ha -1 ) and the lowest productivity was found in the year (81 kg ha -1 ). The time trend regression equation is Y = X and R value is 0.69, which is significant at 1 % probability level. In Surguja district, the time trend of productivity of linseed observed positive growth of 3.4 kg/ha/ year as shown in Figure 1.3. The highest productivity of 292 kg ha -1 and the lowest productivity of 61 kg ha -1 were found in the years and , respectively. The regression equation is Y = X and R value is 0.62, which is The productivity of linseed is significantly increasing in Raipur (R=0.81**), Durg (R = 0.45*), Rajnandgaon (R = 0.59**), Bastar (R = 0.87**), Bilaspur (R = 0.55**), Raigarh (R = 0.69**) and Surguja (R = 0.62**) districts due to introduction of high yielding varieties and agricultural mechanization in recent years. Sodhiya (1990) estimated the linear trend in area, production and productivity of 10 major crops in Sagar division, Madhya Pradesh, for the period to He covered various crops such as wheat, rice, sorghum, millet, barley (in the cereal group), chickpea, lentil (pulse group) and linseed, sesamum, and soybean (in the oilseed crop). He found that crop such as sorghum and millet is decreasing, while, the production was increasing of some inferior crop like sesamum. 716
7 References Hegde, D.M Oilseed Scenario Past, Present and Future with special reference to rapeseed-mustard. In: Winter school held at National center for Rapeseed-Mustard, Sewar, Bhartpur, Rajasthan. pp. 1. Gauraha, A.K., Shrivastava, R.S.L., Banafar, K.N.S. and Mathur, P Production performance resource use efficiency, technology adoption and constraints in chickpea production in Durg district of Chhattisgarh International Chickpea Conference, Raipur, C.G., India, pp How to cite this article: Agashe, D.R., A.S.R.A.S. Sastri, Pandurang Bobade and Rajni Agashe Trends of Area, Production and Productivity of Linseed in Different Districts of Chhattisgarh, India. Int.J.Curr.Microbiol.App.Sci. 7(07): doi: 717