Integrating Agricultural Land Management into a Watershed Response Model
|
|
|
- Joshua Jefferson
- 5 years ago
- Views:
Transcription


1 Integrating Agricultural Land Management into a Watershed Response Model Adam Freihoefer, Tom Beneke, & Aaron Ruesch Wisconsin Department of Natural Resources NCASI Northern Region Meeting May 6, 2014


2 Algal blooms due to excessive phosphorus Petenwell Lake 2


3 Typical Sources of Phosphorus Non MS4 Stormwater Construction Nonpoint Sources Agricultural Runoff Barnyards Rill, Gully, & Bank Erosion Point Sources Industrial Waste Municipal Waste 3


4 Simulating Water Quality with a Watershed Response Model Climate Precipitation, Temp, etc. Hydrology Flow accumulation, Internal drainage, groundwater Topography Slope Soils Type and Attributes Land Cover & Management Water Quality Point Sources 4


5 Agricultural Land Management in Wisconsin Dairy Farming Potatoes Managed Grazing Cranberry Harvest Tillage Manure Application catalog.tamu.edu 5
6 Agricultural Land Management Assessment Objective Create a spatiotemporal definition of crop rotations in the Wisconsin River Basin (6 year crop sequence with associated tillage and nutrient applications) 6


7 Wisconsin River Basin 9,156 square miles of from the headwaters in Vilas County to Lake Wisconsin in Columbia County Drains 14% of the state with contributions from 23 counties 7


8 Finding a Balance in Data Collection What scale are we working on? Field < Subwatershed < County Barnyards Cattle Crossings Bank erosion sites Homogenous management operations Nutrient Management Plan Field scale Countywide 8


9 Information Needed for the Agricultural Assessment Corn Grain Corn Grain Alfalfa Alfalfa Alfalfa Alfalfa Crop Sequence Corn Grain Soybean Corn Grain Soybean Corn Grain Soybean Potato Corn Grain Carrots Soybean Potato Corn Grain Tillage Timing Fertilizer # cows, application rate 9
10 Information Needed for the Agricultural Assessment Year Date Operation Crop / Type Rate Units /29 Manure Liquid 10,000 gallons/acre /1 Tillage Cultivator /15 Plant Corn Grain /15 Fertilizer 9:23: lbs/acre /1 Harvest Corn Grain /10 Tillage Chisel Plow /29 Manure Liquid 10,000 gallons/acre /1 Tillage Cultivator /15 Plant Corn Silage /15 Fertilizer 9:23: lbs/acre /15 Harvest Corn Silage /20 Tillage Chisel Plow /29 Manure Liquid 10,000 gallons/acre /1 Tillage Cultivator /15 Plant Corn Silage /15 Fertilizer 9:23: lbs/acre /15 Harvest Corn Silage /20 Tillage Chisel Plow /10 Manure Liquid 10,000 gallons/acre /12 Tillage Cultivator /15 Direct Seed Alfalfa /15 Harvest Alfalfa /1 Harvest Alfalfa /15 Harvest Alfalfa /1 Harvest Alfalfa /1 Harvest Alfalfa /15 Harvest Alfalfa /1 Harvest Alfalfa /5 Manure Liquid 10,000 gallons/acre /7 Tillage Chisel Plow 10
11 How did we obtain the information? 1 Define agricultural extent 2 Identify & categorize crop change per parcel using satellite imagery 3 Assemble local information to further refine rotations 4 Integrate local information into rotation coverage 5 Confirm agricultural management with observed data 11
12 How did we obtain the information? 1 Define agricultural extent 12
 of the basin is agriculture")

13 Wisconsin River Basin Agricultural Distribution 25% (2,300 mi 2 ) of the basin is agriculture Majority of agricultural acreage found in Marathon, Wood, Portage, Juneau, Sauk, & Columbia counties 13


14 How did we obtain the information? 1 Define agricultural extent 2 Identify & categorize crop change per parcel using satellite imagery 14


15 Using Satellite Imagery to Identify Cropping USDA NASS Cropland Data Layer 15


16 Using Satellite Imagery to Identify Cropping 2008 Soybean Yellow = Corn Dark Green = Soybean Field Boundary 16

17 Using Satellite Imagery to Identify Cropping 2009 Corn 17

18 Using Satellite Imagery to Identify Cropping 2010 Soybean 18

19 Using Satellite Imagery to Identify Cropping 2011 Corn 19


20 Using Satellite Imagery to Identify Cropping 2012 Corn 20

21 Using Satellite Imagery to Identify Cropping 2008 = Soybean 2009 = Corn 2010 = Soybean 2011 = Corn 2012 = Corn Cash Grain S C S C C, C S C S C, S C C S C, C C C C S, S S S S C 21


22 Types of Agriculture in the Wisconsin River Basin Dairy Corn / Soybean / Alfalfa Cash Grain Corn / Soybean Continuous Corn Corn Potato / Vegetable Potato w/ Veggie and/or Corn Pasture 22

23 How did we obtain the information? 1 Define agricultural extent 2 Identify & categorize crop change per parcel using satellite imagery 3 Assemble local information to further refine rotations 23


24 Using Local Information to Complete Crop Rotations Does our crop rotation map correctly depict rotations in your county? What is the type and timing of each rotation s tillage and nutrient applications? 24


25 Digitizing County Land Management Information 25
26 How did we obtain the information? 1 Define agricultural extent 2 Identify & categorize crop change per parcel using satellite imagery 3 Assemble local information to further refine rotations 4 Integrate local information into rotation coverage 26
27 Generalization of a Dairy Rotation WDNR s Initial Idea County Rotations Generalized Rotations Cropland Data Layer Local Knowledge Model Integration 2 3 Years CG, CS, SOY 3 4 Years Alfalfa Manure? Tillage? 3YR CS, 3 Alfalfa 10,000 GPA LQ Manure Spring Cultivator, Fall Chisel 1YR CG, 1 YR CS, 4 Alfalfa 12,000 GPA LIQ Manure Spring /Fall Moldboard 2YR CS, 4 Alfalfa 15,000 GPA LQ Manure Spring Cultivator, Fall Chisel 2YR CS, 1 YR Oats, 3 Alfalfa 10 GPA LQ Manure Spring Cultivator, Fall Chisel 2YR CG, 1YR CS, 3 Alfalfa 11,000 GPA LIQ Manure Spring Disk, Fall Chisel 2 CS, 1 CG, 3 Alfalfa 10,000 GPA LQ Manure (50% spring, 50% fall) Spring, Fall Moldboard 1YR CG, 1 YR CS, 4 Alfalfa 10,000 GPA LQ Manure (50% spring, 50% fall) Spring Disk / Fall Chisel 27


28 Using Local Information to Complete Crop Rotations Watershed Response Model Input County level tillage, fertilizer, manure, & timing Information per ¼ section Rotations from cropland data layer analysis per parcel 28
29 Using Local Information to Complete Crop Rotations Watershed Response Model Input Year Date Operation Crop / Type Rate Units /29 Manure Liquid 10,000 gallons/acre /1 Tillage Cultivator /15 Plant Corn Grain /15 Fertilizer 9:23: lbs/acre /1 Harvest Corn Grain /10 Tillage Chisel Plow /29 Manure Liquid 10,000 gallons/acre /1 Tillage Cultivator /15 Plant Corn Silage /15 Fertilizer 9:23: lbs/acre /15 Harvest Corn Silage /20 Tillage Chisel Plow /29 Manure Liquid 10,000 gallons/acre /1 Tillage Cultivator /15 Plant Corn Silage /15 Fertilizer 9:23: lbs/acre /15 Harvest Corn Silage /20 Tillage Chisel Plow /10 Manure Liquid 10,000 gallons/acre /12 Tillage Cultivator /15 Direct Seed Alfalfa /15 Harvest Alfalfa /1 Harvest Alfalfa /15 Harvest Alfalfa /1 Harvest Alfalfa /1 Harvest Alfalfa /15 Harvest Alfalfa /1 Harvest Alfalfa /5 Manure Liquid 10,000 gallons/acre /7 Tillage Chisel Plow 29


30 How did we obtain the information? 1 Define agricultural extent 2 Identify & categorize crop change per parcel using satellite imagery 3 Assemble local information to further refine rotations 4 Integrate local information into rotation coverage 5 Confirm agricultural management with observed data 30


31 County Transect Surveys 31


32 County Transect Surveys Marathon County Transect Points # of Corn Years within Dairy Rotations 403 Transect Points Average Corn Years in 6 year Rotation = 2.16 Number of Transects Corn Years in 6 Year Period 32
 100,000")

33 Crop Acreage Average Annual Corn Acreage Cropland Data Layer vs. DNR Rotation Approach 120,000 Average Annual Corn (Acres) 100,000 80,000 60,000 40,000 20,000 0 Marathon Juneau Lincoln Sauk Adams Wood CDL (Avg. Acres of Corn/Year) DNR Approach (Acres of Corn/Year) 33
 600,000 500,000 Tons / Year 400,000 300,000 200,000 100,000 0 Marathon Juneau")
34 Manure Manure Comparison (NASS vs. DNR Rotation Approach) 600, ,000 Tons / Year 400, , , ,000 0 Marathon Juneau Lincoln Sauk Adams Wood NASS Census (tons per yr) DNR Approach (tons) 34

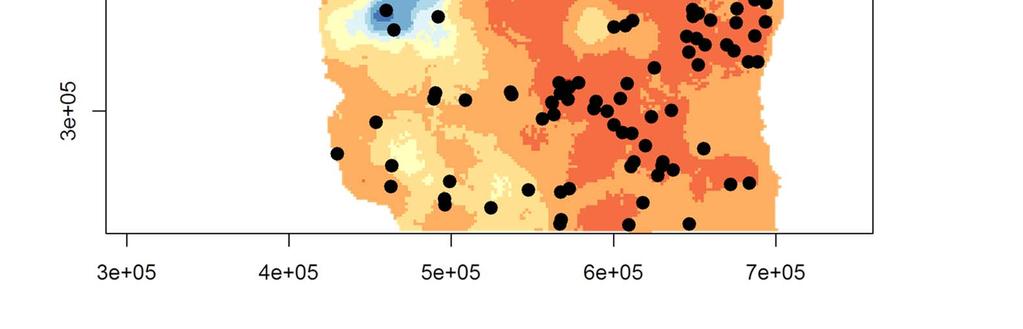
35 Dairy operations and CAFOs 35

36 Dairy operations and CAFOs R 2 = 0.72 R 2 =

37 Dairy operations and CAFOs 37


38 Distribution of Agricultural Land Management Agricultural Extent 38


39 Distribution of Agricultural Land Management Agricultural Extent DAIRY CASH GRAIN 2CG 4A, 10K LIQ Manure, Moldboard Plow 2CG 4A, 20 Ton Daily Haul, Moldboard Plow 2CS 4A, 20 Ton Daily Haul, Moldboard Plow Cash Grain, Cultivator Cash Grain, No Till Continuous Corn, Cultivator Pasture 39

40 Summary Method provides an efficient and replicable spatiotemporal definition of agricultural that supports nonpoint source mitigation Additional years and accuracy of the USDA Cropland Data Layer will improve analysis Supplemental datasets such as transects were valuable for confirming results While regional validation would be needed, approach could be applied statewide to support various water resource issues 40


41 Questions? 41