Farm Radio Habits Wave 1, Winter Conducted by Millennium Research, Inc.
|
|
|
- Bertha Boone
- 6 years ago
- Views:
Transcription

1 Farm Radio Habits Wave 1, Winter 2015 Conducted by Millennium Research, Inc.


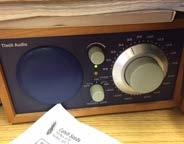
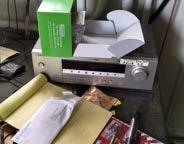
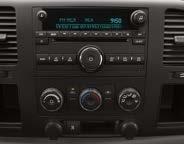

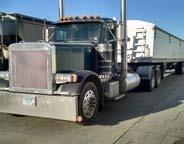
2 TAKE A PICTURE OF THE RADIO YOU LISTEN TO THE MOST OFTEN? 2


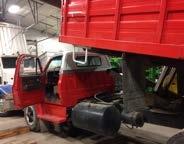
3 Radio Is An Important Part Of Farmers And Ranchers Day I started my day, like everyday, with the radio tuned to my favorite local farm radio station and a cup of joe. Aaahhh The radio and coffee are two of my favorites to start the day. My husband, Doug, we are listening to the radio in the lambing barn.


4 One Radio Can Reach More Than One Person At A Time My son. My son listens with me. Man, does he love farming. This is my oldest son who farms with me. He also has a full-time job as a jailer/dispatcher for the Cottonwood Sheriff department where he has a farm radio station to listen to. He is a dedicated radio listener for weather and markets. My brother.


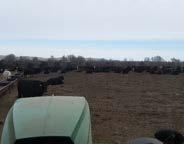
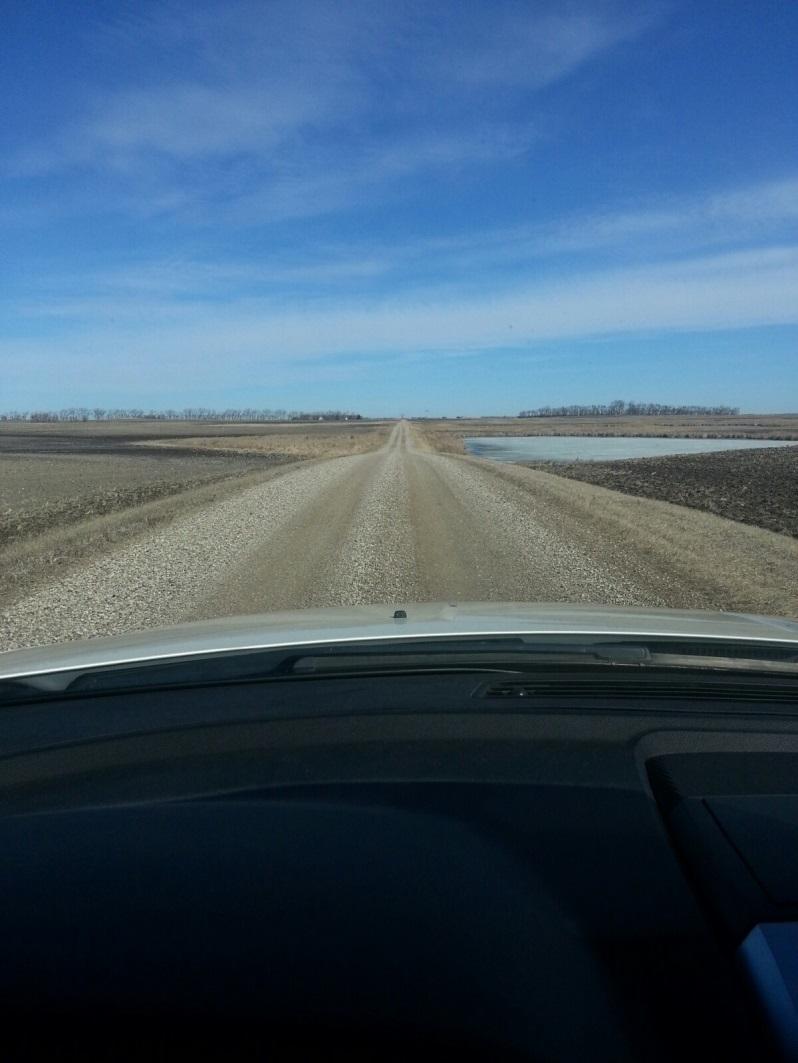

5 WHERE ARE YOU WHEN YOU RE LISTENING?
6 Methodology 300 sample size per quarter, total of 1200 survey completes by end of 2015 Sample size focused to farmers and ranchers within 75 mile radius of station airing content produced by NAFB member $100,000 plus Gross Farm Income (GFI) operations Nationwide survey, calls per state based on percentage of state GFI operations, 2012 USDA Census Data State $100K+ Farms % of US total Iowa 36,381 9% Minnesota 24,991 6% Illinois 24,811 6% Nebraska 21,467 6% California 20,558 5% Texas 17,489 5% Wisconsin 17,146 4% Kansas 15,765 4% Ohio 15,324 4% Indiana 14,313 4% South Dakota 13,028 3% North Dakota 12,556 3% Missouri 12,415 3% Pennsylvania 11,814 3% Michigan 9,396 2% North Carolina 8,331 2% Arkansas 7,506 2% Oklahoma 7,434 2% Montana 7,341 2% Georgia 7,307 2% New York 7,125 2% Kentucky 6,340 2% Washington 6,102 2% Colorado 5,633 1% Florida 5,224 1% Idaho 5,096 1% Alabama 4,852 1% Mississippi 4,740 1% Oregon 4,646 1% Virginia 4,431 1% Tennessee 4,160 1% Louisiana 3,288 1% Wyoming 2,763 1% Maryland 2,521 1% South Carolina 2,061 1% Utah 1,983 1% New Mexico 1,741 Arizona 1,451 New Jersey 1,123 Vermont 1,109 Delaware 1,021 Nevada 875 West Virginia 862 Maine 778 Massachusetts 758 Hawaii 506 Connecticut 458 New Hampshire 264 Rhode Island 108 Alaska 87

7 Sample By Age And Regions Ages Sample Regions Northeast South Midwest West States CT, DE,MA, MD, ME, NH, NJ, NY, PA, RI, VA, VT, WV AL, AR, FL, GA, KY, LA, MS, NC, OK, SC, TN, TX IA, IL, IN, KS, MI, MN, MO, ND, NE, SD, WI, OH AZ, CA, CO, ID, MT, NM, NV, OR, UT, WA, WY
8 Most Respondents Are Either Sole or Senior Decision Makers, One-Third Are Joint Decisions With Farming Partners What is your decision making role? % 6% 16% 18% Sole Joint Primary Recommend 12% 11% 7% 12% 11% 19% % 37% 41% 19% 33% 45% 35% 58% 41% Overall Midwest Northeast South West
9 Research Targeted Larger Revenue Operations Percent of respond ents What was your total farm revenue in 2014? $100,000 to $250,000 $250,000 to $500,000 $500,000 to $1 million $1 to $2 million $2 to $5 million $5 million plus 3% 3% 7% 17% 16% 6% 16% 19% 12% 31% 33% 29% 24% 33% 26% 29% 34% 23% 17% 26% 26% 16% 12% 21% Overall Midwest Northeast South West
10 83% of Farmers Listen To Farm Radio For News, Weather, Markets And Ag Information % Do you listen to farm news, weather, markets and ag information? 85% 71% 82% 85% Overall Midwest Northeast South West
11 All Ages Listen To Farm Radio Do you listen to farm news, weather, markets and ag information? 83% 84% 83% 6 5 Overall 49 and Younger 50 and Older

12 83% Listen Multiple Days Per Week 10 How many days of the week (Monday-Friday) do you listen to farm radio? Five days Four days Three days Two days One day % 7% 7% 6% 8% 8% 7% 8% 12% 12% 4% 7% 5% 9% 14% 9% 7% 61% 65% 56% 49% 62% Overall Midwest Northeast South West Zero days accounts for missing percentages. Young farmers listen an average of 3.6 days per week, compared to 3.9 for older listeners.
13 Radio Is Mobile and Available In Multiple Locations 10 Where do you typically listen to farm news, weather and commodity markets on the radio? Driving In the field Trucking House Shop Barn Office % 67% 65% % 44% 44% 42% 42% 42% 39% 34% 36% 35% 33% 32% 29% 29% 26% 26% 27% 25% 19% 17% 17% 18% 14% 13% 7% 7% 7% 6% 3% Overall Midwest Northeast South West
14 Age Doesn t Impact Where They Listen 10 Where do you typically listen to farm news, weather and commodity markets on the radio? Driving In the field Trucking House Shop Barn Office % 67% % 41% 34% 35% 36% 38% 37% 25% 14% 13% 25% 27% 18% 15% 11% Overall 49 and Younger 50 and Older
15 Farm Radio Is On During The Day 10 When during the day do you listen to the radio for farming news, weather, markets and ag information? Morning Noon Afternoon Evening % 28% 15% 16% 6 53% 13% 7% 69% 38% 15% 5% 79% 5 24% 18% Overall Midwest Northeast South West
16 43% of Farm Radio Listeners Also Listen On Saturdays 10 9 Do you listen to farm news, weather, markets and ag information on Saturday? Saturday programming is not available in all markets % 5 43% 43% 33% Overall Midwest Northeast South West
17 Farmers Watch Television For Ag Related Programming And Information 10 Do you watch television for any ag related programming and information? % 56% 53% 57% 5 41% Overall Midwest Northeast South West


18 HOW ARE FARM BROADCASTERS REGARDED BY THEIR FARMER LISTENERS? Farm broadcasters are considered very credible, trustworthy and accurate by a vast majority of listeners.
19 Local Farm Broadcasters Are Very Highly Rated On Providing Accurate Information, Rating 8.2 On Average 10 9 Please rate your farm broadcaster on a scale of 1 to 10, where 10 is excellent on: Provides accurate information? % 27% 29% 27% 26% 15% 24% 33% 24% 27% 19% 16% Overall Midwest Northeast South West
20 Young Listeners Rate Their Broadcaster Higher Than Older Listeners For Providing Accurate Information 10 9 Please rate your farm broadcaster on a scale of 1 to 10, where 10 is excellent on: Provides accurate information? % 25% 19% 21% 24% 26% 17% Overall 49 and Younger 50 and Older
21 Local Farm Broadcasters Are Highly Rated On Providing Timely Information, Averaging 8.0 On A 10-point Scale 10 9 Please rate your farm broadcaster on a scale of 1 to 10, where 10 is excellent on: Provides timely information? % 27% 27% 24% 32% 11% 13% 13% 12% 8% 32% 31% 27% 37% Overall Midwest Northeast South West
22 Younger Listeners Give Their Broadcaster Even Higher Marks Than Older Listeners On Timely Information 10 9 Please rate your farm broadcaster on a scale of 1 to 10, where 10 is excellent on: Provides timely information? % 36% 23% 11% 7% 14% 32% 28% 34% Overall 49 and Younger 50 and Older
23 RESPONDENT PROFILE
24 On Average, Respondents Farm Almost 2,400 Acres Average Number of Acres How many total acres did you plant or harvest in 2014? Overall Midwest Northeast South West
25 Corn Is The Most Frequently Planted Crop By Respondents 65% Crops planted in % 5 46% 26% 12% 6% Corn Soybeans Wheat Alfalfa Cotton Vegetables
26 Half Of Respondents Have Livestock or Dairy Operations Do you have any dairy or livestock in your operation? % 43% 47% 63% 55% Overall Midwest Northeast South West
27 Beef Cow/Calf Leads The Type Of Livestock Respondents Raise What type of livestock? 10 9 Cow/calf Feedlot Dairy Swine 86% 87% % 67% 63% 5 35% 19% 17% 18% 14% 13% 15% 12% 13% 8% 7% 4% 4% Overall Midwest Northeast South West
28 For more information and additional media usage information, please contact NAFB Marketing and Communications Manager, Mindy Oberly
The Pyrogeographyof Wildfires in the Western U.S.
 The Pyrogeographyof Wildfires in the Western U.S. Dr. Michael Medler 1 2 3 4 The pumps buy you time, but minutes only. From this moment, no matter what we do, Titanic will founder. But this ship can't
STATE LEGISLATIVE ACTION FOR THE DEVELOPMENT OF A HEMP INDUSTRY IN THE U.S. Hawaii Representative Cynthia Henry Thielen
 (AL) Alabama -- -- -- (AK) Alaska -- -- (AZ) Arizona -- (AR) Arkansas -- SR13 (adopted 1999): Requires the University of Arkansas to conduct studies to determine the feasibility of growing hemp as an alternative
Radiology Staffing Survey 2010
 Radiology Staffing Survey 2010 A Nationwide Survey of Registered Radiologic Technologists Conducted by the American Society of Radiologic Technologists Reported June 2010 2010 ASRT. All rights reserved.
WHAT WE KNOW ABOUT THE DEMOGRAPHICS OF U.S. FARM OPERATORS
 Agricultural Outlook Forum 2005 Presented: Friday, February 25, 2005 WHAT WE KNOW ABOUT THE DEMOGRAPHICS OF U.S. FARM OPERATORS Prepared by Rich Allen and Ginger Harris National Agricultural Statistics
Fiscal Year 2010 Drinking Water and Ground Water Statistics
 Fiscal Year 2010 Drinking Water and Ground Water Statistics U.S. Environmental Protection Agency Office of Ground Water and Drinking Water EPA 817K11001 June 2011 Table of Contents Introduction... 4 Acronyms
Born on a Bike, Kitchen Crafted, Family and Employee-owned BRUCE LYMBURN GENERAL COUNSEL AND SECRETARY
 Born on a Bike, Kitchen Crafted, Family and Employee-owned BRUCE LYMBURN GENERAL COUNSEL AND SECRETARY Origins of Clif Bar & Company In 1990 Gary Erickson was living in a garage in Emeryville, working
Watershed Condition Framework
 US Forest Service - Watershed Condition Classification Maps http://www.fs.fed.us/publications/watershed/ Page 1 of 2 1/9/2013 Watershed Condition Framework The Forest Service has released the first national
Farms and Land in Farms
 United States Department of Agriculture National Agricultural Statistics Service Farms and Land in Farms February 2003 Sp Sy 3 (03) Up Slightly in 2002 The number of farms in the United States in 2002
The story of renewable energy
 The story of renewable energy International clean energy projects 27 June 2011 Our renewable energy team of 15 years Dedicated renewable energy team based in Toronto, servicing Canada and the North American
Knowledge Exchange Report
 Knowledge Exchange Report February 2016 The Economic Impact of a Minimum Wage Increase on New York State Agriculture New York State is considering a minimum wage increase from $9.00 to $15.00 statewide.
1. Audited Media Platforms. 2. Publication Information
 Audit Period: January 1, 2015 December 31, 2015 Vitamin Retailer 431 Cranbury Road, Suite C East Brunswick, NJ 08816 (732) 432 9600 EMAIL: danm@vrmmedia.com (732) 432 9288 FAX www.vitaminretailer.com 1.
Crop Progress. Corn Planted - Selected States [These 18 States planted 92% of the 2016 corn acreage] Corn Emerged - Selected States ISSN:
![Crop Progress. Corn Planted - Selected States [These 18 States planted 92% of the 2016 corn acreage] Corn Emerged - Selected States ISSN:](/thumbs/83/87811397.jpg "Crop Progress. Corn Planted - Selected States [These 18 States planted 92% of the 2016 corn acreage] Corn Emerged - Selected States ISSN:") Crop Progress ISSN: 00 Released May, 0, by the National Agricultural Statistics Service (NASS), Agricultural Statistics Board, United s Department of Agriculture (USDA). Corn Planted Selected s [These
Crop Progress ISSN: 00 Released May, 0, by the National Agricultural Statistics Service (NASS), Agricultural Statistics Board, United s Department of Agriculture (USDA). Corn Planted Selected s [These
Crop Progress. NASS Survey Update!
 Crop Progress ISSN: 00 Released May, 0, by the National Agricultural Statistics Service (NASS), Agricultural Statistics Board, United s Department of Agriculture (USDA). NASS Survey Update! In the first
Crop Progress. Corn Planted - Selected States [These 18 States planted 92% of the 2017 corn acreage] Corn Emerged - Selected States ISSN:
![Crop Progress. Corn Planted - Selected States [These 18 States planted 92% of the 2017 corn acreage] Corn Emerged - Selected States ISSN:](/thumbs/85/91512831.jpg "Crop Progress. Corn Planted - Selected States [These 18 States planted 92% of the 2017 corn acreage] Corn Emerged - Selected States ISSN:") Crop Progress ISSN: 00 Released April 0, 0, by the National Agricultural Statistics Service (NASS), Agricultural Statistics Board, United s Department of Agriculture (USDA). Corn Planted Selected s [These
Crop Progress ISSN: 00 Released April 0, 0, by the National Agricultural Statistics Service (NASS), Agricultural Statistics Board, United s Department of Agriculture (USDA). Corn Planted Selected s [These
U.S. Drought Monitor, August 28, 2012
 University of Nebraska - Lincoln DigitalCommons@University of Nebraska - Lincoln US Ag in Drought Archive Drought -- National Drought Mitigation Center 8-28-2 U.S. Drought Monitor, August 28, 2 Brian Fuchs
U.S. Drought Monitor, September 4, 2012
 University of Nebraska - Lincoln DigitalCommons@University of Nebraska - Lincoln US Ag in Drought Archive Drought -- National Drought Mitigation Center 9--12 U.S. Drought Monitor, September, 12 Brian Fuchs
Crop Progress. Corn Planted - Selected States [These 18 States planted 92% of the 2017 corn acreage]
![Crop Progress. Corn Planted - Selected States [These 18 States planted 92% of the 2017 corn acreage]](/thumbs/87/95248897.jpg "Crop Progress. Corn Planted - Selected States [These 18 States planted 92% of the 2017 corn acreage]") Crop Progress ISSN: 00 Released April, 0, by the National Agricultural Statistics Service (NASS), Agricultural Statistics Board, United s Department of Agriculture (USDA). Corn Planted Selected s [These
Crop Progress ISSN: 00 Released April, 0, by the National Agricultural Statistics Service (NASS), Agricultural Statistics Board, United s Department of Agriculture (USDA). Corn Planted Selected s [These
Crop Progress. Special Note
 Crop Progress ISSN: 0 Released November, 0, by the National Agricultural Statistics Service (NASS), Agricultural Statistics Board, United s Department of Agriculture (USDA). Special Note COMING SOON NASS
Crop Progress. Corn Harvested Selected States [These 18 States harvested 94% of the 2017 corn acreage]
![Crop Progress. Corn Harvested Selected States [These 18 States harvested 94% of the 2017 corn acreage]](/thumbs/89/99253316.jpg "Crop Progress. Corn Harvested Selected States [These 18 States harvested 94% of the 2017 corn acreage]") Crop Progress ISSN: 00 Released October, 0, by the National Agricultural Statistics Service (NASS), Agricultural Statistics Board, United s Department of Agriculture (USDA). Corn Harvested Selected s [These
Crop Progress ISSN: 00 Released October, 0, by the National Agricultural Statistics Service (NASS), Agricultural Statistics Board, United s Department of Agriculture (USDA). Corn Harvested Selected s [These
U.S. Drought Monitor, July 31, 2012
 University of Nebraska - Lincoln DigitalCommons@University of Nebraska - Lincoln US Ag in Drought Archive Drought -- National Drought Mitigation Center -3-2 U.S. Drought Monitor, July 3, 2 Mark D. Svoboda
TABLE OF CONTENTS. Association of Food and Drug Officials. About the Survey State Survey Responders Agency Survey Responders...
 TABLE OF CONTENTS Association of Food and Drug Officials About the Survey... 1 State Survey Responders... 2 Agency Survey Responders... 3 State Assessment Survey... 7 Survey Summary... 11 Tables and Graphs:
The Oklahoma First Energy Plan: A Pragmatic Path Forward
 Office of the Oklahoma Secretary of Energy The Oklahoma First Energy Plan: A Pragmatic Path Forward C. Michael Ming Secretary of Energy State of Oklahoma Southern States Energy Board Washington, DC February
Crop Progress. Corn Silking Selected States [These 18 States planted 92% of the 2017 corn acreage]
![Crop Progress. Corn Silking Selected States [These 18 States planted 92% of the 2017 corn acreage]](/thumbs/81/83000292.jpg "Crop Progress. Corn Silking Selected States [These 18 States planted 92% of the 2017 corn acreage]") Crop Progress ISSN: 00 Released July, 0, by the National Agricultural Statistics Service (NASS), Agricultural Statistics Board, United s Department of Agriculture (USDA). Corn Silking Selected s [These
Crop Progress ISSN: 00 Released July, 0, by the National Agricultural Statistics Service (NASS), Agricultural Statistics Board, United s Department of Agriculture (USDA). Corn Silking Selected s [These
Crop Progress. Corn Dented Selected States [These 18 States planted 92% of the 2017 corn acreage] Corn Mature Selected States ISSN:
![Crop Progress. Corn Dented Selected States [These 18 States planted 92% of the 2017 corn acreage] Corn Mature Selected States ISSN:](/thumbs/85/92551331.jpg "Crop Progress. Corn Dented Selected States [These 18 States planted 92% of the 2017 corn acreage] Corn Mature Selected States ISSN:") Crop Progress ISSN: 00 Released September, 0, by the National Agricultural Statistics Service (NASS), Agricultural Statistics Board, United s Department of Agriculture (USDA). Corn Dented Selected s [These
Crop Progress ISSN: 00 Released September, 0, by the National Agricultural Statistics Service (NASS), Agricultural Statistics Board, United s Department of Agriculture (USDA). Corn Dented Selected s [These
Crop Progress. Corn Mature Selected States [These 18 States planted 93% of the 2015 corn acreage]
![Crop Progress. Corn Mature Selected States [These 18 States planted 93% of the 2015 corn acreage]](/thumbs/95/123882085.jpg "Crop Progress. Corn Mature Selected States [These 18 States planted 93% of the 2015 corn acreage]") Crop Progress ISSN: 0 Released October,, by the National Agricultural Statistics Service (NASS), Agricultural Statistics Board, United s Department of Agriculture (USDA). Corn Mature Selected s [These
Crop Progress ISSN: 0 Released October,, by the National Agricultural Statistics Service (NASS), Agricultural Statistics Board, United s Department of Agriculture (USDA). Corn Mature Selected s [These
Welcome to Annie's Project
 Welcome to Annie's Project Please help us to better prepare and continue to improve course by completing brief Pre-course Survey. Use the navigator buttons at the bottom of the page to move between pages.
Crop Progress. Cotton Bolls Opening Selected States [These 15 States planted 99% of the 2010 cotton acreage]
![Crop Progress. Cotton Bolls Opening Selected States [These 15 States planted 99% of the 2010 cotton acreage]](/thumbs/90/104141847.jpg "Crop Progress. Cotton Bolls Opening Selected States [These 15 States planted 99% of the 2010 cotton acreage]") Crop Progress ISSN: 00 Released September, 0, by the National Agricultural Statistics Service (NASS), Agricultural Statistics Board, United s Department of Agriculture (USDA). Cotton Bolls Opening Selected
Crop Progress ISSN: 00 Released September, 0, by the National Agricultural Statistics Service (NASS), Agricultural Statistics Board, United s Department of Agriculture (USDA). Cotton Bolls Opening Selected
Meat Animals Production, Disposition, and Income 2011 Summary
 United States Department of Agriculture National Agricultural Statistics Service Meat Animals Production, Disposition, and Income 2011 Summary April 2012 ISSN: 0748-0318 Special Note Sheep: Monthly sheep
Comparison of CAIR and CAIR Plus Proposal using the Integrated Planning Model (IPM ) Mid-Atlantic Regional Air Management Association (MARAMA)
 Mid-Atlantic Regional Air Management Association (MARAMA)") Draft Report Comparison of CAIR and CAIR Plus Proposal using the Integrated Planning Model (IPM ) Prepared for Mid-Atlantic Regional Air Management Association (MARAMA) Prepared by ICF Resources, L.L.C.
Draft Report Comparison of CAIR and CAIR Plus Proposal using the Integrated Planning Model (IPM ) Prepared for Mid-Atlantic Regional Air Management Association (MARAMA) Prepared by ICF Resources, L.L.C.
Meat Animals Production, Disposition, and Income 2015 Summary
 United States Department of Agriculture National Agricultural Statistics Service Meat Animals Production, Disposition, and Income 2015 Summary ISSN: 0748-0318 April 2016 Contents Summary... 5 Meat Animals
U.S. Drought Monitor, October 2, 2012
 University of Nebraska - Lincoln DigitalCommons@University of Nebraska - Lincoln US Ag in Drought Archive Drought -- National Drought Mitigation Center -2-12 U.S. Drought Monitor, October 2, 12 Anthony
Facts on Direct-to-Consumer Food Marketing
 United States Department of Agriculture Agricultural Marketing Service May 2009 Facts on Direct-to-Consumer Food Marketing Incorporating Data from the 2007 Census of Agriculture Written by: Adam Diamond
The American Clean Energy Security Act (ACES) Creates More American Jobs and Saves Americans Money
 Creates More American Jobs and Saves Americans Money") The American Clean Energy Security Act (ACES) Creates More American Jobs and Saves Americans Money State-by-state figures on job creation, electric bill reductions, and transportation savings from the
The American Clean Energy Security Act (ACES) Creates More American Jobs and Saves Americans Money State-by-state figures on job creation, electric bill reductions, and transportation savings from the
HOW BIG IS AFRICA? Rules. recommended grades: 3-6
 AFRICA HOW BIG IS AFRICA? recommended grades: 3-6 time needed: 25 MINUTES Description Students develop a sense of scale by using their bodies and other tools to measure the length and width of Africa.
Benchmarking Standards, Model Codes, Codes and Voluntary Guidelines on the HERS Index
 Benchmarking Standards, Model Codes, Codes and Voluntary Guidelines on the HERS Index Importance of Benchmarking Quantifying energy efficiency programs and codes helps: Consumers understand the performance
State Pesticide Regulatory Agencies Appendix 6.1
 State Pesticide Regulatory Agencies Appendix 6.1 Appendix 6: State Pesticide Regulatory Agencies Updated: June 2003 from http://ace.orst.edu/info/npic/state1.htm Compiled by: Julia McGonigle (TNC-Oregon
Milk Production, Disposition, and Income 2014 Summary
 United s Department of Agriculture National Agricultural Statistics Service Milk Production, Disposition, and Income 04 Summary ISSN: 949-506 April 05 Contents Summary... 4 Milk Cows and Production of
Pollution Control Exemptions for Pipelines
 Pollution Control Exemptions for Pipelines Greg Wood Ryan, LLC Atlanta, Georgia 30303 Greg.Wood@Ryan.com (919) 219-5605 Keith Fuqua Colonial Pipeline Company Alpharetta, Georgia 30009 kfuqua@colpipe.com
Case Study: market growth strategy. - Selection of slides
 Case Study: market growth strategy - Selection of slides 1 Objective of the collaboration Situation: The Client, global AC player, would like to enhance its positioning in the USA In this sense, the overall
U.S. Drought Monitor, August 7, 2012
 University of Nebraska - Lincoln DigitalCommons@University of Nebraska - Lincoln US Ag in Drought Archive Drought -- National Drought Mitigation Center -- U.S. Drought Monitor, August, Mark D. Svoboda
Farm Labor Housing (FLH)
") Farm Labor Housing (FLH) FARM LABOR HOUSING LOANS AND GRANTS CHAPTER 12: HB-1-3560 Appendix 1 This chapter describes the loan and grant origination process for Farm Labor Housing projects. While the origination
Farm Labor Housing (FLH) FARM LABOR HOUSING LOANS AND GRANTS CHAPTER 12: HB-1-3560 Appendix 1 This chapter describes the loan and grant origination process for Farm Labor Housing projects. While the origination
STICK SHIFT. Autonomous Vehicles, Driving Jobs, and the Future of Work
 Autonomous Vehicles, Driving Jobs, and the Future of Work ACKNOWLEDGEMENTS The Center for Global Policy Solutions would like to thank the following researchers for their help in developing this report:
Accelerating Energy Efficiency in Texas
 Accelerating Energy Efficiency in Texas Southwest Partnership for Energy Efficiency As a Resource Houston, Texas August 5, 2014 Jim Lazar RAP Senior Advisor The Regulatory Assistance Project 50 State Street,
U.S. Drought Monitor, August 14, 2012
 University of Nebraska - Lincoln DigitalCommons@University of Nebraska - Lincoln US Ag in Drought Archive Drought -- National Drought Mitigation Center 8-4-2 U.S. Drought Monitor, August 4, 2 Michael J.
Milk Production, Disposition, and Income 2011 Summary
 United s Department of Agriculture National Agricultural Statistics Service Production, Disposition, and Income 2011 Summary April 2012 ISSN: 19491506 Contents Summary... 4 Cows and Production of and
Predict. Prevent. Protect. Transform.
 Optum solution uses global positioning system technology for Optum (CES) is an open-architecture claims editing tool that Program Integrity Solutions Optum provides 30 years worth of government expertise
ENERGY STAR Oil Furnaces Product List
 ENERGY STAR Oil Furnaces Product List Below are currently qualified ENERGY STAR models available for sale in the U.S. and Canada * Air Leakage data was not collected under the Version 3.0 ENERGY STAR Program
U.S. Wind Industry Fourth Quarter 2014 U.S. Wind Industry First Quarter 2016 Market Report Market Report
 American Wind Energy Association American Wind Energy Association U.S. Wind Industry Fourth Quarter 2014 U.S. Wind Industry First Quarter 2016 Market Report Market Report A product of AWEA Data Services
Land Values 2013 Summary
 United States Department of Agriculture National Agricultural Statistics Service Land Values 2013 Summary August 2013 ISSN: 19491867 Contents Agricultural Land Values Highlights... 4 Farm Real Estate,
Prepared for Greenpeace. September 25, 2009
 An Evaluation of Potential Demand for Renewable Generation H.R. 2454 (Waxman-Markey) Renewable Electricity Standard vs. Existing State Renewable Portfolio Standards Prepared for Greenpeace September 25,
State Stat. Surveys Merc. Emissions Page 1 Merc. Emissions 50 STATE STATUTORY SURVEYS ENVIRONMENTAL LAWS POLLUTION. Copr 2008 Thomson Reuters/West
 State Stat. Surveys Page 1 50 STATE STATUTORY SURVEYS ENVIRONMENTAL LAWS POLLUTION Copr 2008 Thomson Reuters/West Thomson West September 2007 Mercury Emission Limits The release of mercury as a pollutant
American Wind Energy Association. U.S. Wind Industry Third Quarter 2014 Market Report
 American Wind Energy Association U.S. Wind Industry Third Quarter 2014 Market Report A product of AWEA Data Services Released October 20, 2014 The American wind energy industry installed 1,254 megawatts
Knowledge Exchange Report. Economic Impact of Mandatory Overtime on New York State Agriculture
 Farm Credit East Knowledge Exchange Report September, 2014 Economic Impact of Mandatory Overtime on New York State Agriculture The New York State Legislature and Governor Andrew Cuomo are considering legislation
U.S. HRW Wheat Crop Update
 U.S. HRW Wheat Crop Update IAOM Central and Wheat State District Meeting Mark Hodges Plains Grains, Inc. Stillwater, Oklahoma hodgesm1@cox.net Overview US wheat crop review Planted/Harvested 2018 Hard
Cattle. January 1 Cattle Inventory Up 3 Percent
 Cattle ISSN: 1948-90 Released January 29, 2016, by the National Agricultural Statistics Service (NASS), Agricultural Statistics Board, United States Department of Agriculture (USDA). January 1 Cattle Inventory
American Wind Energy Association U.S. Wind Industry Second Quarter U.S. Wind Industry Fourth Quarter Market Report Market Report
 American Wind Energy Association American Wind Energy Association U.S. Wind Industry Second Quarter U.S. Wind Industry Fourth Quarter 2014 2016 Market Report Market Report A product of AWEA Data Services
Farm Labor. Hired Workers Unchanged, Wage Rates Up 4 Percent From a Year Ago
 Washington, D.C. Farm Labor Released May 8, 007, by the National Agricultural Statistics Service (NASS),, U.S. Department of Agriculture. For information on call Mark Aitken at 0-70-66, office hours 7:0
Invasive Species There is an App and a Map for That
 Invasive Species There is an App and a Map for That Who am I? Information Technology Director Public Service Assistant in Entomology B.S. and M.S. in Computer Science President - National Exotic Pest Plant
Asphalt Pavement Mix Production Survey On Reclaimed Asphalt Pavement, Reclaimed Asphalt Shingles, And Warm-mix Asphalt Usage:
 Asphalt Pavement Mix Production Survey On Reclaimed Asphalt Pavement, Reclaimed Asphalt Shingles, And Warm-mix Asphalt Usage: 2009-2010 Appendix A Purpose The National Asphalt Pavement Association is working
Crop Production ISSN:
 Crop Production ISSN: 1936-3737 Released August 12, 2014, by the National Agricultural Statistics Service (NASS), Agricultural Statistics Board, United States Department of Agriculture (USDA). Corn Production
CALCULATING THE SUPPLEMENTAL NUTRITION ASSISTANCE PROGRAM (SNAP) PROGRAM ACCESS INDEX: A STEP-BY-STEP GUIDE FOR 2013
 PROGRAM ACCESS INDEX: A STEP-BY-STEP GUIDE FOR 2013") Food and Nutrition Service January 2015 CALCULATING THE SUPPLEMENTAL NUTRITION ASSISTANCE PROGRAM (SNAP) PROGRAM ACCESS INDEX: A STEP-BY-STEP GUIDE FOR 2013 Introduction The Program Access Index (PAI)
Food and Nutrition Service January 2015 CALCULATING THE SUPPLEMENTAL NUTRITION ASSISTANCE PROGRAM (SNAP) PROGRAM ACCESS INDEX: A STEP-BY-STEP GUIDE FOR 2013 Introduction The Program Access Index (PAI)
Definitive Guide to State Regulation of the Pharmaceutical Supply Chain
 Helping the pharmaceutical industry navigate with confidence. Definitive Guide to State Regulation of the Pharmaceutical Supply Chain A comprehensive strategy guide to help your company achieve State-level
International Ag issues Trends in the Local Food Market Presentation For The NSAC Far West Chapter Annual Meeting May 23, 2013
 International Ag issues Trends in the Local Food Market Presentation For The NSAC Far West Chapter Annual Meeting May 23, 2013 William Matthews University of California Agricultural Issues Center UC Agricultural
Production per cow in the 23 major States averaged 1,891 pounds for January, 17 pounds above January 2013.
 Milk Production ISSN: 19-1557 Released February 20, 2014, by the National Agricultural Statistics Service (NASS), Agricultural Statistics Board, United States Department of Agriculture (USDA). January
Milk Production. January Milk Production up 2.7 Percent
 Milk Production ISSN: 9-557 Released February, 07, by the National Agricultural Statistics Service (NASS), Agricultural Statistics Board, United States Department of Agriculture (USDA). January Milk Production
Land Values and Cash Rents 2010 Summary
 United States Department of Agriculture National Agricultural Statistics Service Land Values and Cash Rents 2010 Summary August 2010 ISSN: 19491867 Contents Agricultural Land Values Highlights... 4 United
Farm Labor. Hired Workers Up 3 Percent, Wage Rates Up 4 Percent From a Year Ago
 Washington, D.C. Farm Labor Released November 16,, by the National Agricultural Statistics Service (NASS),, U.S. Department of Agriculture. For information on call Mark Aitken at 202-720-6146, office hours
Winter Wheat Seedings
 Washington, D.C. Winter Wheat Seedings Released January 12,, by the National Agricultural Statistics Service (NASS),, U.S. Department of Agriculture. For information on Winter Wheat Seedings call Todd
FUNDING SYSTEM RE-DESIGN FOR EMPLOYMENT AND DAY SERVICES. Where Are We Now and How Will We Move Forward?
 FUNDING SYSTEM RE-DESIGN FOR EMPLOYMENT AND DAY SERVICES Where Are We Now and How Will We Move Forward? 1 Individuals Served Per 100K in Population VT NY IA SD RI OH OR DC MN Individuals Served in Day
Angela A. Savino
 Angela A. Savino 614-431-1500 Customer Choice Delivery Options Same day/ 2 hour Delivery Options Mobile Tracking Crowdsourcing (e.g. Uber-like deliveries) Angela A. Savino 614-431-1500 Angela A. Savino
CALCULATING THE SUPPLEMENTAL NUTRITION ASSISTANCE PROGRAM (SNAP) PROGRAM ACCESS INDEX: A STEP-BY-STEP GUIDE FOR 2015
 PROGRAM ACCESS INDEX: A STEP-BY-STEP GUIDE FOR 2015") Food and Nutrition Service January 2017 CALCULATING THE SUPPLEMENTAL NUTRITION ASSISTANCE PROGRAM (SNAP) PROGRAM ACCESS INDEX: A STEP-BY-STEP GUIDE FOR 2015 Introduction The Program Access Index (PAI)
Food and Nutrition Service January 2017 CALCULATING THE SUPPLEMENTAL NUTRITION ASSISTANCE PROGRAM (SNAP) PROGRAM ACCESS INDEX: A STEP-BY-STEP GUIDE FOR 2015 Introduction The Program Access Index (PAI)
Sales, Trade Flows and Marketing Practices within the U.S. Nursery Industry 1
 Sales, Trade Flows and Marketing Practices within the U.S. Nursery Industry 1 Charles R. Hall 2, Alan W. Hodges 3, and Marco A. Palma 4 Department of Horticultural Sciences, Texas A&M University 2133 TAMU,
All cows and heifers that have calved, at 39.1 million, were down 2 percent from the 40.0 million on January 1, 2011.
 Cattle ISSN: 1948-90 Released January 27, 2012, by the National Agricultural Statistics Service (NASS), Agricultural Statistics Board, United States Department of Agriculture (USDA). January 1 Cattle Inventory
Steers weighing 500 pounds and over, as of January 1, 2018, totaled 16.4 million head, down slightly from January 1, 2017.
 Cattle ISSN: 1948-90 Released January 31, 2018, by the National Agricultural Statistics Service (NASS), Agricultural Statistics Board, United States Department of Agriculture (USDA). January 1 Cattle Inventory
Government Spending and Air Pollution in the US
 Government Spending and Air Pollution in the US ONLINE APPENDIX Asif M. Islam* University of Maryland 2106 Symons Hall College Park, MD 20740 (651) 246 4017 aislam@arec.umd.edu Ramón E. López University
SUBJECT: Request for Input from Livestock Producer Groups
 United States Department of Agriculture Farm and Foreign Agricultural Services Risk Management Agency May 14, 2001 INFORMATIONAL MEMORANDUM: R&D-01-023 TO: FROM: Livestock Producer Groups All Risk Management
Labor Market Outlook. Labor Market Outlook Survey Q (October December) Published by the Society for Human Resource Management
 Published by the Society for Human Resource Management") October December 2009 Labor Market Outlook Published by the Society for Human Resource Management Labor Market Outlook Survey Q4 2009 (October December) LABOR MARKET OUTLOOK SURVEY Q4 2009 (October December)
October December 2009 Labor Market Outlook Published by the Society for Human Resource Management Labor Market Outlook Survey Q4 2009 (October December) LABOR MARKET OUTLOOK SURVEY Q4 2009 (October December)
Honey. United States Honey Production Down 1 Percent
 Honey ISSN: 199-192 Released March 18, 2013, by the National Agricultural Statistics Service (NASS), Agricultural Statistics Board, United States Department of Agriculture (USDA). United States Honey Production
American Wind Energy Association. U.S. Wind Industry Second Fourth Quarter Market Report
 American Wind Energy Association U.S. Wind Industry Second Fourth Quarter 2014 2015 Market Report A product of AWEA Data Services Released January July 22, 28, 2015 The American wind energy industry installed
MOONS COLLECTION. Laptop Stands
 Moons Pricebook MOONS COLLECTION Laptop Stands Top - High Pressure Laminate; High Density Particle Board Core Base - Painted or Chrome Steel Non Height Adjustable Glide Ships Assembled moon-01p moon-01p
Land Values 2012 Summary
 United States Department of Agriculture National Agricultural Statistics Service Land Values 2012 Summary August 2012 ISSN: 19491867 Contents Agricultural Land Values Highlights... 4 Farm Real Estate,
AMERICAN FORESTRY CONGRESS
 PROCEEDINGS OF THE AMERICAN FORESTRY CONGRESS AT ITS MEETING HELD IN BOSTON, SEPTEMBER 1885 WASHINGTON DC JUDD & DETWILLER, PRINTERS FACTS AND FIGURES IN RESPECT TO THE FORESTS OF THE COUNTRY AND THEIR
Land Values and Cash Rents
 United States Department of Agriculture National Agricultural Statistics Service Land Values and Cash Rents 2009 Summary August 2009 ISSN: 19491867 Contents Agricultural Land Values Highlights... 4 U.
Farm Labor. Special Note
 Washington, D.C. Farm Labor Released August 21,, by the National Agricultural Statistics Service (NASS),, U.S. Department of Agriculture. For information on call Mark Aitken at 202-720-6146, office hours
±450 Acre Premiere Business Park
 ±450 Acre Premiere Business Park Property Highlights Flexible lot sizes from 12-100 + acres. Lots are unplatted so different variations of each lot may be revised. Home to Musician s Friend, FedEx Ground,
Honey Final Estimates
 United States Department of Agriculture National Agricultural Statistics Service Honey Final Estimates 200-2012 September 201 Statistical Bulletin Number 3 Contents Honey Price by Color Class United States:
All cows and heifers that have calved, at 40.0 million, were down 1 percent from the 40.5 million on January 1, 2010.
 Cattle ISSN: 18- Released January 28, 2011, by the National Agricultural Statistics Service (NASS), Agricultural Statistics Board, United States Department of Agriculture (USDA). January 1 Cattle Inventory
REGIONAL ENERGY BASELINES AND MEASUREMENT AND VERIFICATION PROTOCOLS
 Total Energy Use per Capita (1 6 Btu) ESL-TR-9-2-1 REGIONAL ENERGY BASELINES AND MEASUREMENT AND VERIFICATION PROTOCOLS Subtask 3.1 for the Southern Energy Efficiency Center Cooperative Agreement #: DE-PS26-7NT43185
Farm Computer Usage and Ownership
 Washington, D.C. Farm Computer Usage and Ownership Released July, 0, by the National Agricultural Statistics Service (NASS),, U.S. Department of Agriculture. For information on "" call Mark Aitken at ()
Honey. United States Honey Production Down 16 Percent
 Honey ISSN: 1-12 Released March 30, 2012, by the National Agricultural Statistics Service (NASS), Agricultural Statistics Board, United States Department of Agriculture (USDA). United States Honey Production
https://aba2.issi.net/team/admin/wizard/survey/loadinstance.asp?formid=208&instanc...
 https://aba2.issi.net/team/admin/wizard/survey/loadinstance.asp?formid=208&instanc... Page 1 of 1 Print Last edited by Vicki Osman on Mar 28 2016 8:54AM Marketplace 2017 Associate Profile Page 1/1 Please
U.S. Political Activity & Public Policy Report 2013
 U.S. Political Activity & Public Policy Report 2013 Best Buy Co., Inc. 2013 Best Buy engages in the political process by developing and advocating public policy positions that directly impact our employees,
Organic Certification Cost Share Program Guidebook
 Organic Certification Cost Share Program Guidebook By Joanna Ory, Ph.D. & Diana Jerkins, Ph.D. Overview The National Organic Certification Cost Share Program (OCCSP) offers annual financial support to
Do you have staff reviewing formation filings for name availability purposes or is this done electronically?
 Topic: Developing an Online Filing System Question by: Allison Clark Jurisdiction: Ohio Date: 2 February 2011 Jurisdiction Question(s) Manitoba Corporations Canada Alabama Alaska Arizona Arkansas California
Trends in. U.S. Delivered Coal Costs: July 2012
 Trends in U.S. Delivered Coal Costs: 2004-2011 July 2012 By Teresa Foster, William Briggs and Leslie Glustrom Version 1.1 Inquiries or corrections to info@cleanenergyaction.org 1 2 Table of Contents INTRODUCTION...
Farms and Land in Farms
 United States Department of Agriculture National Agricultural Statistics Service Farms and Land in Farms 2017 Summary February 2018 ISSN: 1995-2004 2 Farms and Land in Farms 2017 Summary (February 2018)
The next big reliability challenge: EPA revised ozone standard
 The next big reliability challenge: EPA revised ozone standard Eugene M. Trisko Attorney-at-Law SSEB Clean Coal Technology Committee Kingsport, TN May 19, 2015 Background EPA is proposing to lower the
NEMSIS TAC Update NASEMSO Mid-Year Meeting
 NEMSIS TAC Update NASEMSO Mid-Year Meeting March 6, 2013 Data Manager s Council NEMSIS TAC Objectives Objectives Update on Data Submissions V2.2.1 New State Dashboard State Dashboard: Surveillance, Performance
The Denver Water System
 The Denver Water System Established in 1918 Unique structure Serves 1.3 million people 25% of Colorado s population System footprint - 4,000 square miles (2.5 million acres) 19 raw water reservoirs Critical
WAYFAIR IMPLEMENTATION AND MARKETPLACE FACILITATORS
 WAYFAIR IMPLEMENTATION AND MARKETPLACE FACILITATORS Richard Cram National Nexus Program Director NCSL SALT Task Force Meeting Scottsdale, Arizona November 16, 2018 WAYFAIR MENTIONED FAVORABLY SOUTH DAKOTA