2015 SAN/Rainforest Alliance Impacts Report
|
|
|
- Shona Ellis
- 6 years ago
- Views:
Transcription

1 215 SAN/Rainforest Alliance Impacts Report Evaluating the Effects of the SAN/Rainforest Alliance Certification System on Farms, People, and the Environment
2
3 215 SAN/Rainforest Alliance Impacts Report Evaluating the Effects of the SAN/ Rainforest Alliance Certification System on Farms, People, and the Environment Jeffrey C. Milder and Deanna Newsom December 215 Copyright 215 by: Rainforest Alliance 233 Broadway, 28 th Floor New York, NY 1279, USA Sustainable Agriculture Network Paseo de la Reforma No. 265 PH1 Col. Cuahtemoc, c.p. 65 México D.F., México About the Sustainable Agriculture Network (SAN) The Sustainable Agriculture Network (SAN) is a coalition of nonprofit conservation organizations promoting the environmental and social sustainability of agricultural activities through the development of standards for best practices, certification and training for rural farmers around the world. About the Rainforest Alliance The Rainforest Alliance is an international nonprofit organization that works to conserve biodiversity and ensure sustainable livelihoods by transforming land-use practices, business practices and consumer behavior. The organization s approach includes training and certification to promote healthy ecosystems and communities in some of the world s most vulnerable geographies. SAN/Rainforest Alliance Impacts Report 3


 Adoption of Sustainability Practices on Certified Cocoa Farms The CAEZA Cocoa")
 Adoption of Sustainability Practices on Certified Tea Farms Key Outcomes and Broader Impacts Farmer Spotlight: Certified Tea in Kenya 58 61 63")
4 Table of Contents Foreword 7 Executive Summary Our Work Our Impacts An Introduction to the SAN/ Rainforest Alliance System 14 Theory of Change The SAN/Rainforest Alliance Theory of Change The SAN Standard Revisions to the SAN Standard The SAN/Rainforest Alliance Monitoring and Evaluation System Overview of the Monitoring and Evaluation System Our Global Reach 26 Latin America Africa Asia Where and With Whom We Work Rainforest Alliance Certified Crops Smallholders in the SAN/Rainforest Alliance Certification System Crop Spotlight: Coffee 36 Direct Results (Farm Practices and Management Systems) Adoption of Sustainability Practices on Certified Coffee Farms Key Outcomes and Broader Impacts Farmer Spotlight: Certified Coffee in Guatemala Crop Spotlight: Cocoa 46 Direct Results (Farm Practices and Management Systems) Adoption of Sustainability Practices on Certified Cocoa Farms The CAEZA Cocoa Cooperative in Côte d Ivoire Key Outcomes and Broader Impacts SAN Member Profile: CEFCA Crop Spotlight: Tea 56 Direct Results (Farm Practices and Management Systems) Adoption of Sustainability Practices on Certified Tea Farms Key Outcomes and Broader Impacts Farmer Spotlight: Certified Tea in Kenya Table of Contents


5 Table of Contents Crop Spotlight: Bananas 66 Direct Results (Farm Practices and Management Systems) Adoption of Sustainability Practices on Certified Banana Farms Key Outcomes and Broader Impacts Farmer Spotlight: Certified Bananas in Costa Rica Issue Spotlight: Livelihoods 74 Wages and Rights of Farm Workers Health and Education Farm Productivity Price Premiums Issue Spotlight: Water 8 Water Stewardship Index Water-Related Results in Published Studies Encouraging Water-Friendly Coffee Farming and Processing in Rwanda Issue Spotlight: Biodiversity Conservation 88 Biodiversity Stewardship Index Biodiversity-Related results in Published Studies Farmers Make the Case for Restoring Natural Ecosystems Issue Spotlight: Climate-Smart Agriculture 94 Climate-Smart Agriculture Index Climate-Smart Agriculture in Practice Farm Profile: Hondupalma Cooperative in Honduras Conclusion: Looking Forward 1 Annexes Annex A: Global Reach, by Country Annex B: SAN Standard Conformance Data, by Crop and Region Annex C: Methodology Methodology for Data Collection, Synthesis, & Reporting Monitoring and Evaluation Indicators Annex D: Bibliography Acknowledgments 122 SAN/Rainforest Alliance Impacts Report 5


6


7 Foreword In 1992, two banana farms first attained Rainforest Alliance certification, heralding the start of a brave experiment in linking producers, consumers and private companies to drive a transition to sustainable agriculture. By the mid-2s, our certification program had grown into a solid niche for bananas, coffee and several other crops. The past five years, however, have been our most exciting chapter yet, witnessing rapid growth in the marketplace and deep engagement with hundreds of thousands of producers across the tropics and sub-tropics through field training and support. With this report our first-ever system-wide synthesis of impacts we pause to evaluate the effects of Sustainable Agriculture Network (SAN)/Rainforest Alliance certification relative to the goals we share with our participating producers, companies and partners. These goals include conserving biodiversity, safeguarding natural resources, increasing farm productivity and profitability and improving the lives of farmers, workers and their families. The results shared here provide strong evidence that SAN/Rainforest Alliance certification is driving social and environmental sustainability on farms and in rural communities, landscapes and watersheds. In our own data, we see that certified producers are progressively adopting more sustainable practices related to soil health, fertilizer use, water management, waste management, and workers rights and well-being. And from independent research we learn that these practices, in turn, are contributing to more productive farms, higher incomes, better-educated children, cleaner streams, more native flora and fauna, and a host of other benefits. Ana Paula Tavares Interim President Rainforest Alliance As exciting as it is to see the benefits of the SAN/Rainforest Alliance certification program corroborated by solid evidence, for us this report has an additional and even greater purpose: it helps us pinpoint areas for improvement and understand how we can work with our producers and partners to be even more effective in the future. Evaluation and learning is a continuous process for the SAN and the Rainforest Alliance, and it guides us in the ongoing development of our field programs and in the periodic revision of our standard the next version of which is due soon. We continue to see certification not as an end in itself, but as a catalyst for bringing about a world in which sustainable agriculture is the norm. Please join us in making this vision a reality. Andre Defreitas Executive Director Sustainable Agriculture Network SAN/Rainforest Alliance Impacts Report 7


8 Executive Summary 8 Executive Summary

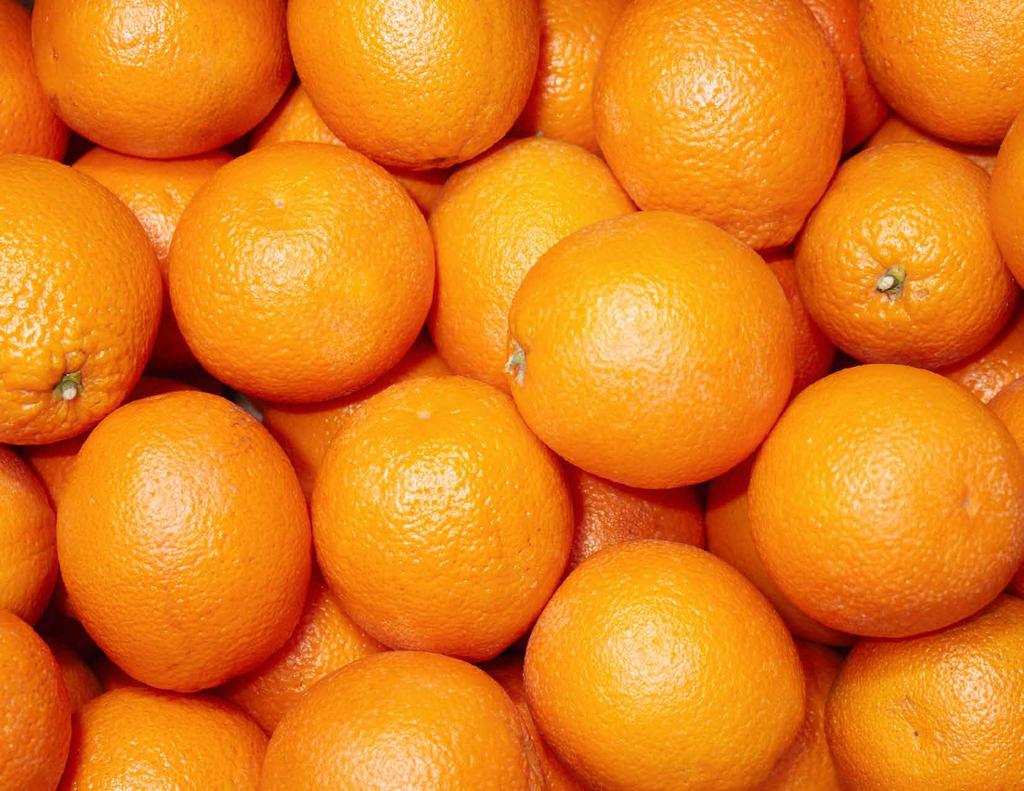
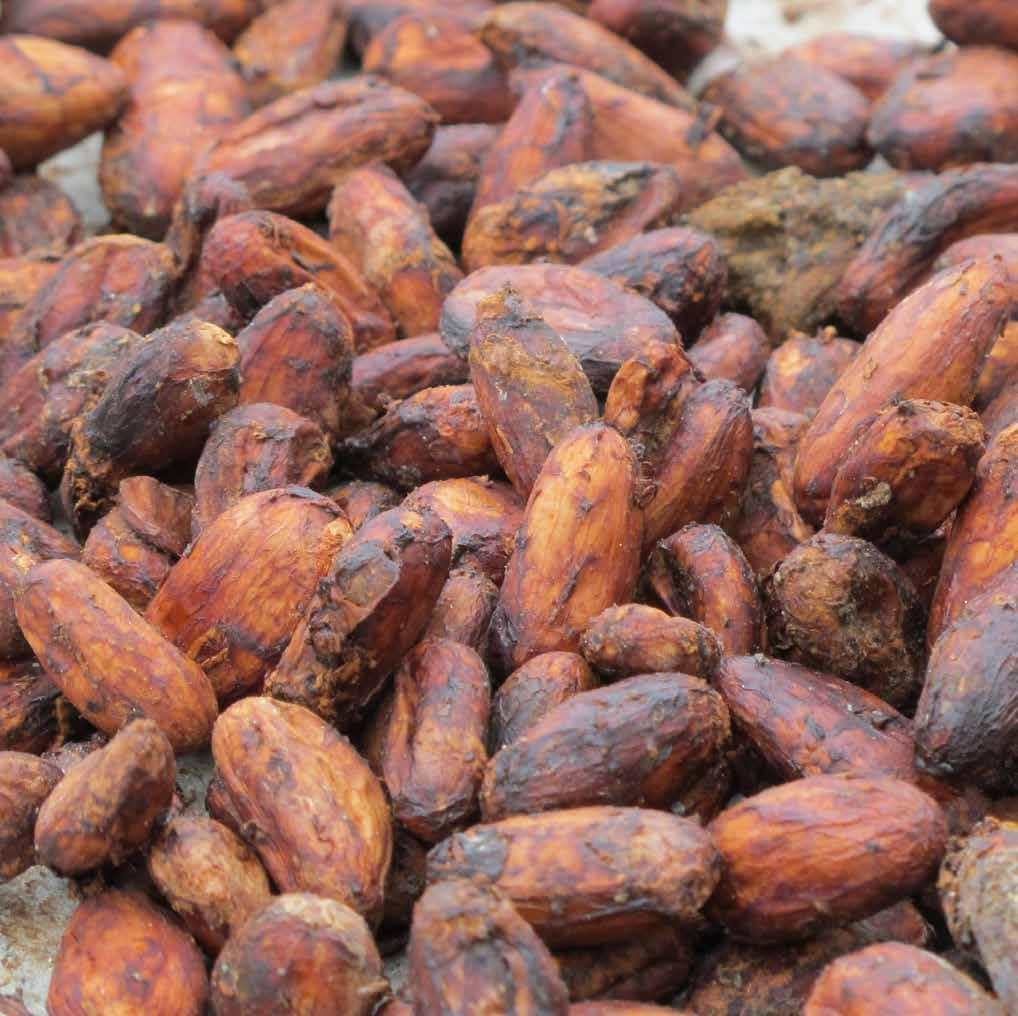
9 Executive Summary The coffee beans and tea leaves, bananas and mangos, chocolate and orange juice that brighten the breakfast tables of people around the world all too often begin their journey in a place that is not so cheery. Throughout the tropics and subtropics, agriculture is a major contributor to forest destruction, water pollution, labor abuses, entrenched poverty and child labor. But it does not have to be this way. Agriculture can be productive and profitable for farmers and workers, an important engine of economic and community development, and an integral part of sustainable and resilient rural landscapes. The Sustainable Agriculture Network (SAN) and the Rainforest Alliance seek to transform agriculture into a sustainable activity that conserves biodiversity and supports sustainable livelihoods. The jointly-managed SAN/Rainforest Alliance certification system supports this change by defining a framework of good practices for sustainable agriculture (the SAN Standard), training and supporting producers to implement these good practices, and certifying (through independent audits) those producers who achieve this norm of sustainable performance. From 21 to 214, SAN/Rainforest Alliance certification expanded rapidly, and it now covers 1.2 million farms in 42 countries, growing 11 different crops on about 3.5 million hectares an area nearly the size of Switzerland. At the end of 214, production from Rainforest Alliance Certified farms that met the criteria of the SAN Standard accounted for 15.1 percent of the total world production for tea, 13.6 percent for cocoa and more than 5 percent each for coffee and bananas. The Rainforest Alliance Certified seal marks a sack of certified coffee. SAN/ Rainforest Alliance certification also covers an additional 1 other crops grown around the world. But has all this growth in the marketplace and on the ground yielded real benefits toward the ultimate aims of the SAN/Rainforest Alliance certification system conserving biodiversity, safeguarding natural resources, increasing farm productivity and profitability and improving the lives of farmers, workers and their families? While it is impossible to generalize across all certified operations, substantial evidence now indicates that these benefits are being achieved across a diversity of crops, countries and farm sizes. This evidence comes from multiple sources. Independent researchers have been visiting Rainforest Alliance Certified farms to determine whether practices are changing, and if so, what effects these changes have on farms, ecosystems and livelihoods. Rainforest Alliance staff have been analyzing information from farm audit reports in new ways to gain greater insights into field-level results. And farmers have been sharing their experiences, reflecting on what has changed or what has not since their farms became certified. This first-ever SAN/Rainforest Alliance Impacts Report distills this diverse evidence base to present an overall portrait of the certification system s results from 21 to 214. After presenting a global snapshot of the scope and geographic distribution of certified farms, the report focuses on results related to our most widespread certified crops (coffee, cocoa, tea and bananas), followed by in-depth analyses of results related to livelihoods, water, biodiversity and climate change all key issues and challenges for farmers and rural communities. Along the way, the reader can find numerous case examples featuring the certified producers, SAN members and local partners who implement the SAN/ Rainforest Alliance certification system on the ground. The report reaches several key conclusions about the effects of SAN/Rainforest Alliance certification: Certified farms apply more sustainable farm practices than non-certified farms. Across several crops and countries, certified farmers were found to implement sustainable practices at a higher rate than non-certified farmers. More than ten studies using multiple credible methods have showed that SAN/Rainforest Alliance Impacts Report 9

10 Finca El Platanillo, a coffee farm in southwestern Guatemala, has been Rainforest Alliance Certified since 25. The farm was the first to fully implement a climate-friendly farming module developed by SAN. certified farms apply good practices related to environmental management, worker health and safety, and farm productivity significantly more often than non-certified farms. As farms remain in the system for two or more years, their sustainability practices tend to improve over time. Time series data for producers remaining in the certification program indicate that, in the period from , a high proportion of initial non-conformities to the SAN Standard (less sustainable practices) were resolved through the adoption of more sustainable practices. Additionally, during this period, overall levels of conformance with SAN criteria increased substantially, from 9 percent to 94 percent for bananas in Central America, from 83 percent to 88 percent for coffee in Central America, from 85 percent to 88 percent for cocoa in West Africa, and from 87 percent to 93 percent for tea in East Africa. These time-series results from 219 Rainforest Alliance Certified operations suggest that as producers stay in the system longer, they are able to resolve many weaknesses initially flagged by auditors and continually improve their performance. A minority of sustainability topics remain persistent challenges in certain crops and locations. Despite the overall trend toward improvement over time, some sustainability topics and corresponding SAN criteria registered little progress (or even an increase in non-conformances) while others registered progress but continued to have a meaningful proportion of non-conformant producers. These topics included agrochemical management in coffee and cocoa, riparian zone protection in cocoa and bananas, worker housing in coffee and tea, waste management in bananas, shade cover in cocoa, and wastewater monitoring in cocoa, coffee and tea. The reasons for 1 Executive Summary

11 these results differ by crop and context and highlight the need for additional training and support, industry investment, and, in some cases, modifications to the SAN Standard. Certification benefits small-scale producers though not always in the ways they expect. There is little evidence of large certification price premiums accruing to Rainforest Alliance Certified farms. But the findings in this report cast doubt on the conventional wisdom that without price premiums to compensate for costs of certification, farmers will lose interest. This is because smallholder farmers applying the agronomic practices outlined in the SAN Standard are found to increase productivity and profitability in most instances where these outcomes have been evaluated. These gains, together with other benefits such as increased access to training and improved environmental quality and health, are cited by farmers as important sources of value and reasons to stay certified. Certified farms contribute to protecting local water resources. At least seven published studies have documented positive effects of SAN/Rainforest Alliance certification in protecting water quality on and around certified farms. These results were mostly in the areas of improved erosion control, reduced agrochemical use and more effective wastewater treatment. Certification contributes to healthier natural ecosystems, not just on the farm but in the surrounding landscape. Multiple studies have documented increases in tree cover and wildlife protection on certified farms, relative to non-certified farms or relative to pre-certification conditions. Furthermore, the shade trees, natural ecosystem patches and riparian corridors on certified farms can contribute to conservation in the broader landscape, as found by independent studies in Brazil, Colombia and Ethiopia. At least as interesting as these individual results is the picture that emerges when viewing them together. It is a picture that presents numerous win-win opportunities on tropical and subtropical farms: that is, opportunities to simultaneously increase productivity, improve livelihoods and conserve nature through better ways of managing soils, water, fertilizer, pesticides, tree cover, and waste, and more equitable ways of treating workers. The SAN Standard codifies a set of practices hypothesized to deliver such win-win gains, and the evidence reviewed here indicates that these practices are generally delivering the intended results. Ivan Vega displays part of the wastewater treatment system on his certified coffee farm in Colombia. While the evaluation results are largely positive, this impact report is also useful for identifying important areas for improvement, such as those noted above. With this information in mind, SAN members and their partners can more effectively target future investments in training and farmer support. Finally, while this report reviews more than 2 research studies as well as conformance and practice adoption data from more than 54 audit reports, further study is still needed, especially in the following areas: to investigate other (yet unstudied) outcomes of certification to furnish evidence for additional locations, crops, and contexts to understand the changes that occur before producers apply for certification, during which time they are hypothesized to improve as they prepare to become certified to gain greater insight into the individual and combined effects of training, certification, and other SAN/Rainforest Alliance support strategies in contributing to Theory of Change outcomes; and to understand better the contextual conditions affecting the delivery of key outcomes We invite and encourage interested researchers to take up these important questions in the context of SAN/Rainforest Alliance certification to expand further the evidence base about where and how certification can best contribute to bringing about a world where sustainable agriculture is the norm. SAN/Rainforest Alliance Impacts Report 11

12 Our Work The Sustainable Agriculture Network (SAN) and Rainforest Alliance work with farmers around the world to make sustainable agriculture the norm while conserving biodiversity and ensuring sustainable livelihoods. Where we work Countries where certified products are: produced and sold sold produced Did you know? SAN/Rainforest Alliance s global reach spans ,2, countries different crops farms (76% of them < 2 ha in size) We engage the marketplace to build demand for sustainable food & beverage products enabling companies and consumers to make ethical purchasing decisions that benefit farmers around the world. Share of SAN/Rainforest Alliance Certified crops in total world production Tea 15.1% 8.9% Cocoa Coffee Banana 13.6% 2.4% 5.4% 3.2% 5.6% 2% At the field level, we drive continuous improvement toward sustainable agriculture through: Farmer training and support Delivered by the ten SAN member organizations and their partners around the world, and Implementation of the SAN Sustainable Agriculture Standard, addressing best practices in ten areas: Social and environmental management system Ecosystem conservation Wildlife protection Water conservation Fair treatment and good working conditions Occupational health and safety Community relations Integrated crop management Soil management and conservation Integrated waste management 12 Executive Summary


13 Our Impacts Farms become more sustainable over time, as producers progressively improve soil and water management, worker health and safety, agronomic practices, social conditions and livelihoods, and conservation-friendly farming. Improved practices: Average percentage of certified operations initial SAN Standard non-conformities (poor management practices) that were eliminated (replaced by best management practices) by the most recent audit, between 211 and 214. Tea farms in East Africa 83% Cocoa farms in West Africa 64% Coffee farms in Central America 57% Banana farms in Central America 82% Improved practices: SAN/Rainforest Alliance Certified farms adopted the following sustainable practices at significantly higher rates than nearby non-certified farms: maintained protective buffer zones around environmentally sensitive areas protected water bodies using fencing and reforestation used soil analysis to guide fertilizer application trained workers on first aid, recycling, and the safe application of agrochemicals Key outcomes and broader impacts: Scientific research has shown that SAN/Rainforest Alliance Certified farms generally outperform non-certified farms in the four key outcome areas identified in our Theory of Change: Biodiversity conservation Compared with non-certified farms, certified farms have: More on-farm trees, native tree species, and tree canopy layers (coffee farms in Colombia) A greater diversity of aquatic macroinvertebrates (coffee, Colombia) Higher rates of migratory bird survivorship (coffee, El Salvador) Reduced deforestation rates (coffee, Ethiopia) Farmer, worker, and family wellbeing Compared with non-certified farms, workers on certified farms: Have children with a median educational achievement that is two years higher (coffee, Colombia) Wear personal protective equipment at a higher rate (coffee, Colombia) Have better access to sick leave and maternity/paternity leave (tea, India) Natural resource conservation Compared with non-certified farms, certified farms have: Better soil health, indicated by more organic matter (cocoa, Ghana) Streambanks covered in more erosion-controlling vegetation (coffee, Colombia) Better water quality (coffee, Colombia) Farm productivity and profitability Compared with non-certified farms, certified farms have: Yields that are 1.5 to 2 times higher (cocoa, Ghana and Côte d Ivoire; coffee, Peru and Colombia) Higher product quality (tea, Kenya) Higher farmer income (cocoa, Côte d Ivoire; coffee, Peru) SAN/Rainforest Alliance Impacts Report 13


14 An Introduction to the SAN/ Rainforest Alliance System 14 An Introduction to the SAN/Rainforest Alliance System
15 This chapter provides context for the rest of the report by introducing the Sustainable Agriculture Network (SAN)/Rainforest Alliance certification system, including its mission-driven objectives and outcomes as well as the SAN Sustainable Agriculture Standard. We also introduce the SAN/Rainforest Alliance monitoring and evaluation (M&E) framework and the methodologies used to collect and analyze the information presented in this report. An Introduction to the SAN/ Rainforest Alliance System The SAN/Rainforest Alliance certification system is jointly owned and collaboratively managed by two non-governmental organizations: The Sustainable Agriculture Network is an international association of nonprofit organizations working in support of rural development and the conservation of biodiversity. The SAN is currently comprised of ten member organizations, seven of them based in lower- or middle-income tropical nations. The SAN initiated its activities in 1997, and was legally established with headquarters in Mexico in January 21. For more information, please visit The Rainforest Alliance is an international nonprofit organization dedicated to conserving biodiversity and improving livelihoods. Founded in 1987, the Rainforest Alliance is headquartered in New York and works in 89 countries throughout the Americas, Africa, Asia, Europe, and Oceania. The organization supports farmers, forest communities, and local businesses to conserve natural resources and pursue sustainable livelihoods, while collaborating with private business to promote sustainable production and consumption. For more information, please visit Management and implementation of the SAN/Rainforest Alliance certification system is distributed between the two organizations, together with a broader set of external partners. This arrangement ensures that the system has strong representation and participation, in both its design and its implementation, from the field level (i.e., farmers, cooperatives, and local partners) as well as from the international markets into which most certified products are sold. The Sustainable Agriculture Network is responsible for standard-setting; certification policies and processes; accreditation of certification bodies; and auditor training and oversight. The Rainforest Alliance manages the traceability system, claims and trademarks; monitoring and evaluation; and market engagement. The 1 SAN member organizations also support implementation of the system through efforts such as farmer training and support, partnership development, policy engagement and other activities within each member s geographic purview. Auditing of the SAN Sustainable Agriculture Standard is carried out by 1 SAN-accredited certification bodies, each of which must demonstrate a high level of technical and operational capacity to audit against this standard and support the SAN mission, and must successfully undergo accreditation by the International Organic Accreditation Service (IOAS), an independent accreditation body. Finally, a wide range of government, NGO, company and donor partners in both producing and consuming nations support the implementation of the SAN/ Rainforest Alliance certification system by providing farmer training and support; increasing farmers access to key inputs and finance; and developing value chains for sustainably produced agricultural products. SAN Vision A world where agriculture contributes to the conservation of biodiversity and sustainable livelihoods. SAN Mission To be a global network transforming agriculture into a sustainable activity. The Rainforest Alliance Vision A world in which people and the planet prosper together. The Rainforest Alliance Mission To conserve biodiversity and ensure sustainable livelihoods by transforming land use practices, business practices and consumer behavior. Theory of Change A Theory of Change is a logical framework that defines the means by which a mission-driven organization seeks to achieve its core goals and objectives through targeted sets of activities or investments. The SAN and Rainforest Alliance have developed a joint Theory of Change for the purpose of clarifying the priority outcomes and impacts that the SAN/Rainforest Alliance certification system seeks to achieve, and for defining the pathways by which the system SAN/Rainforest Alliance Impacts Report 15
16 The SAN/Rainforest Alliance Theory of Change Support strategies: activities & investments to advance the SAN and Rainforest Alliance missions Direct results: short-term effects on farm practices, management systems & purchasing decisions Field Level Key outcomes: changes in social, environmental, and farm productivity outcomes, and in policies/business practices Broader impacts: transformation of farming landscapes toward long-term sustainability Enabling Environment Robust standards & policies Establish and implement the SAN Sustainable Agriculture Standard and supporting policies and systems Support strategies contribute to the following direct results: Support to producers Provide training and support for farmers and groups Facilitate access to tools, inputs & services to support sustainable agriculture Companies & partners invest in training/support to increase the sustainability of farm production Market & policy linkages Promote consumer & market demand and policy support for sustainable products Establish credible traceability systems and claims for sustainable products Farms adopt better social, environmental & agronomic practices Farmers have increased knowledge & capacity to farm sustainably Farms and groups improve farm and business management systems Changes in farm practices and management systems lead to sustainability improvements in four key outcome areas: Biodiversity conservation Farms protect forests and other natural ecosystems Farms increase the amount & diversity of native vegetation Farms contribute to landscape-level conservation Endangered species and other flora & fauna are conserved Natural resource conservation Soil health is maintained & improved, and erosion is minimized Water pollution is minimized Farms use water efficiently and within natural limits Farms reduce net greenhouse gas emissions Farmer, worker, and family wellbeing Essential needs are met: food, housing, clean water, health care, education, transport, clothing, and savings Minors are not exposed to harmful labor conditions Worker rights are protected and the workplace is safe Farmer groups support smallholders through effective & transparent management Farms support local communities and avoid negative impacts Farm productivity and profitability Farms increase productivity of cash crops and staple food crops Farms produce higher-quality products Water, fertilizer, energy, pesticides, & labor are used more efficiently Farms realize higher profits Farms are more resilient to climate change and extreme events Companies & consumers: purchase more sustainable products & fewer unsustainable products recognize SAN/Rainforest Alliance certification and become more interested in sustainable purchasing Governments adopt policies and incentives that support sustainable agriculture Companies realize significant value from sustainable sourcing through reduced risk and improved brand value, reputation, product quality, and reliability of supply Sustainable practices are adopted beyond certified farms through replication, spillover, and supportive policies & incentives Outcomes are multiplied across many farms and supported by efforts of local communities, governments and NGOs to sustainably manage and govern nearby areas, resulting in: Sustainable, resilient rural landscapes that: Conserve native biodiversity and ecosystem services Produce crops/livestock efficiently & profitably Equitably improve local livelihoods Are managed to adapt effectively to changing conditions 16 An Introduction to the SAN/Rainforest Alliance System

17 intends to deliver these results. The Theory of Change provides a clear guiding framework not only for the standard-setting process but also for monitoring, evaluating and reporting the effects of the certification system, and for adjusting the system s standards, strategy and activities to deliver key outcomes more effectively over time. Independently-accredited certification bodies and their teams of auditors guide farmers through the certification process and ensure that the SAN Standard is being met. The Theory of Change presents the basic cause-and-effect logic by which the SAN/Rainforest Alliance certification system s support strategies contribute to direct results in the form of more sustainable farming practices, farm management systems, farmer knowledge, and consumer and company purchasing decisions. These direct results, in turn, are expected to contribute to intermediate results in the form of improved farm sustainability for biodiversity, natural resources, farm productivity and profitability, and the well-being of farmers, workers and their families. When these sustainability benefits are magnified across many farms, replicated and supported in synergy with activities of other stakeholders, the system s intended broader impact of creating and maintaining sustainable, resilient rural landscapes is advanced. Key aspects of the Theory of Change are elaborated further below. Driving change at the field level and in the enabling environment: The Theory of Change includes support strategies, direct results, and intermediate results focused both at the field level (left side of the diagram) and at influencing the enabling environment for sustainable agriculture (right side of the diagram). Both pathways are essential to achieving the Theory of Change outcomes and impacts, and the two function in a complementary way to support positive change on individual production units while simultaneously increasing incentives, investment and policy support for sustainable agriculture. When the Theory of Change logic plays out fully, improved sustainability at the field level benefits not only local producers and their neighbors, but also companies and consumers up the value chain. These benefits support a positive feedback whereby companies realize significant value from sustainable sourcing and therefore choose to invest more in increasing the sustainability of their supply base. At the same time, best practices are replicated and scaled up as neighbors, governments and other stakeholders see the benefit in sustainable agriculture. SAN/Rainforest Alliance Impacts Report 17

18 SAN/Rainforest Alliance support strategies: Support strategies are the activities that the SAN, the Rainforest Alliance, other SAN members and partners carry out to support the results identified in the Theory of Change. In addition to the establishment of the SAN Sustainable Agriculture Standard and its supporting policies and systems, key strategies include working with farmers and farmer groups to improve the sustainability of agriculture through training, field support and facilitating access to key management tools, farm inputs and sources of capital. The SAN members also work to increase demand for sustainably certified products and for sustainable farming practices from consumers, companies, food industry groups, governments and civil society. Cocoa farmers go over best practices at a Rainforest Alliance training session in Côte d Ivoire. Direct results: Direct results describe the changes in farming practices, farm management systems and farmer knowledge that are expected to arise from implementing the support strategies. These changes are important enablers of the key outcomes and broader impacts. Increased farmer knowledge and improved farm management systems also enhance land managers ability to respond and adapt to change, supporting resilient households and community livelihoods. Achievement of direct results may be supported or facilitated by the SAN/Rainforest Alliance certification system but also requires substantial initiative and sometimes investment on the part of producers and producer groups, who are instrumental in the achievement of the direct results. Key outcomes: Key outcomes include changes in social, environmental, economic and farm productivity conditions on and around certified farms. In many ways, these results are the most tangible manifestation of progress toward sustainability. Key outcomes also include improvements to the enabling environment that lead to better incentives, more supportive policies and the replication of sustainable practices beyond certified farms. The system s focus is on four outcome areas: Biodiversity conservation: Biodiversity conservation has always been a central sustainability focus for the SAN/Rainforest Alliance certification system. The goal is for farms not only to protect on-site conservation values (e.g., by conserving existing natural ecosystems and restoring native vegetation) but also to support conservation at a landscape level by maintaining wildlife corridors and supporting management objectives of nearby protected areas. The SAN Standard also helps protect endangered species and conserve other native flora and fauna. Natural resource conservation: Agriculture cannot be sustainable if it diminishes the essential natural resources that are the basis of a productive farm, including soils, water, and native species supporting pollination and pest control functions. Key intended outcomes include maintaining and improving soil health, reducing erosion, avoiding water pollution and using water in an efficient manner that leaves ample water resources to support nearby communities and ecosystems. By sustaining key natural resources, farms reduce their input costs and become less susceptible to droughts, pest outbreaks and climate change. Finally, farms increased tree cover, improved soil health and reduced input use all contribute to reducing greenhouse gas emissions and making sustainable farms part of the climate change solution. Together, these outcomes strongly support climate-smart agriculture, which improves farm performance for both climate change adaptation and mitigation. Farm productivity: A central objective of the SAN/Rainforest Alliance certification system is to support farmers in their efforts to increase the productivity, efficiency and profitability of their farms ensuring that agriculture can form the basis of a decent livelihood for generations to come. Key intended outcomes include increased productivity at a whole-farm level including cash crops, food crops, livestock and tree and forest products as well as improved product quality of cash crops. The efficiency with which farms use land, water, fertilizers and labor can vary dramatically with a given 18 An Introduction to the SAN/Rainforest Alliance System

19 region. By supporting more robust farm management systems, business management practices and natural resource management, the system seeks to close this efficiency gap so that farmers can save money on inputs while protecting the environment. Well-being of farmers, workers and their families: A decent standard of living is achieved when farmers, workers and their families have adequate resources for food, housing, clean water, health care, education, transport, clothing and savings. Improving agricultural livelihoods toward such a living wage or living income level is a core objective of the SAN and Rainforest Alliance. This outcome is promoted through a range of SAN Standard requirements and through the work of SAN members to leverage additional investment in support of key livelihood needs. Additionally, the SAN Standard helps ensure that the rights of workers and minors are protected, in accordance with local laws and international norms such as the conventions of the International Labour Organization. Where small-scale farmers are organized into groups, the objective is that these group structures support their members to improve their livelihoods through transparent governance and effective management of crop marketing, training and other functions. Broader impacts: While the achievement of these key outcomes within individual farms and farmer groups can be profoundly important, the SAN and the Rainforest Alliance also recognize that farms, communities and ecosystems stand a better chance of being sustainable in the long-term if they are supported by and linked to sustainable management efforts over a broader landscape. Sustainable rural landscapes typically include well-managed farms, waterways, forests or other natural ecosystems and human settlements, and deliver a full range of benefits for biodiversity conservation, food production and human livelihood advancement. The achievement and maintenance of sustainable, resilient rural landscapes is the ultimate broader impact identified in the Theory of Change. The SAN/Rainforest Alliance certification system contributes to this impact by promoting sustainable farming across a critical mass of farms within key landscapes and regions. SAN members also collaborate with community, government, corporate and NGO partners to establish complementary activities, policies, and investments that help replicate and complement best practices in sustainable management to scale impacts to entire landscapes. Unintended effects: While the Theory of Changes describes the results that the SAN and the Rainforest Alliance intend to support through their work, and the mechanisms by which these results are expected to be achieved, it is also possible that the certification system will cause or contribute to some unintended effects. The SAN and the Rainforest Alliance assess the potential for (or actual realization of) unintended consequences based on field auditing and training experience as well as input from producers, buyers and other stakeholders. The organizations then take steps to minimize negative unintended effects through design of field support programs, periodic revisions to the SAN Standard and policies and efforts to improve the enabling environment for sustainable agriculture. Key potential unintended effects are outlined below (but not shown in the Theory of Change diagram). Through certification, the SAN and Rainforest Alliance aim to build sustainable rural landscapes that extend beyond farms, conserving biodiversity and increasing habitat for wildlife like this blue-gray tanager in Peru. One set of unintended effects relates to the possibility that activities or results at each level of the Theory of Change will not drive the hypothesized changes at subsequent levels of the Theory of Change. For instance, field-level support strategies may drive the adoption of sustainability best practices in some issue areas but not others, or in some locales but not others. This may be due to constraints at the field level that are difficult to overcome, such as farmers lack of access to capital, or local adherence to farming practices that are at odds with those defined in the SAN Standard. It may also be a function of the design of the 21 SAN Standard, which permits farmers some leeway in not complying fully with a small proportion of continuous improvement criteria (see the next sub-section for further explanation of the SAN Standard structure). Even where improved practices are adopted, these practices might not always lead to SAN/Rainforest Alliance Impacts Report 19

20 an improvement in the key outcomes, due to variations in farm conditions and contexts, or other factors. And farm-level improvements in key outcomes might be of insufficient aggregate scale to strongly support sustainability at a landscape scale, or might be outweighed by other, unsustainable land-use patterns or trends in the landscape. All of these factors could impede attainment of the Theory of Change results. A second set of potential unintended effects has to do with the possibility of trade-offs among the different Theory of Change results. For instance, if farms retain and restore natural ecosystems and other native vegetation, their total crop production might be less in the short term than if they opted for monoculture production without natural vegetation. And the adoption of certain social and environmental good practices (e.g., payment of higher wages or installation of wastewater treatment systems) could reduce overall profitability or the availability of capital for other kinds of farm investments. Workers load a truck with freshly-picked oranges on a farm in Costa Rica. We also recognize that farmers participation in international value chains for traded commodities can have both positive and negative implications for sustainability. These effects are rarely unique to certified value chains, but certification may either ameliorate or exacerbate sustainability challenges. For instance, smallholder producers involved in certified value chains often benefit from greater external investment, training or support than their non-certified neighbors. However, as an unintended consequence, farmers could become more vulnerable to commodity price fluctuations, for instance, if they become more reliant on revenue from cash crops or more dependent on specific buyers or traders purchasing certified products. 2 An Introduction to the SAN/Rainforest Alliance System

21 The SAN Standard A centerpiece of the SAN/Rainforest Alliance certification system is the SAN Sustainable Agriculture Standard (referred to throughout this report simply as the SAN Standard 1 ), which codifies requirements for farms and farmer groups to become Rainforest Alliance Certified. The SAN Standard was developed through an international multi-stakeholder process, in accordance with the requirements of the ISEAL Alliance s Code of Good Practice for Setting Social and Environmental Standards. The July 21 version of the SAN Standard, the version in effect during the evaluation period for this Impacts Report, is organized into ten principles, each of which has several specific requirements (criteria) against which farms and groups seeking certification are evaluated. Each of the principles is briefly summarized below: Principle 1: Social and Environmental Management System. This principle addresses policies and procedures of the farm management or group administrator to support the implementation of the best management practices indicated in the SAN Standard. Effective farm planning, record-keeping, worker training and managerial commitment to sustainability can all support more robust social and environmental management. Principle 2: Ecosystem Conservation. This principle requires the protection of all natural ecosystems on the farm. It also prohibits the certification of farms that destroyed high value ecosystems subsequent to November 25. It encourages habitat restoration, safeguarding of nearby protected areas and protection of endangered plant species. It specifies shade cover parameters for managing agroforestry systems for shade-tolerant crops, riparian buffer widths, and setbacks and vegetation barriers between crops, natural ecosystems and areas of human activity. Principle 3: Wildlife Protection. This principle supports land management decisions that enable certified farms to serve as refuges for resident and migratory wildlife, especially species that are threatened. It also specifies requirements related to animals held in captivity. Principle 4: Water Conservation. This principle addresses water conservation and requires certified farms to take steps to prevent contamination of surface and ground water. Principle 5: Fair Treatment and Good Working Conditions for Workers. This principle requires certified farms to protect workers rights, safeguard against discrimination, avoid the worst forms of child labor and pay salaries at least equal to the legal minimum wage. It also specifies good practices and requirements for farm housing, safe drinking water, sanitary facilities and access to medical services and education for farm workers and their family members living on the farm. Principle 6: Occupational Health and Safety. This principle helps to safeguard worker health and well-being by defining requirements for occupational health and safety programs, worker safety training, emergency response measures, and proper facilities, equipment and procedures to ensure safe handling and use of agrochemicals and other hazardous materials. Principle 7: Community Relations. This principle requires farms to consider the interests and needs of the local community and manage their operations to minimize negative impacts to the community. It encourages farms to engage in positive ways with the surrounding community through employment opportunities, education and other means. Principle 8: Integrated Crop Management. This principle assists farms in mini- On a tea estate in Sri Lanka, vegetation barriers separate the tea field in the foreground from neighboring forest areas. 1 The SAN s standards framework consists of several different standard documents. The versions of these documents in effect during the evaluation period for this Impacts Report included the core Sustainable Agriculture Standard (July 21), the Standard for Sustainable Cattle Production Systems (July 21), the Group Certification Standard (March 211), and various supporting documents and policies. Collectively, these documents define the requirements for farms and groups to become certified. For ease of communication, throughout this report we refer to this collection of documents simply as the SAN Standard. SAN/Rainforest Alliance Impacts Report 21

22 Revisions to the SAN Standard The SAN periodically reviews and revises its sustainability standard in view of learning from the M&E system, feedback from stakeholders and changes in the broader dynamics of the agricultural sectors in which it works. The SAN initiated a full revision of its standard in 214, which is expected to culminate in July 216 with the publication of a new version of the SAN Standard. In addition to this full revision process, the SAN periodically makes mid-term adjustments to the standard to address specific issues that arise outside the time frame of the full revision process. Each of these revision processes is described briefly below. Mid-term revisions The SAN Standard changed very little during the evaluation period covered in this report (21 to 214). However, as of December 215, the SAN is making several mid-term revisions to address key social and environmental risks identified through field observations and stakeholder feedback. These changes, which have been codified as version 4 of the July 21 Sustainable Agriculture Standard, include: Elevation of the following regular criteria to critical criteria: management commitment to comply with requirements of the SAN Standard and of law (Criterion 1.3); worker training on pesticide use (Criterion 6.3); and proper washing facilities and procedures following agrochemical application (Criterion 6.16); Modification of the contents of the following criteria, which have also been elevated to critical criteria: worker housing that is safe, hygienic, and disease-free (Criterion 5.15); safe drinking water for farmers, workers, and their families (Criterion 5.16); and further prohibitions and safeguards related to the worst forms of child labor (Criterion 5.1); Addition of a new critical criterion requiring farms to have an effective complaint or grievance mechanism to protect workers rights (Criterion 5.1). More information on these changes is available on the SAN website, SAN Standard The new SAN Standard is scheduled to be published in July 216 and to become binding for audits beginning in April 217. The standard revision process entailed an extensive stakeholder engagement process, including three open public consultation periods facilitated by a web-based consultation platform as well as in-person stakeholder consultations in 5 producing and consuming countries. The new Standard incorporates several features that respond directly to learning from the M&E system and feedback from producers and other stakeholders. These include: A tighter linkage to the SAN/Rainforest Alliance Theory of Change, including a new architecture for the Standard oriented around the four key outcome areas defined in the Theory of Change; Increased value for producers, promoted through improved farm planning and management processes and by eliminating or streamlining requirements that were of lower priority relative to the Theory of Change; Stronger emphasis on key social and environmental safeguards and other essential aspects of sustainability, addressed through an increased number of mandatory requirements; and Increased emphasis on driving continuous improvement in sustainable practices, specified through changes to the scoring system and through farm planning processes that help producers identify and implement priority improvements. 22 An Introduction to the SAN/Rainforest Alliance System
. Principle 9: Soil Management and Conservation.")
23 mizing the use of agrochemicals especially highly hazardous ones and in applying integrated pest management. It specifies a list of banned pesticides, which may not be used on certified farms. The principle also prohibits the planting of transgenic crops (i.e., genetically modified organisms, or GMOs). Principle 9: Soil Management and Conservation. This principle fosters long-term sustainability on the farm by specifying requirements for maintaining soil health, reducing erosion, and ensuring that new production areas are sited only in agronomically suitable areas. Principle 1: Integrated Waste Management. This principle supports farms to be clean and orderly, with provisions that waste be properly managed and safely disposed of, and that waste is reduced or recycled when possible. The SAN Standard contains two different types of criteria. Critical criteria (of which there were 16 in the core Sustainable Agriculture Standard as of the end of the evaluation period for this report, applicable to both crop agriculture and cattle) must be completely fulfilled as a prerequisite for any operation to become and remain certified. Other criteria (often referred to as continuous improvement criteria ) are scored by auditors to determine whether operations are in full conformance, have a minor non-conformity (fulfilling 5 99 percent of the criterion s requirements), or have a major non-conformity (fulfilling less than 5 percent of the criterion s requirements). To become and remain certified, operations must comply with at least 5 percent of the applicable criteria of each principle and at least 8 percent of the total applicable criteria of the Sustainable Agriculture Standard. This approach requires that all operations have made substantial progress toward sustainability with respect to each of the ten principles and overall, while also affording some flexibility for operations to implement those practices or sustainability investments that are best suited to the needs and challenges of the operation. Data on conformance to the SAN Standard s continuous improvement criteria can be useful in tracking operations progress toward sustainability. Such data are reported in the crop spotlight and issue spotlight sections of this report for selected crops and geographies. Composting is used on the Hondupalma palm plantation in Honduras to recycle organic waste and boost soil health. The current SAN Standard was published in July 21 and went into effect in January 211. This version is largely similar to the April 29 version. The evaluation presented in this report focuses on results achieved during the five-year period from 21 to 214, during which the SAN Standard remained largely unchanged. In 214, the SAN initiated a process of revising the SAN Standard, based on detailed technical analysis, formal stakeholder consultation, and additional stakeholder outreach and field testing in key producing and consuming nations. As of the date of this report, the revision process is nearing completion and the new SAN Standard is expected to be published in mid-216 (see Sidebar: Revisions to the SAN Standard). The SAN/Rainforest Alliance Monitoring and Evaluation System The purpose of the SAN/Rainforest Alliance monitoring and evaluation (M&E) system is to understand the extent to which the intended results stated in the Theory of Change (i.e., direct results, key outcomes, and broader impacts) are being achieved and, more broadly, whether the hypothesized causal pathways in the Theory of Change have been borne out. This information is valuable for multiple purposes. Externally, it is essential for providing transparency and communicating to stakeholders about the successes and limitations of the certification system, and for identifying areas in which collaboration with external partners (e.g., local NGOs, companies, traders, government extension services, policy makers and others) may be especially important to help complement the work of the SAN and its members. Internally, M&E data provide insights into key trends and successes, as well as challenges that might need to be addressed through SAN/Rainforest Alliance Impacts Report 23
 or other activities.")
24 Andi Meega Mustika is part of a Rainforest Alliance project in South Sulawesi, Indonesia that trains students to gather baseline farm performance data and educate farmers in sustainable farming techniques. new field-level support (e.g., training) or other activities. M&E also provides a strong empirical basis for designing improvements to the system s core support strategies, including the SAN Standard. Indeed, learnings from the M&E system have been an important input to the SAN Standard revision process, scheduled to conclude by mid-216 with the publication of an updated SAN Standard (see Sidebar: Revisions to the SAN Standard, as well as the final chapter of this report for further discussion). The M&E system is designed and implemented in accordance with the ISEAL Alliance s Code of Good Practice for Assessing the Impacts of Social and Environmental Standards Systems (ISEAL Impacts Code). 2 The system monitors the reach, characteristics and selected outcomes of the SAN/Rainforest Alliance certification system at each level of the Theory of Change through a combination of basic data collection on all certified operations, sampled monitoring for a subset of certified operations, and in-depth outcome and impact evaluations to understand the causal relationships between support strategies and results. The chart on page 25 provides an overview of the M&E system, indicating the ways in which these different data sources and monitoring approaches are combined to assess results at each level of the Theory of Change. Please see Annex C for a description of the methodology used to develop and synthesize the evidence presented in this report. 2 For more information on the SAN/Rainforest Alliance M&E system and its conformance to the ISEAL Impacts Code, please visit rainforest-alliance. org/work/impact/research and download the latest Sustainable Agriculture Network/Rainforest Alliance Monitoring & Evaluation System Public Report. The thematic focus of M&E activities is defined by a suite of M&E indicators: objectively quantifiable measures to assess results at each level of the Theory of Change. These indicators are summarized in Annex C. While the Theory of Change and the M&E indicators framework define the entire scope of the M&E system, as indicated in Annex C, to date M&E activities and data collection have focused primarily on a subset of the indicators. Over the past several years, the SAN and the Rainforest Alliance have been investing in M&E system upgrades to progressively increase the topical coverage, completeness and accuracy of M&E information relative to the M&E system scope. These changes are described in the SAN/Rainforest Alliance M&E Systems Public Report. 24 An Introduction to the SAN/Rainforest Alliance System
25 Overview of the Monitoring and Evaluation System Results level (from Theory of Change) Data sources & methods Sections of this report where results are presented Support strategies Outputs operations, farmers, and lands to which support strategies are applied Reach of the SAN/Rainforest Alliance system; characteristics of participating operations, farmers, and lands; and trends are analyzed based on data from the SAN Certificate Database Our Global Reach (p. 26) Annex A: Global Reach, by Country (p. 12) Direct results short-term effects on farm practices, management systems, and purchasing decisions Changes in farm practices are analyzed based on SAN audit conformance data for selected crops and regions. More detailed evaluation of practice adoption (including comparisons to non-certified farms) is the focus of several scientific studies reviewed in this report. Practice adoption data are reported by crop in the crop spotlight sections for coffee (p. 36), cocoa (p. 46), tea (p. 56), and bananas (p. 66). Practice adoption data are reported by outcome area in the issue spotlight sections for livelihoods (p. 74), water (p. 8), biodiversity (p. 88), and climate-smart agriculture (p. 94). Sustainable (certified) purchasing is tracked through Rainforest Alliance s traceability database and market share analysis. Data on market share and sales are reported in the Executive Summary (p. 8) and in the crop spotlights (p. 36, 46, 56, and 66). Intermediate results changes in social, environmental, and farm productivity outcomes and in business practices and policies resulting from support strategies and direct results Intermediate results at the farm level are assessed through context-specific evaluation studies conducted by third-party researchers or, in some cases, with the involvement of SAN members. Many of these studies include comparisons to non-certified farms. Intermediate results related to specific crops are reviewed in the crop spotlight sections for coffee (p. 36), cocoa (p. 46), tea (p. 56), and bananas (p. 66). Intermediate results for key outcomes are reviewed in the issue spotlight sections for livelihoods (p. 74), water (p. 8), biodiversity (p. 88), and climate-smart agriculture (p. 94). Broader impacts transformation of farming landscapes toward long-term sustainability Broader impacts (beyond the farm level) are assessed through context-specific evaluation studies conducted by third-party researchers or, in some cases, with the involvement of SAN members. To date, broader impact studies are available only for coffee-producing landscapes. Broader results related to coffee certification are reviewed in the crop spotlight section for coffee (p. 36). SAN/Rainforest Alliance Impacts Report 25


26 Our Global Reach 26 Our Global Reach
27 Latin America country with SAN/Rainforest Alliance certificates Certified crops: bananas coffee oil palm tea cattle flowers pineapple other fruits & cocoa grapes spices vegetables see inset Note: This map depicts the patterns and distribution of SAN/Rainforest Alliance certificates at a generalized, global level, as of December 214. For locations of individual certificates, please visit SAN/Rainforest Alliance Impacts Report 27
28 Africa country with SAN/Rainforest Alliance certificates Certified crops: cocoa coffee flowers spices tea other fruits & vegetables Note: This map depicts the patterns and distribution of SAN/Rainforest Alliance certificates at a generalized, global level, as of December 214. For locations of individual certificates, please visit 28 Our Global Reach
29 Asia country with SAN/Rainforest Alliance certificates Certified crops: bananas cocoa coffee pineapple spices tea other fruits & vegetables Note: This map depicts the patterns and distribution of SAN/Rainforest Alliance certificates at a generalized, global level, as of December 214. For locations of individual certificates, please visit SAN/Rainforest Alliance Impacts Report 29
30 Our Global Reach Since 1992, when the first Rainforest Alliance certificates were awarded to banana farms in Costa Rica and Hawaii, the SAN/Rainforest Alliance certification system has grown immensely by all measures. By the end of 214, there were Rainforest Alliance Certified farms in 42 countries, growing 11 different crops, and covering an area of 3.5 million hectares nearly the land area of Switzerland. In 36 of these countries, Rainforest Alliance and other SAN members have conducted farmer training on sustainable agriculture practices. This section describes the size, growth, and basic characteristics of the SAN/Rainforest Alliance certification system worldwide. The number and area of certified farms have grown steadily over the past seven years, with especially large increases between 21 and 213 (Figures 1 and 2). The number of Rainforest Alliance Certified farms increased from just over 31, in 28 to about 1.2 million by the close of 214. Total certified farm area has also increased several-fold: there were 527, hectares of certified farm area in 28, compared with nearly 3.5 million hectares in 214. The total certified farm area includes production plots for certified crops, other production plots (e.g., for timber trees or food for household consumption), conservation areas and infrastructure such as worker housing and processing sites. Looking exclusively at the portion of the total certified farm area that is used for production of certified crops shows a similar rate of increase: this area grew from 273, hectares in 28 to 1,877, hectares at the close of 214. Figure 1. Growth in Rainforest Alliance Certified producers from ,2, 1,, 8, 6, 4, 2, Figure 2. Growth in Rainforest Alliance Certified production hectares and total hectares from Production hectares refers to land under certified crops only. Total hectares refers to the total size of certified farms, including on-farm infrastructure, conservation areas and land devoted to crops and livestock that are not commercialized as Rainforest Alliance Certified. production area 3,5, 3,, 2,5, 2,, 1,5, 1,, total area 5, Our Global Reach

31 Côte d Ivoire Guatemala Colombia Kenya El Salvador Chile Ecuador India Brazil Costa Rica all others Mesoamerica 29.8% South America 29% West & Central Africa 15.7% East & Southern Africa 12% South & West Asia 7.6% East & Southeast Asia 5.6% Caribbean.3% Figure 3. Number of SAN/Rainforest Alliance certificates per country, and proportional breakdown by region, as of December 214. See Annex A for full data for all countries. Where and With Whom We Work At the close of 214, there were 1,889 active SAN/Rainforest Alliance certificates in 42 countries. Côte d Ivoire topped the list, with 248 certificates, nearly all of which were groups of smallholder cocoa farms (Figure 3). Guatemala and Colombia had the next highest numbers of certificates, mostly coffee and banana farms. Approximately half of the active SAN/Rainforest Alliance certificates are group certificates, covering multiple individual member farms under a common group administrator that manages the certificate. Certified groups most commonly consist of smallholder farmers that grow certified crops for sale (such as tea or cocoa), frequently alongside food for their families. For more information on group certification for smallholder farmers, see Sidebar: Smallholders in the SAN/Rainforest Alliance Certification System. Bandulla Herath is one of 9 smallholder farmers who supply tea to Finlays certified Madulkelle Tea Factory in Sri Lanka. He also maintains a greenhouse to grow a wide assortment of vegetables for his own family. SAN/Rainforest Alliance Impacts Report 31
32 Figure 4. Number of Rainforest Alliance Certified farms per country, and proportional breakdown by region, as of December 214. See Annex A for full data for all countries. Kenya Côte d Ivoire Ghana Tanzania Indonesia Rwanda Burundi Ethiopia Uganda Turkey all others 1K 2K 3K 4K 5K 6K 7K East & Southern Africa 71.2% West & Central Africa 17.5% East & Southeast Asia 5.4% South America 2.5% South & West Asia 2.3% Mesoamerica.9% Caribbean.2% Figure 5. Total Rainforest Alliance Certified land area per country, in hectares, and proportional breakdown by region, as of December 214. See Annex A for full data for all countries. Côte d Ivoire Kenya Brazil India Tanzania Ghana Peru Ethiopia Guatemala Indonesia all others 1K 2K 3K 4K 5K 6K 7K 8K 9K East & Southern Africa 3.2% West & Central Africa 29.7% South America 16.5% Mesoamerica 9.5% South & West Asia 8.9% East & Southeast Asia 4.7% Caribbean.5% When we tally the total number of certified farms per country which includes every member of a certified group Kenya has by far the highest number, at 67,588 (Figure 4). This strong participation reflects growth in demand in recent years for Rainforest Alliance Certified tea, combined with Kenya s well-organized system of smallholder tea farmer cooperatives, managed under the Kenya Tea Development Agency. Côte d Ivoire and Ghana had the next highest numbers of certified farms. In these countries, the primary certified crop is cocoa, which has also seen rapid growth in demand, and whose farmers are also organized in groups. Côte d Ivoire has the largest amount of Rainforest Alliance Certified land, at 762,497 hectares. Even though the average size of certified farms in Côte d Ivoire is relatively small (6.3 ha), the large number of certified farms in the country puts it at the top of the list. Kenya has the second highest certified area, at 58,163 hectares, followed by Brazil, with 235,586 hectares (Figure 5). Unlike Côte d Ivoire and Kenya, with their many smallholder farmers, the certified area in Brazil is distributed among just 339 certified farms mainly coffee with an average farm size of nearly 7 hectares. 32 Our Global Reach

33 A farmer inspects his coffee plants on a farm in Jimma Zone, Ethiopia. Africa currently leads the tropical regions in certified land area, certified production area, and number of certified farms. For the first several years after its initiation in the 199s, Rainforest Alliance certification took place almost exclusively in Mesoamerica and South America, spreading slowly to parts of Asia and the Caribbean. In the past five years, however, certification activity in Africa has grown quickly, primarily due to increases in demand for certified tea and cocoa. Presently, Africa has the greatest certified land area, certified production area and number of certified farms of any of the tropical regions, although there are still substantially more SAN/Rainforest Alliance certificates in the Americas. Rainforest Alliance Certified Crops Bananas, coffee and cocoa were the first three crops to be certified by SAN/ Rainforest Alliance, and these crops, along with tea, remain dominant in terms of total crop production area (Figure 6). Tea, cocoa and coffee account for the largest number of farms under certification. At the end of 214, production from Rainforest Alliance Certified farms accounted for 15.1 percent of the total world production for tea, 13.6 percent for cocoa and more than 5 percent each for coffee and bananas. Oil palm had the fifth highest production area, at 51,663 hectares. SAN/Rainforest Alliance also certify a wide range of other fruits, vegetables and spices, as well as flowers and ornamentals, which together compose about 142, production hectares. cocoa tea coffee banana oil palm potato pineapple cattle citrus grapes pepper vanilla rooibos macadamia flowers other 1K 2K 3K 4K 5K 6K 7K 8K 9K Figure 6. Top 15 Rainforest Alliance Certified crops, by total number of production hectares. Data are as of December 214. SAN/Rainforest Alliance Impacts Report 33

34 Smallholders in the SAN/Rainforest Alliance Certification System In its early days, the SAN/Rainforest Alliance certification system involved mainly medium-sized and larger farm operations, whose managers typically had the capacity to implement and demonstrate conformance to the SAN Standard. However, this traditional farm-by-farm certification model proved generally inaccessible and cost-prohibitive to smallholders small-scale producers who rely mainly on family labor and manage a small plot of land to grow food for family consumption and/or cash crops. 3 Recognizing the importance to the SAN and Rainforest Alliance missions of improving the sustainability of smallholder agriculture and value chains, in 24 the SAN launched a group certification model and associated standard with the objective of enabling smallholder farmers to access certification. Accessibility of certification is now recognized as an important tenet of effective sustainability initiatives, and is included as one of the ISEAL Alliance s ten credibility principles for standards systems to deliver positive impact. 4 In making certification accessible to smallholders, the SAN and Rainforest Alliance strive, more specifically, to ensure that certification is: i) affordable to smallholders; ii) feasible to implement relative to smallholders context, operating constraints, and cultural norms; and iii) contributes significant positive value to smallholders farming operations and household livelihoods. Under the SAN group certification approach, smallholders are organized into groups that are managed and supported 3 The FAO characterizes smallholders as managing areas varying from less than one hectare to 1 hectares. 4 See Credibility Principles, ISEAL Alliance. by a group administrator. There are several different kinds of group administrator models, including traditional farmer cooperative structures as well as outgrower models and structures where a governmental or non-governmental entity serves as the group administrator. Regardless of the model, the group administrator plays several important roles in helping smallholders access certification. These include: Verifying that each group member complies with the SAN Standard by administering an internal control system to evaluate each member against the standard s applicable criteria and scoring system; Training and supporting group members (often with support from SAN member organizations or other partners) to achieve continual improvement relative to the sustainability practices and outcomes defined in the SAN Standard; Taking adequate steps to keep certified products separate from non-certified products, and to assess and mitigate other key risks; and Complying with the SAN Group Certification Standard, which codifies the preceding roles as well as additional practices that support progress toward sustainability of the group and its members. During the audit, auditors from accredited SAN certification bodies evaluate whether the group administrator has fulfilled the preceding requirements. Auditors also visit a sample of group members to assess their conformance to the SAN Standard. This sampling approach, combined with 34 Our Global Reach

35 2 ha ha Mesoamerica South America Caribbean West & Central Africa East & Southern Africa South & West Asia East & Southeast Asia % 5.1+ ha Figure 7. Percentage of Rainforest Alliance Certified farms in each of three different size categories, by region. 2 ha ha Mesoamerica South America Caribbean West & Central Africa East & Southern Africa South & West Asia East & Southeast Asia % 5.1+ ha Figure 8. Percentage of Rainforest Alliance Certified land managed by farms of each of three different size categories, by region. the group internal control system, is designed to reduce the audit cost of verifying conformance to the SAN Standard while still maintaining rigor. SAN/Rainforest Alliance group certification was first applied to a group of cocoa smallholders in Ecuador in 25, and moved into rapid scale-up beginning in 29, when the first group of Kenyan smallholder tea farmers (with about 12,5 members) achieved certification. Since then, use of group certification has grown rapidly. In June 21, 199 of the 71 SAN/Rainforest Alliance certificates (28 percent) were group certificates, and the average group size was 243 members. By December 214, the number of group certificates had more than quadrupled, to about 85. These certificates now compose nearly half of the total 1,889 SAN/Rainforest Alliance certificates, and average 1,41 members each (although with wide variation in size). Overall, more than 99 percent of Rainforest Alliance Certified farms are members of a group. The size of certified farms varies quite a bit from region to region. As illustrated in the above graphs, smallholder farmers managing less than 2 hectares each compose by far the largest number of certified farmers in South and West Asia, East and Southern Africa, and East and Southeast Asia. In the Americans, the Caribbean, and West and Central Africa, the farm size distribution tends toward more medium-sized farms (although many of the farms in the ha range would still be considered smallholders according to the FAO definition). The analysis of land area distribution by farm size indicates a dominance of smaller or medium-sized operations in West and Central Africa and the Caribbean, a dominance of medium-sized to larger operations in the Americas and South and West Asia, and a mix in East and Southern Africa and East and Southeast Asia. As all of these farm size data are based on the mean farm size per certificate (not size data for all of the nearly 1.2 million certified farms), the data should be interpreted as indicative but not precise distributions. The growth in SAN/Rainforest Alliance group certification in the past five years suggests that the model is being embraced by smallholders and by the group administrators, traders, buyers and external supporters that facilitate its adoption. A new study of Rainforest Alliance Certified coffee farmers in Brazil lends empirical support to the accessibility of the group model. Researchers found that group certification has allowed a wider range of farms sizes to access certified markets than individual certification, and that farmers certified in groups pay lower audit costs, yet perform similarly in audits. 5 5 Guedes Pinto et al. 214 SAN/Rainforest Alliance Impacts Report 35


36 Crop Spotlight: Coffee 36 Crop Spotlight: Coffee
37 5, 4, Figure 9. Trends in Rainforest Alliance Certified coffee production area (in hectares). 3, 2, 1, , 4, Figure 1. Trends in total quantity (in metric tons) of Rainforest Alliance Certified coffee produced. 3, 2, 1, Colombia 11.8% Figure 11. Rainforest Alliance Certified coffee production, by country. Vietnam 8.6% Peru 5.4% Brazil 34.6% Honduras 5.2% Guatemala 4.9% Costa Rica 4.4% Ethiopia 3.8% El Salvador 2.8% India 3.7% Nicaragua 2.6% Indonesia 3.5% Kenya 2.6% Mexico 2.1% Uganda 1.8% other 2.3% 5.4% of the world s coffee is Rainforest Alliance Certified 13 countries where Rainforest Alliance Certified coffee is sold 157,874 small farms (<2 ha) growing Rainforest Alliance Certified coffee 36,482 medium/large farms (>2 ha) growing Rainforest Alliance Certified coffee Figure 12. Rainforest Alliance Certified coffee by the numbers. SAN/Rainforest Alliance Impacts Report 37
.")
38 Crop Spotlight: Coffee Coffee is one of the world s most traded commodities, with a special importance for the rural economies of many developing countries in Latin America, Asia and Africa. Coffee farmers face an array of challenges, including commodity price fluctuations, and, increasingly, erratic rainfall patterns and devastating coffee diseases such as coffee rust (la roya). Poverty remains endemic in some coffee-growing regions, especially among smallholders. The SAN/Rainforest Alliance system seeks to address these challenges through social, environmental and agronomic criteria in the SAN Standard; training and support to coffee farmers across the tropics by SAN members and their partners; and work with coffee value chain partners to link demand for sustainably-produced coffee with on-the-ground sustainability investments. Since 1995, when the first Rainforest Alliance coffee certificate was awarded to a farm in Guatemala, the number of Rainforest Alliance Certified coffee farms has expanded to 194,356 farms in 24 countries. Many thousands of these farmers have also received training from SAN members or their partners on methods to boost yields and safeguard the health of their farmland for future generations. Noel da Silva unloads coffee cherries on the Fazenda Recanto farm in Brazil. Direct Results (Farm Practices and Management Systems) The SAN/Rainforest Alliance system promotes sustainable farm practices and effective management systems through numerous SAN Standard criteria as well as training programs. In this section, we review evidence on practice adoption rates based on two types of research. First, we present studies that compare farming practices on certified coffee farms with those on a comparable control group of non-certified coffee farms. Second, we document changes in certified farms practices over time, using information available from annual audit reports. Three studies evaluating practice adoption on Rainforest Alliance Certified coffee farms in Colombia and Nicaragua indicate that these farms are applying an array of good practices for environmental, agronomic, and social management at significantly higher rates than non-certified farms. 6 These practices address several sustainability topics, including: 6 Results in the following bulleted lists are referenced as follows: (a) are results from Rueda & Lambin 213, (b) are results from Hughell & Newsom 213, and (c) are results from Haggar et al Practices to protect water quality: Protecting water sources through fencing and reforestation (a) Planting streambank vegetation to reduce erosion (b) Using water-saving technologies while processing coffee (a) Using grease traps in the kitchen to prevent grease release into water bodies (a) Not discharging wastewater into crop fields (a) Using a septic tank to treat sewage (b) 38 Crop Spotlight: Coffee
39 Practices to effectively manage waste: Collecting trash from the field (a) Recycling (a) Not burning or burying trash (a) Practices to improve farm productivity, agronomy and management: Collecting ripe and over-ripe fruits (to control the coffee berry borer pest) (a) Using soil analysis to guide the application of fertilizer (a) Keeping records about the farm operation (a) Renovating the coffee plantation by cutting coffee bushes down to stumps since certification or within the last five years (a) Not burning agricultural residues (b) Practices to safeguard farmer and worker health and safety: Applying agrochemicals less frequently and using less toxic chemicals (c) Using protective equipment while working with chemicals (b) Using safe agrochemical storage practices (b) Providing training in first aid (b) Providing training in the correct use of pesticides (b) The researchers observed no significant difference in implementation rates between Rainforest Alliance Certified and non-certified farms for the following practices: Using biological control vs. chlorpyrifos (organophosphate insecticide) to control coffee pests (a) Adopting rust-resistant coffee plant varieties (a) Using organic fertilizer (a) Using synthetic fertilizer (a) Using glyphosate (weed killer) (a) Renovating by new planting since certification or within the last five years (a) Avoiding agrochemicals (b) Not hunting wild animals (b) Beyond changing practices on certified farms, one of these studies observed that Certification processes are generating spillover effects on adjacent farms and communities through emulation of practices and improved transparency and traceability. Environmentally friendly technologies, such as low-water depulping and manual, physical or biological control of pests and diseases, have reached certified farmers and extended to non-certified ones. Implementing the SAN code required improvements in trading practices, making cooperatives more transparent and accountable in their business deals for the benefit of certified and non-certified farmers alike. 7 Another way to evaluate the effects of certification on changes in specific practices is to use time-series data contained in certification audit reports. We conducted such an analysis for 68 Rainforest Alliance Certified coffee farms in Costa Rica, El Salvador, Guatemala, Honduras and Nicaragua. We identified all criteria for which auditors issued a non-conformity at the time of the first audit (in 211 or later), and then tracked these non-conformities over all subsequent audits (up to 214) to determine which had been eliminated by the time of the most recent audit, on average 16 months later. 8 Elimination of a non-conformity indicates an improvement in farm practices related to the requirements of the criterion. On average, certified coffee farms were issued 16 non-conformities at their first audit. Average rates of non-conformity within each of the ten SAN principles (i.e., the average percentage of criteria in each principle for which farms were issued a non-conformity) ranged from 7 26 percent at the time of the initial audit. By their most recent audit, 57 percent of these non-conformities had been eliminated (Figure 13). We also examined farm performance individually for each of the 99 criteria in 7 Rueda & Lambin For further explanation of this methodology, please see Annex C. SAN/Rainforest Alliance Impacts Report 39
, and the subset of these")
40 Figure 13. Average percentage of the criteria in each of the ten SAN principles for which coffee producers registered a non-conformity at the time of the initial audit (open circle), and the subset of these initial non-conformities that remained outstanding at the time of the most recent audit (shaded circle). Data are for the period for 68 coffee certificates in Central America (Costa Rica, El Salvador, Guatemala, Honduras, and Nicaragua). most recent audit initial audit 1. Social and environmental management 2. Ecosystem conservation 3. Wildlife protection 4. Water conservation 5. Fair treatment of workers 6. Occupational health and safety 7. Community relations 8. Integrated crop management 9. Soil management and conservation 1. Integrated waste management % the SAN Standard at the initial and most recent audits. Full results are available in Annex B. Here (and on page 42), we present salient results including successes as well as areas requiring further improvement related to six key sustainability challenges in the coffee sector: Challenge: intensification of coffee production reduces biodiversity. Although coffee evolved as a forest understory crop and was traditionally cultivated in agroforestry systems, the last few decades have witnessed a worldwide shift toward full-sun coffee varieties and removal of on-farm tree cover, with substantial loss of biodiversity value. Coffee grows under a shade canopy on a farm in Peru. SAN/Rainforest Alliance Results: At the initial audit, about 7 percent of certified operations conformed to the requirements of Criterion 2.8 to maintain a diversified shade canopy with at least 12 species per hectare, 4 percent canopy coverage, and two vertical strata. Conformance levels for this criterion increased further over time. In addition, the certification system was effective at promoting the maintenance or establishment of protective buffer zones along the banks of rivers, streams, lakes, wetlands, and other natural water bodies (Criterion 2.6), with the large majority of initial non-conformities being resolved by the most recent audit. Finally, through Critical Criteria 2.1 and 2.2, the SAN Standard requires that all natural ecosystems present on the farm when it is first certified are conserved and restored. These results indicate the role of SAN/Rainforest Alliance certification in promoting shade-grown coffee and diversified agroecosystems, which can provide substantial value for biodiversity. Challenge: coffee farming contributes to land degradation. Especially when coffee is cultivated on steep slopes or without adequate soil protection or addition of organic or mineral fertilizers, its production can degrade soils and jeopardize sensitive lands. SAN/Rainforest Alliance Results: At the initial audit, between 75 percent and 85 percent of certified operations conformed to criteria on soil erosion control, fertilization and maintenance of ground cover. By the time of the most recent audit, many initial non-conformances had been resolved, but new ones were registered, so overall conformance levels changed only slightly. This finding suggests that soil conservation and health topics are commanding the attention of farmers, but that economic or agronomic barriers or trade-offs are hindering full adoption of best practices. Challenge: waste from coffee processing contaminates water bodies. Coffee processing generates large amounts of acidic, organic waste. If not properly treated, this waste can severely impair water bodies and negatively affect their downstream users. 4 Crop Spotlight: Coffee

41 Worker housing on the Aquiares coffee farm in Costa Rica. SAN/Rainforest Alliance Results: Critical criteria prevent certified operations from discharging industrial or domestic wastewater into natural water bodies, unless it meets legal requirements or SAN-specified quality parameters. Additionally, dumping of solid waste is prohibited. Beyond these mandatory requirements, participation in the certification system was associated with overall improvement in two additional criteria: installation of wastewater treatment systems (Criterion 4.4) and wastewater discharge monitoring (Criterion 4.6). Challenge: poor labor practices and living conditions. Throughout much of the world, agricultural workers lack basic labor rights and protections, and live in conditions of squalor. SAN/Rainforest Alliance Results: Several critical criteria require that workers on certified farms enjoy basic rights and protections, including freedom from discrimination, the right to organize and collectively bargain, and payment of at least the minimum wage (a requirement that is often disregarded on non-certified farms). However, on some coffee estates, it has remained a challenge to ensure access to potable water at the work site and to maintain high quality standards for worker housing. The reduction in initial non-conformities related to these two criteria (5.14 and 5.15) indicates progress on these issues overall, but numerous operations still remained out of compliance with each requirement at the most recent audit. Recognizing the importance of these issues and the incomplete progress made from 211 to 214, the SAN elevated requirements related to worker housing and potable water to critical criteria effective December 215. Challenge: overuse of agrochemicals. In addition to posing risks to human health, wildlife and aquatic ecosystems, over-use of pesticides can foster a vicious cycle of fewer natural pest enemies on the farm, greater dependency on expensive chemical inputs and even pesticide-resistant pest populations. SAN/Rainforest Alliance Results: At the time of the initial audit, more than three-quarters of certified operations practiced integrated pest management techniques that strive to minimize the need for and use of chemical controls and two-thirds maintained records documenting their pesticide rotation and reduction efforts. Conformance with both these requirements increased over time. Additionally, Critical Criterion 8.4 forbids the use of 99 SAN-prohibited pesticides. Challenge: human exposure to hazardous agrochemicals. Farmers and farm workers in developing countries are commonly exposed to toxic chemicals due to a lack of proper protective equipment and safe facilities and procedures for pesticide storage, mixing and clean-up. Neighbors or bystanders are exposed from aerial spraying, drift or entry into recently sprayed areas. SAN/Rainforest Alliance Impacts Report 41
42 Adoption of Sustainability Practices on Certified Coffee Farms biodiversity conservation farmer, worker & family wellbeing natural resource conservation farm productivity & profitability Key sustainability issues in coffee production asterisk (*) denotes Critical Criteria most recent audit initial audit Percentage of certified operations with a non-conformity to selected SAN criteria at initial audit and the percentage of these initial non-conformities remaining by the time of the most recent audit for 68 certified coffee operations in Central America ( ) Intensification of coffee production systems reduces natural habitat, tree cover, and value for biodiversity 2.1* 2.2* Protect/restore all natural ecosystems No natural ecosystem destruction Buffers along water bodies Agroforestry shade cover Maintain ecosystem connectivity % Coffee farming contributes to land degradation associated with soil erosion or loss of soil fertility Soil erosion control Soil/crop fertilization program Vegetative ground cover Waste from wet processing of coffee cherries contaminates water bodies * Wastewater treatment systems No illegal wastewater discharge Water quality monitoring for discharge No solid waste in water bodies Workers experience unjust labor practices and lack access to potable water or decent housing 5.2* 5.5* * No labor discrimination Workers paid minimum wage or higher Working hours restrictions Workers have the right to organize Clean and safe housing Access to potable water Overuse of agrochemicals creates human health and environmental risks, and the potential for more resistant pest populations and fewer natural pest enemies * 8.5 Integrated pest management Agrochemical rotation and reduction No use of illegal/san-prohibited pesticides Reduce/eliminate WHO-classified pesticides Farmers, workers, and neighbors are exposed to hazardous agrochemicals * Agrochemical use training Safe agricultural storage Use of personal protective equipment Safety measures for agricultural use Protect all persons from agrochemicals Wash facilities for agrochemical workers 42 Crop Spotlight: Coffee
43 SAN/Rainforest Alliance Results: Critical Criterion 6.13 mandates the use of personal protective equipment for all workers coming into contact with agrochemicals. Other criteria to reduce risk of exposure for workers using agrochemicals especially those related to training, storage and washing facilities drove substantial improvement among the 68 operations evaluated. Of the 32 percent of operations that had an initial non-conformance related to agrochemical training or safe storage provisions at the initial audit, fewer than 1 percent remained non-conformant by the final audit. Likewise, of the 48 percent of operations not providing adequate washing facilities for agrochemical workers at the initial audit, about half had resolved these non-conformities by the final audit. Nevertheless, there were some new non-conformities in these criteria, so while overall conformance improved markedly, some improvement is still needed. The large majority (89 percent) of certified coffee farms took adequate actions to protect neighbors and workers from the effects of agrochemical application. Key Outcomes and Broader Impacts As reviewed elsewhere, at least eleven published studies have evaluated the effects of SAN/Rainforest Alliance coffee certification on different aspects of sustainability. 9 Below we summarize results of the most recent of these studies (published in 212 or later) according to four sets of themes: i) tree cover and landscape connectivity; ii) erosion, agrochemicals and water quality; iii) farm productivity and profitability; and iv) educational attainment. For further information on the effects of SAN/Rainforest Alliance coffee certification on wildlife, please see the Biodiversity Spotlight section. Tree Cover and Landscape Connectivity Across parts of Latin America and elsewhere, the expansion of sun-grown coffee has been progressively eliminating overstory trees and reducing the conservation value of coffee farms for migratory birds and other species. 1 With reference to this dynamic, several researchers have examined the effectiveness of SAN/Rainforest Alliance certification in helping to maintain diverse tree cover on coffee farms and in coffee-producing landscapes. Studies from two countries, conducted at both farm and landscape scale, indicate that SAN/Rainforest Alliance certification has positive effects on the extent and composition of tree cover. Looking within farm boundaries, researchers in Colombia compared 43 Rainforest Alliance Certified and 43 non-certified coffee farms, and found that the certified farms had significantly higher tree species diversity (a median of nine tree species per hectare) than the non-certified farms (median of six tree species per hectare), and that certified farms had increased tree species diversity over time. 11 Another study in the same region used satellite imagery to compare tree cover density in the Santander coffee-growing region between 23 and 29. Results indicated that Rainforest Alliance Certified coffee farms increased on-farm tree cover at a significantly higher rate than non-certified farms. 12 SAN/Rainforest Alliance coffee certification has also been documented to influence conditions at a scale beyond the boundaries of certified farms themselves. In the same study in Santander, Colombia, satellite imagery was used to assess the contribution of coffee production and of SAN/Rainforest Alliance certification to overall forest cover and configuration in the landscape. The investigators found that dense forest cover had increased in the coffee-growing region since the introduction of certification, which requires the protection of forest remnants and promotes increased connectivity among natural ecosystems. According to the authors, their study design suggests additionality in the impact of certification on tree cover increase: in a region with overall increase in tree cover, certified farms contributed significantly more to that trend than non-certified farms. Certification was also associated with more tree planting outside of coffee plots: in a different study in Colombia, 74 percent of certified farmers 9 For a more extensive review of this literature, please see Whelan & Newsom Jha et al Rueda & Lambin Rueda et al. 215 SAN/Rainforest Alliance Impacts Report 43

44 planted trees outside their coffee plots, compared to 47 percent of non-certified farmers. Prior to becoming certified, only 23 percent of the certified farmers had planted trees outside of coffee plots, suggesting that the certification mechanism contributed to this change. 13 Lastly, a study in the Gera district of Ethiopia examined the effects of SAN/Rainforest Alliance certification on deforestation rates, where coffee grows wild in the forest and is harvested, dried and sold by smallholders with traditional rights to a specific forest area. Forty percent of the forest in this region was cleared between 1985 and 21, despite the government s banning of wood extraction. Researchers used remote sensing data from 25 and 21 to compare deforestation rates on forests that contained Rainforest Alliance Certified wild coffee, forests with non-certified wild coffee, and forests with no coffee at all. The results showed that deforestation rates were the same in forests with no coffee and non-certified coffee, but significantly lower in the forests with certified coffee. 14 Erosion, Agrochemicals, and Water Quality Coffee farming conducted without good environmental management practices may threaten downstream water quality through the erosion of exposed soil, agrochemical contamination of farm runoff, and, during coffee wet-processing, the release of acidic, organic matter-rich effluent from coffee washing stations. The SAN Standard addresses the use of erosion-control practices, bans many of the most toxic agrochemicals, places restrictions on the use of less toxic agrochemicals and requires the effluent from coffee washing stations to meet water quality standards. Agronomist Ricardo Zúñiga with a vegetative barrier planted to prevent erosion on a Costa Rican coffee farm. Research indicates that these provisions of the SAN Standard do indeed lead to measurable improvements in water quality and the use of agrochemicals. A study including 11 Rainforest Alliance Certified farms and nine similarly-sized non-certified farms in Nicaragua found that certified farms were associated with better treatment of water contamination and implementation of water conservation measures, while similarly-sized non-certified farms were associated with erosion around water sources. 15 A study of 27 Rainforest Alliance Certified coffee farms and 27 non-certified coffee farms in the Santander and Cundinamarca regions of Colombia also compared several water-related measures. 16 This study found that water quality, as measured by the Stream Visual Assessment Protocol (which takes into account ten stream characteristics such as riparian vegetation and water turbidity), was significantly higher on certified coffee farms. In one of the two regions examined, streams on certified farms also contained a significantly higher diversity of pollution-intolerant invertebrate species than streams on non-certified farms, indicating better water quality; differences in the other region were also positive, but not significantly so. Farm Productivity and Profitability The SAN/Rainforest Alliance certification system promotes farming practices and provides training and support focused on helping coffee farmers increase productivity and consequently improve their livelihoods. Results of three studies that have examined this topic suggest that this work is making a positive difference. 13 Rueda & Lambin Takahashi & Todo Haggar et al Hughell & Newsom Hughell & Newsom Barham & Weber 212 The first study found that in Colombia s Santander region, farm productivity on Rainforest Alliance Certified farms was double that on non-certified farms, while net revenue was 2.5 times as high. 17 No significant differences were observed in the Cundinamarca region. A different study estimated that, after certification, farmers in a Peruvian coffee cooperative increased their annual production by 148 kg/hectare which led to an additional US $28/hectare in coffee net revenue for certified farmers. 18 The authors attribute this increase to systematic pruning and appropriate fertilization. Finally, a study in Nicaragua that compared 44 Crop Spotlight: Coffee

45 Farmer Spotlight: Certified Coffee in Guatemala Coffee farmer Leticia Monzón and her husband belong to an association of 53 members who together achieved SAN/ Rainforest Alliance certification. They live in the Chuchamatanes mountains of northern Guatemala. As a mother, I want to say that this has improved the well-being of our children. Before we joined this program, there was a lot of pollution. The wastewater from coffee mills, sewage everything went into the streams and rivers and contaminated them. Today we re improving everything on all levels. Now wastewater goes into sedimentation pools, and garbage is properly handled. Now that we protect the environment it helps each and every one of us personally. 11 Rainforest Alliance Certified farms to nine comparable non-certified farms found that annual productivity was higher on certified farms (1,43 kg/hectare versus 872 kg/hectare), as was annual gross income (US $4,256 per hectare versus US $2,25 per hectare). 19 While farm productivity and efficiency gains were salient factors in increasing coffee-related income, price premium sometimes cited as one of the main benefits of certification was found in a few studies to contribute only modestly. In a Rainforest Alliance Certified cooperative of smallholder coffee farmers in Peru, farmers received premiums ranging from 3.3 percent to 1.4 percent over a three-year period, with an average of 7.4 percent, or US $16 per producer per year. 2 In Nicaragua, the price paid for coffee was significantly higher on Rainforest Alliance Certified farms than on non-certified farms (US $.61/kg versus US $.47/kg). 21 In Colombia s Santander region, two-thirds of the 43 certified coffee producers surveyed reported receiving a price premium, but this premium averaged only about 2 percent. Interviews with these farmers found that, while 6 percent cited price premiums as a main reason for pursuing certification, once they were certified, farmers chose to remain in the system for different reasons. These reasons included better organization of the farm household, such as safe storage of tools and pesticides (88 percent); improved environmental conservation, including watershed protection, trash collection, recycling and correct handling of pesticides (6 percent); improvements in their agricultural practices (57 percent) and management skills (49 percent); increased productivity (49 percent); and better access to technical assistance (49 percent). The researchers independently corroborated these perceived benefits, finding evidence that certified farmers benefited from better peer-to-peer learning on best practices, more frequent visits from extension workers, NGOs and local cooperatives, and greater opportunities to benefit from external funding and marketing opportunities. 22 Educational Achievement The topic of educational achievement was examined in only a single study, which found that children of farmers on Rainforest Alliance Certified operations in Colombia had significantly higher levels of education than those of non-certified farmers. Specifically, the median educational achievement of the certified farmers children was two years higher than that of non-certified farmers children Haggar et al Barham & Weber Haggar et al Rueda & Lambin Rueda & Lambin 213 SAN/Rainforest Alliance Impacts Report 45


46 Crop Spotlight: Cocoa 46 Crop Spotlight: Cocoa
47 9, 7, Figure 14. Trends in Rainforest Alliance Certified cocoa production area (in hectares). 5, 3, 1, , 5, Figure 15. Trends in total quantity (in metric tons) of Rainforest Alliance Certified cocoa produced. 4, 3, 2, 1, Figure 16. Rainforest Alliance Certified cocoa production, by country. Côte d Ivoire 63.6% Indonesia 8.2% Ghana 14.9% Nigeria 2.5% Tanzania 2.3% Dom. Rep. 2.3% Ecuador 2.2% Cameroon 1.5% Peru 1.4% other 1.1% 13.6% of the world s cocoa is Rainforest Alliance Certified 73,763 farms (<2 ha) growing Rainforest Alliance Certified cocoa Figure 17. Rainforest Alliance Certified cocoa by the numbers. 114 countries where Rainforest Alliance Certified cocoa is sold 26,521 farms (>2 ha) growing Rainforest Alliance Certified cocoa SAN/Rainforest Alliance Impacts Report 47
.")
48 Crop Spotlight: Cocoa The world s chocolate and cocoa supply originates from roughly three million cocoa farms, the vast majority of them operated by smallholders (family farmers cultivating no more than a few hectares of land). Currently, almost three-quarters of all cocoa is produced in West and Central Africa, with the remainder coming from Asia (about 1 percent) and Latin America (about 17 percent). 24 These small-scale cocoa farmers many of whom are already struggling to earn a decent living are also contending with the effects of climate change, including warmer temperatures, less predictable rainfall patterns and diseases that infest the cocoa pod. Cocoa farming can also be a driver of deforestation when farmers seek to expand into tropical forest areas. Finally, child labor has historically been widespread in the cocoa industry in West Africa. While the industry has taken steps to reduce the worst forms of child labor in the past decade, child labor remains a significant concern. The SAN/Rainforest Alliance certification system seeks to address these challenges through the social, environmental and agronomic criteria in the SAN Standard, in conjunction with training programs by SAN members and partners. Much of this work stems from commitments by food companies to source Rainforest Alliance Certified cocoa. As of December 214, there were over 28, Rainforest Alliance Certified cocoa farms in 17 countries. Direct Results (Farm Practices and Management Systems) As a first step in understanding the effects of SAN/Rainforest Alliance training and certification, here we review evidence on practice adoption rates based on two types of research. First, we summarize results of studies that compare farming practices on Rainforest Alliance Certified cocoa farms with those on a comparable control group of non-certified cocoa farms. Second, we examine changes in certified farms practices over time, based on information from annual audit reports. Cocoa beans dry in the sun on a farm in Ecuador. 24 International Cocoa Organization 213/14 production estimates. 48 Crop Spotlight: Cocoa
49 most recent audit initial audit 1. Social and environmental management 2. Ecosystem conservation 3. Wildlife protection 4. Water conservation 5. Fair treatment of workers 6. Occupational health and safety 7. Community relations 8. Integrated crop management 9. Soil management and conservation 1. Integrated waste management % Figure 18. Average percentage of the criteria in each of the ten SAN principles for which cocoa producers registered a non-conformity at the time of the initial audit (open circle), and the subset of these initial non-conformities that remained outstanding at the time of the most recent audit (shaded green). Data are for the period 211 to 214 for 72 cocoa certificates in West and Central Africa (Cameroon, Côte d Ivoire, Ghana, and Nigeria). Three independent studies found greater adoption of several key social, environmental and agronomic sustainability practices on Rainforest Alliance Certified cocoa farms than on nearby non-certified farms. 25 These practices included: Using personal protective equipment for agrochemical applications (a) Using safe agrochemical storage practices (a) Maintaining protective buffers around water bodies (a) Retaining or planting shade trees (a, b 26 ) Adoption of more practices to improve cocoa quality, such as pod breaking and fermentation (c) Replanting or rejuvenating old cocoa trees (c) Farmer training typically delivered in the context of smallholder groups and cooperatives is a major mechanism by which the improved sustainability practices identified in the SAN Standard are shared and promoted among farmers that are certified or seeking certification. With stronger linkages to traders and international buyers, certified groups tend to attract greater training investment from external partners. For instance, in Côte d Ivoire, one study found that 91 percent of the sampled farmers on Rainforest Alliance Certified farms had received training in cocoa production best practices, logging an average of 5.5 training hours in the preceding year. This compared to only 13 percent of a comparable set of non-certified farmers, who received only.8 training hours, on average. 27 We also examined audit reports of 72 Rainforest Alliance Certified cocoa operations from Ghana, Nigeria, Cameroon, and Côte d Ivoire, to evaluate changes in performance from the initial audit (211 or later) to the most recent audit (up to 214) relative to the principles and criteria of the SAN Standard. Specifically, we assessed the extent to which producers resolved non-conformities that were issued at the time of the first audit, indicating progressive improvement. On average, certified producers were issued minor or major non-conformities for 14.7 percent of SAN criteria at the initial audit, but by the time of the final audit (an average of 15 months later) had eliminated 64 percent of these. Examination of audit results at the level of individual SAN criteria affords a richer view into the effects of SAN/Rainforest Alliance training and certification on specific sustainability issues facing cocoa farmers and their communities. Full criterion-level results are available in Annex B. Below and on page 51, we feature salient results related to four key sustainability challenges: Challenge: forest encroachment and biodiversity loss. Cocoa is grown mainly in regions of high-biodiversity, moist tropical forest. Historically, cocoa farming has displaced such forests, and poor farm management, which can hasten the onset of cocoa diseases and soil fertility loss, leads farmers to open up yet more production land. While cocoa farms can retain considerable biodiversity, this requires careful management of the shade canopy and other natural vegetation on the farm. 25 Results in the following bulleted list are referenced as follows: (a) are results from Addae-Boadu 214, (b) are results from Borg & Selmer 212, and (c) are results from Bennett et al Statistical significance was not reported for the comparisons in sources (a) or (b); however, as the differences were quite large, the observed patterns are reported here as descriptive findings. 26 Rainforest Alliance Certified farms that had participated in sustainability training and certification for several years had approximately 4 to 6 times as many shade trees per hectare as non-certified and newly-certified farms. 27 Bennett et al. 212 SAN/Rainforest Alliance Impacts Report 49

50 The Río Cheni runs clean through a cocoa farm in San Juan de Cheni, Peru, thanks in part to riparian buffers on its banks. 28 For further discussion of these issues, see Ruf For instance, the Cocoa Research Institute of Ghana recommends 4 percent shade canopy cover and the IITA Sustainable Tree Crops Program recommends 4 5 percent for optimal management of cocoa diseases, soil fertility, shade and productivity. SAN/Rainforest Alliance Results: SAN critical criteria help ensure that certified cocoa does not contribute to forest conversion. Additionally, the large majority of certified operations were found to maintain riparian buffers and other forms of habitat connectivity (criteria 2.6 and 2.9), which help protect conservation values in cocoa-producing landscapes. While shade management (and retention of shade cover) is typically an important part of field training for cocoa farmers preparing for SAN/Rainforest Alliance certification (or who are already certified), audit results show that fewer than 1 percent of operations conform to the SAN s shade cover parameters of at least 12 tree species per hectare, 4 percent canopy coverage, and two vertical strata. This pattern is due, at least in part, to ingrained perceptions and practices among many cocoa farmers and agronomists in West Africa for instance, a preference for sun-tolerant cocoa varieties and a generally mistaken belief that most or all shade trees must be removed to adequately control pests such as rodents and black pod disease. Low levels of shade cover are also attributable to government policies that disincentivize farmers from planting or maintaining trees on their farms. 28 Thus, while the SAN Standard, local training partners and other initiatives 29 are promoting the agronomic and environmental benefits of roughly 4 percent shade canopy cover, as yet these programs have not overcome the strong countervailing push for less shade cover. Research results presented above suggest that certification does promote tree planting; however, there may be a lag between tree planting and the maturation of a shade canopy conforming to the parameters of the SAN Standard. 5 Crop Spotlight: Cocoa
51 Adoption of Sustainability Practices on Certified Cocoa Farms biodiversity conservation farmer, worker & family wellbeing natural resource conservation farm productivity & profitability Key sustainability issues in cocoa production asterisk (*) denotes Critical Criteria most recent audit initial audit Percentage of certified operations with a non-conformity to selected SAN criteria at initial audit and the percentage of these initial non-conformities remaining by the time of the most recent audit for 72 certified cocoa operations in West Africa ( ) Cocoa farming encroaches into forests and protected areas, and reduces native vegetation and its value for biodiversity 2.1* 2.2* Protect/restore all natural ecosystems No natural ecosystem destruction No harm to nearby protected areas Buffers along water bodies Agroforestry shade cover Maintain ecosystem connectivity % Poor management of soil fertility, pests and diseases, and planting materials contributes to low yields, low farmer income, and unsustainable land use pressures G1.1 G1.4 Training and education program Integrated pest management Soil/crop fertilization program Training program for group members Training suited to local cultural context Farm families lack access to basic services, and child labor inhibits children s education, health and well-being 5.8* No employment of workers under 15 Restrictions on minors work on family farms Access to potable water Access to medical services Access to education Restrictions on minors harvesting work Farmers, workers, and neighbors are exposed to hazardous agrochemicals * * 8.5 Agrochemical use training Safe agrochemical storage Location of agrochemical and fuel storage Use of personal protective equipment Wash clothes after agrochemical work Agrochemical rotation and reduction No use of illegal/san-prohibited pesticides Reduce/eliminate WHO-classified pesticides SAN/Rainforest Alliance Impacts Report 51
, and subsequently achieved SAN/ Rainforest Alliance certification.")


52 The CAEZA Cocoa Cooperative in Côte d Ivoire Pascal Konin is one of 2 farmers who belong to the CAEZA cocoa farming cooperative in the Zagné region of western Côte d Ivoire. In 212, the cooperative received training on sustainable farming practices from local NGO CEFCA (see page 55), and subsequently achieved SAN/ Rainforest Alliance certification. While Pascal s work on the farm is still difficult, he says that thanks to the training by CEFCA, his productivity has increased, along with his income. He credits this improved productivity in part to the new practices he learned, such as the optimum spacing for cocoa trees and how to make a natural fertilizer from composted cocoa tree leaves and fruit pulp. But that s not all that has changed. According to Pascal, We no longer cut shade trees on our farms; we now take care of them and plant new ones. Pascal is especially focused on planting trees along the banks of the small river that flows through his farm, which, at five hectares, is one of the larger ones in the cooperative. These trees will protect the stream on the rare occasions that a special team, trained by the cooperative, applies fertilizers or pesticides. According to Pascal, not everyone in the cooperative knows how to read or write, but thanks to the training from CEFCA, everyone knows that agrochemicals should not be applied near the river. A boundary line of trees marked with red paint indicates where the stream buffer zone begins. Pascal s focus on learning fits nicely with the philosophy of the SAN/Rainforest Alliance system to promote continuous improvement. He says, We have learned many things, but weeding and disease control are still complicated tasks. We need to continue learning how to renovate the plantations when the trees are very old. Thanks to CEFCA s ongoing presence in the landscape, Pascal s wish for more training will likely become a reality. Farmers in CAEZA cooperative use red paint to mark the edge of the riparian buffer zone. Agrochemicals cannot be applied between the red-painted trees and the water s edge. A shade tree that Pascal Konin planted on his farm. He used to cut down all trees other than cocoa; now he lets them grow to provide an optimum shade cover for his crop while helping to protect the farm s soil, water and wildlife. Farmers in the CAEZA cooperative compost cocoa trimmings and pods to better manage organic waste and fertilize the soil without use of agrochemicals. Challenge: low yields associated with poor agronomy. Smallholder cocoa yields are generally far below where they could be, due to sub-optimal management of soil fertility and fertilization, pests and diseases, and planting materials (e.g., pruning). Low yields keep farm families trapped in poverty and exacerbate pressure on nearby forests, as families seek other income sources. SAN/Rainforest Alliance Results: Certification is associated with progressive improvement in crop and soil fertilization practices, and increased access to training opportunities for smallholder farmers that are part of certified groups. While some of the initial non-conformities related to integrated pest management (IPM) were resolved by the time of the most recent audit, results indicate that IPM remains an important need among certified farmers to reduce pest-related crop losses while minimizing the use of pesticides. With this need in mind, the new SAN Standard places increased emphasis on IPM and other aspects of integrated farm planning and management. 52 Crop Spotlight: Cocoa

53 Challenge: entrenched poverty and child labor. Due in part to low cocoa yields and the dearth of other income-generating opportunities, cocoa-producing families frequently remain in poverty. Availability of social services is limited in many cocoa-growing areas. Additionally, child labor has historically been widespread in cocoa-growing regions in West Africa, potentially endangering children and limiting their educational opportunities. SAN/Rainforest Alliance Results: Audit results indicate that SAN/Rainforest Alliance certification effectively curtails the employment of minors on cocoa farms, including by limiting work to tasks that are not hazardous and by limiting work hours to levels that do not interfere with schooling. 3 Additionally, audit results indicate that school-aged children of farmers in certified groups had access to education. Access to potable water was available for smallholders in about three-quarters of certified groups, and access to medical services was available to smallholders in about 8 percent of certified groups. Challenge: Farmers, workers and neighbors are exposed to hazardous agrochemicals. Smallholder farmers and family members are commonly exposed to toxic chemicals due to a lack of proper protective equipment and safe facilities and practices for pesticide storage, mixing and clean-up. SAN/Rainforest Alliance Results: Criteria to reduce risk of exposure for workers using agrochemicals especially those related to training and storage facilities drove substantial improvement among smallholders in the 72 certified groups evaluated. While roughly half of certified operations registered non-conformities to these criteria at the initial audit, the large majority of these non-conformities had been resolved by the time of the most recent audit. To help promote safer agrochemical use practices, group administrators have also taken steps at a group level, such as forming spraying teams to demonstrate good application techniques and safety procedures. The Standard was also effective at preventing the use of SAN Prohibited Pesticides, eliminating use of pesticides classified by the World Health Organization (WHO) as extremely hazardous or highly hazardous (Class 1a/1b), and reducing use of pesticides classified by the WHO as moderately hazardous (Class II). Key Outcomes and Broader Impacts The body of literature on the outcomes and impacts of SAN/Rainforest Alliance cocoa certification and training has grown substantially in the past few years. Most of this research has focused on cocoa productivity, quality and profitability. A worker demonstrates some of the protective gear used during agrochemical spraying on a cocoa farm in Côte d Ivoire. Especially in West Africa, most smallholder cocoa farmers who ultimately pursue SAN/Rainforest Alliance certification first participate in a training program implemented by SAN members or local partners. This training covers, among other things, practices aimed to increase farm productivity, such as optimal fertilization, pruning and plot rejuvenation techniques. As described below, at least four empirical studies conclude that Rainforest Alliance Certified farms increased farm productivity relative to their non-certified neighbors, while three studies reported greater farm profitability from cocoa production. In one study in Ghana, researchers found that cocoa yields were significantly higher on Rainforest Alliance Certified farms (averaging 394 kg/hectare) than on uncertified farms (averaging 251 kg/hectare). 31 Interviews with these certified farmers confirmed that most found SAN/Rainforest Alliance certification to be well worth their while: 67 percent indicated that returns from certification were much more than what they invested in the process, while another 22 percent indicated that returns were a bit more than what they invested. Another study, also from Ghana, found that Rainforest Alliance Certified farms 3 For full detail on these provisions, please see criteria 5.9, 5.1 and 5.2 of the 21 SAN Standard. 31 Deppeler et al. 214 SAN/Rainforest Alliance Impacts Report 53
54 had higher productivity than non-certified farms, and that farms with a long certification history had the highest productivity. Specifically, established Rainforest Alliance Certified farms averaged 774 kg/hectare of dried cocoa beans, compared with 527 kg/hectare on newly certified farms, 544 kg/hectare on comparable non-certified farms, and 4 kg/hectare across Ghana. Certified farmers reported modest improvement in incomes, but said they were still somewhat unhappy with them. Non-certified farmers also reported that income was a major challenge, but, unlike their certified counterparts, they experienced no income improvements. 32 A 211 study carried out in the context of private-public partnerships between cocoa industry actors, international donors and local training partners examined how SAN/Rainforest Alliance certification affected smallholders in six cocoa cooperatives in two regions of Côte d Ivoire. The project trained 5,6 cocoa farmers, who subsequently delivered about 6, tons of certified cocoa to market. The study found that the average annual productivity on certified farms was nearly 5 percent higher than on non-certified farms, averaging 761 kg/hectare compared to 59 kg/hectare on non-certified farms. All six study cooperatives also increased their cocoa quality: measures of flavor, color, amount of foreign matter and moisture content all improved across the board. The authors attribute these differences in cocoa productivity and quality to farmer training in crop management, tree pruning, raising seedlings in nurseries, agroforestry systems and integrated pest management, the latter of which is credited in reducing the number of cocoa pods affected by black pod disease by about 35 percent. 33 A separate study in Côte d Ivoire compared farm practices, yield and income on certified and non-certified farms both at the start of certification (29) and two years later (211). This research revealed evidence of strong economic benefits, including significantly higher annual yields on certified farms (576 kg/hectare vs. 334 kg/hectare, an average of 72 percent higher on the certified farms). As the costs of production (including inputs such as labor, processing, and agrochemicals) was comparable on certified and non-certified operations, the certified farms generated nearly four times as much net cocoa income as the non-certified farms. 34 Associated with these quantitative gains was an improvement in farmers outlook: 67 percent of certified farmers reported that their economic circumstances had improved, while 75 percent of the uncertified farmer group said that their circumstances had worsened. Farmer confidence in the future of cocoa production was also higher among farmers who had achieved SAN/Rainforest Alliance certification. Two studies one in Ghana and one in Nigeria reported that certified cocoa was more profitable to farmers than non-certified cocoa based on several standard business measures of profitability. In Ghana, the benefit/cost ratio was estimated at 1.34 for Rainforest Alliance Certified cocoa versus 1.18 for non-certified cocoa, while the Internal Rate of Return was 54 percent for certified cocoa versus 3.5 percent for non-certified cocoa. In Nigeria, the researchers likewise estimated an Internal Rate of Return of 59.6 percent for certified cocoa (including SAN/Rainforest Alliance and three other certification systems) versus 31.3 percent for non-certified cocoa, based on 59 percent higher gross revenues and 161 percent higher net revenues Borg & Selmer Krain et al Bennett et al Ghana: Addae-Boadu 214. Nigeria: Oseni & Adams 213. As neither study reported statistical significance, these findings are shared here only as indicative, descriptive results. 36 Addae-Boadu 214 Finally, as noted earlier, poor management of soil fertility and crop fertilization is a primary obstacle to higher cocoa yields and a contributor to long-term degradation of cocoa-producing lands. A study of soil chemical properties on 15 cocoa farms (5 each of Rainforest Alliance Certified farms, UTZ Certified farms, and non-certified farms) found that the Rainforest Alliance Certified farms registered significantly better soil fertility properties than non-certified farms relative to percent carbon, percent organic matter, available phosphorus and exchangeable potassium. Percent nitrogen was not significantly different between non-certified farms and either type of certified farms Crop Spotlight: Cocoa


55 SAN Member Profile: CEFCA The Center of Studies, Training, Consulting and Audits (Centre d Etudes, Formation, Conseils et Audits), or CEFCA, is a non-governmental organization based in Côte d Ivoire, created in 21 with the objective of contributing to the sustainable development and social welfare of rural communities. The organization works mainly with cocoa farmers in Côte d Ivoire, hibiscus farmers in Burkina Faso and some coconut and coffee farmers. CEFCA works to achieve its conservation and livelihoods goals in many ways. Through its Farmer Field School, CEF- CA trains lead farmers in the implementation of sustainable agricultural practices and the requirements of the SAN Standard. These lead farmers return to their villages and cooperatives and train their neighbors and communities in sustainable farming. The CEFCA training covers practices that protect natural resources and conserve biodiversity, but also focuses heavily on practices that help rural communities improve their living conditions. Farmers also learn about the importance of avoiding child labor and the negative effects this practice has on children and communities. Because the usual practice of planting cocoa seeds directly into the soil is less effective than planting established seedlings, CEFCA runs a nursery to harvest cocoa seeds and grow young plants that are then distributed to farmers. To date, the organization has distributed 1, cocoa seedlings. CEFCA also teachers farmers how to establish a nursery themselves. To date CEFCA s training work has benefited more than 1, cocoa farmers, using locally adapted training curricula and participatory methods to help cocoa farmers improve their farm and their livelihoods, step by step. The example of CEFCA s work illustrates how the SAN Standard and SAN members training investments work in synergy. The SAN Standard establishes an overall framework for sustainable agriculture covering the full range of key social, environmental and economic topics while SAN members help localize this framework by engaging farming communities to share knowledge and implement context-appropriate practices. In each community where CEFCA works, training is designed to reach farmers of both genders and all education levels. Training is conducted in the farmers own language, and uses graphics and photos so that farmers who do not read and write can participate. Farmers also can visit CEF- CA s demonstration plots, where best practices are applied adjacent to conventional practices, allowing farmers to leave the classroom and observe differences firsthand in the field. Even the most remote farmers can be reached using the radio program that CEFCA produces in cooperation with other local NGOs. A CEFCA training session combines classroom training (shown here) with hands-on demonstrations and practicums. Cocoa in a farm in Beue, west Côte d Ivoire. SAN/Rainforest Alliance Impacts Report 55


56 Crop Spotlight: Tea 56 Crop Spotlight: Tea
57 4, 3, Figure 19. Trends in Rainforest Alliance Certified tea production area (in hectares). 2, 1, , 7, Figure 2. Trends in total quantity (in metric tons) of Rainforest Alliance Certified tea produced. 5, 3, 1, Figure 21. Rainforest Alliance Certified tea production, by country. India 2.8% Kenya 47.7% Indonesia 6.1% Malawi 5.7% Sri Lanka 4.2% Argentina 3.1% Tanzania 2.9% Uganda 2.6% Rwanda 2.2% Turkey 1.3% other 3.5% 15.1% of the world s tea is Rainforest Alliance Certified 125 countries where Rainforest Alliance Certified tea is sold 26,646 small farms (<2 ha) growing Rainforest Alliance Certified tea 443,8 medium/large farms (>2 ha) growing Rainforest Alliance Certified tea Figure 22. Rainforest Alliance Certified tea by the numbers. SAN/Rainforest Alliance Impacts Report 57

58 Crop Spotlight: Tea Originating in China, tea is now grown most widely in India, China and Kenya. Tea estates are an important employer in most tea growing regions, since harvesting occurs year-round and involves hand-plucking the top two or three leaves of every branch. Current environmental challenges associated with tea farming include soil erosion, overuse of fertilizers and agrochemicals, and the inefficient use of woodfuel in the tea drying process, leading indirectly to deforestation. Key social challenges in many parts of the sector include low wage levels for workers, lack of protection of workers rights, low income levels for smallholder tea producers, and limited access to quality housing, health care, and other basic needs. Tea pluckers at work on a certified tea estate in Coonoor, India. SAN/Rainforest Alliance tea certification has expanded dramatically over the past five years. Supported by sustainable sourcing commitments by Unilever (Lipton and PG Tips brands), Taylors of Harrogate (Yorkshire Tea brand), Tata Global Beverages (Tetley Tea brand), Teekanne Tee, Typhoo Tea and others, the volume of Rainforest Alliance Certified tea produced has increased from 123, metric tons (MT) in 21 to more than 8, MT by the end of 214. And the strong emphasis on including smallholder tea producers in certified value chains has meant that the number of Rainforest Alliance Certified farms has grown from 15, in 21 to over 7, in 214. By the end of 214, Rainforest Alliance Certified tea was being produced in 18 countries. Direct Results (Farm Practices and Management Systems) In this sub-section, we review evidence on the extent to which the SAN/Rainforest Alliance certification system promotes sustainable farm practices and 58 Crop Spotlight: Tea
59 effective management systems on tea farms. First, we review the results of four independent research studies; then, we report changes in certified farms practices over time, using information available in annual audit reports. The four studies evaluating practice adoption on Rainforest Alliance Certified tea farms in Kenya and India indicate that certified farms are applying an array of good practices for environmental, agronomic and social management at significantly higher rates than non-certified farms. These practices address several sustainability topics, including 37 : Practices to protect water quality: Maintaining protective buffer strips along water bodies (a) Monitoring river water quality (a) Prohibiting the application of agrochemicals within 15 meters of water bodies (b) Practices to improve farm productivity, agronomy and waste management: Plucking tea leaves frequently (b) Applying composted manure frequently (b) Keeping records on farm inputs and production (b) Implementing a waste collection system on the farm (a, b) Practices to safeguard tea worker health and safety: Providing worker access to water on the farm (a) Providing access to medical and educational facilities (c) Educating workers on health issues (d) Wearing personal protective equipment while applying agrochemicals (b, d) Creating no-pesticide buffer zones around the factory, houses, schools, forest, and water bodies (d) Training workers on safety and other job-related issues (a) Training workers on child labor policies (a) Other practices: Providing employees training and education on conservation (a) Workers participating in environmental management activities (a) To provide additional insight into changes in specific practices associated with certification, we used time-series data contained in SAN/Rainforest Alliance certification audit reports for 53 certified tea farms in Kenya, Malawi, Rwanda and Tanzania. We identified all criteria for which auditors issued a non-conformity at the time of the first audit (in 211 or later), and then tracked these non-conformities over all subsequent audits (up to 214) to determine which had been eliminated by the time of the most recent audit, on average 18 months later. 38 Elimination of a non-conformity indicates an improvement in farm practices related to the requirements of the criterion. 37 Results in the following bulleted lists are referenced as follows: (a) results from Ochieng et al. 213, (b) results from Waarts et al. 212, (c) results from Stathers & Gathuthi 213, and (d) results from Lalitha et al For further explanation of this methodology, please see Annex C. most recent audit initial audit 1. Social and environmental management 2. Ecosystem conservation 3. Wildlife protection 4. Water conservation 5. Fair treatment of workers 6. Occupational health and safety 7. Community relations 8. Integrated crop management 9. Soil management and conservation 1. Integrated waste management % Figure 23. Average proportion of the criteria in each of the ten SAN principles for which tea producers registered a non-conformity at the time of the initial audit (open circle) and the subset of these initial non-conformities that remained outstanding at the time of the most recent audit (shaded circle). Data are for the period for 53 tea certificates in East Africa (Kenya, Malawi, Rwanda, and Tanzania). SAN/Rainforest Alliance Impacts Report 59
.")
60 On average, certified tea farms were issued 13 non-conformities at their first audit, with non-conformance rates ranging from 2 23 percent for each of the 1 SAN principles. By their most recent audit, 83 percent of these non-conformities had been eliminated (Figure 23). We also examined non-conformances for each of the 99 criteria in the SAN Standard individually at the initial and most recent audits. Full results are available in Annex B. Here and on page 61, we present salient results relative to six key sustainability challenges in the tea sector: Challenge: depletion or contamination of natural water bodies. In some regions, tea is irrigated to an extent that can stress nearby water bodies if the farm is located in an area of water scarcity. Although tea processing requires relatively little water, effluent from washing processing equipment and machinery can contaminate nearby water bodies if this effluent is not properly managed. SAN/Rainforest Alliance Results: Critical Criterion 4.5 prohibits certified operations from discharging industrial or domestic wastewater into natural water bodies, unless it meets legal requirements or SAN-specified quality parameters. Additionally, at the initial audit, roughly 8 percent of certified operations conformed to criteria related to wastewater treatment systems, water quality monitoring for discharge and adoption of a water conservation program. Nearly all operations that used irrigation employed practices to optimize water use and avoid wastage (Criterion 4.3). Trees buffer the edge of the Kitabi Tea Estate in Rwanda. Challenge: forest depletion associated with fuelwood demand. Tea drying is an energy-intensive process that is often fueled by locally harvested wood. Fuelwood demand can drive deforestation and forest degradation. It may also spur the planting of fuelwood tree species such as eucalyptus, which can deplete the groundwater. 6 Crop Spotlight: Tea
61 Adoption of Sustainability Practices on Certified Tea Farms biodiversity conservation farmer, worker & family wellbeing natural resources conservation farm productivity & profitability Key sustainability issues in tea production asterisk (*) denotes Critical Criteria most recent audit initial audit Percentage of certified operations with a non-conformity to selected SAN criteria at initial audit and the percentage of these initial non-conformities remaining by the time of the most recent audit for 53 certified tea operations in East Africa ( ) Excessive water use for irrigation and processing depletes water sources; effluent from tea processing contaminates natural water bodies * 4.6 Water conservation program Irrigation monitoring and efficient use Wastewater treatment systems No illegal wastewater discharge Water quality monitoring for discharge % Fuelwood demand for tea drying depletes local forests and increases competition for firewood and land * 2.2* Energy efficiency plan Protect/restore all natural ecosystems No natural ecosystem destruction No harm to nearby protected areas No harvest of threatened plants Tea farming displaces wildlife and exacerbates human-wildlife conflict 2.1* * Protect/restore all natural ecosystems Buffers along water bodies Maintain ecosystem connectivity Protect wildlife habitat No hunting Workers experience unjust labor practices and policies 5.2* * No labor discrimination Workers paid minimum wage or higher Working hours restrictions Respectful treatment of workers Workers have the right to organize Farmers, workers, and their families lack access to potable water, decent housing, and basic services Clean and safe housing Access to potable water Access to medical services Access to education Farms suffer from low productivity and/or soil degradation due to sub-optimal management of soil fertility, planting materials, and harvest schedules G1.1 G1.4 Training and education program Soil erosion control Soil/crop fertilization program Train group members on SAN standard Conduct training in local language SAN/Rainforest Alliance Impacts Report 61

62 SAN/Rainforest Alliance Results: From their initial audit onwards, certified East African tea farms complied with criteria to conserve natural ecosystems and nearby protected areas, and avoid any harvest of trees or plants except pursuant to a sustainable management plan. At the time of the initial audit, more than 9 percent of operations also had an energy efficiency plan, including an inventory of farm energy sources. However, some operations were given new non-conformities in this area, suggesting difficulty implementing their energy efficiency plans. Challenge: tea farming displaces wildlife and exacerbates human-wildlife conflict. Tea is often grown in monocultures that are not suitable habitat for most wildlife species. Where farms displace wildlife or occupy their natural movement routes, there is an elevated risk of human-wildlife conflict, as has occurred between elephants and humans in India, for example. SAN/Rainforest Alliance Results: Nearly all farms were in conformance with criteria addressing these challenges, including those related to protection of natural ecosystems, habitat connectivity, and avoidance of hunting. The one exception was the maintenance of buffer zones along water bodies, which registered about 72 percent overall conformance at the initial audit, with the majority of non-conformances being eliminated by the most recent audit. A smallholder tea farmer in Turkey with a portion of the day s harvest. Challenge: low productivity and soil degradation. To attain high productivity and leaf quality, producers must adequately manage crop and soil fertility, pluck tea leaves at a frequent interval, and periodically plant new tea bushes. Low productivity results when these practices are not followed, which especially tends to be the case for smallholders. Poor soil management and lack of erosion control can also lead to land degradation, which may reduce the yield potential of farm plots in the long term. 62 Crop Spotlight: Tea

63 SAN/Rainforest Alliance Results: Certified tea operations took steps to address these challenges by implementing erosion control measures, instituting a soil and crop fertilization program, and ensuring that workers or smallholder group members received appropriate training and education in good practices. Fewer than ten percent of farms had weaknesses in these areas at the initial audit; by the most recent audit, nearly none did. Challenge: unjust labor practices and policies. Throughout much of the world, agricultural workers lack basic labor rights and protections against discrimination, harassment, inadequate wages and excessive overtime. SAN/Rainforest Alliance Results: Nearly all certified tea farms complied with requirements to protect workers from unjust labor practices related to wages, discrimination and harassment and to uphold the right to organize. The notable exception was Criterion 5.6, which caps the workweek at 48 hours, requires one day off per week, and outlines the farm s obligations for paid vacation, among other requirements. Over half of certified operations did not fully conform to this criterion at their first audit. By the time of the most recent audit, the vast majority of operations addressed these initial shortcomings, but there were some new non-conformities. Thus, although overall conformance rose from 49 percent to 77 percent, this topic merits continuing attention. Challenge: lack of access to basic needs and services. In many countries with large tea estates, workers are provided with housing, medical treatment, and other basic services as part of their employment. However, housing on these estates is often dilapidated or unsanitary. SAN/Rainforest Alliance Results: Audit results indicate that access to medical care for workers and their families, and access to education for schoolaged children living on farms, was nearly universal among certified operations. Of those operations that provided housing for their workers, nearly 2 percent did not conform fully to the quality housing specifications of the SAN Standard at their initial audit. By the most recent audit, all operations had addressed those initial issues, but another 25 percent had received new non-conformities related to housing. At the time of the initial audit, farmers and farm workers on about 77 percent of certified operations had access to adequate potable water. This percentage remained about the same by the most recent audit, as initial non-conformities were resolved while some new ones were introduced. The SAN criteria that address housing and access to potable water have recently been elevated to critical criteria (see Sidebar: Revision of the SAN Standard). Key Outcomes and Broader Impacts Betty Maritim is the hospital matron at Unilever Tea Kenya Central Hospital, which provides healthcare to the workers on Unilever s Kericho tea estate. Three recent studies examine the outcomes and impacts of SAN/Rainforest Alliance training or certification at the farm level. Below we summarize results of the most recent of these studies according to two themes: i) productivity, tea leaf quality and farmer income; and ii) health, household management and education. Productivity, Tea Leaf Quality, and Farmer Income Researchers in Kenya compared 93 tea farmers who had received training on the SAN Standard and tea production best practices with 48 tea farmers that had not received training. 39 They found tea leaf quality (as indicated by the number of rejections at collection centers) increased significantly after training focused on practices in the SAN Standard. The authors attribute this quality increase to the implementation of best practices such as higher plucking frequency. Approximately half of the farmers who had achieved certification at the end of 39 Waarts et al. 212 SAN/Rainforest Alliance Impacts Report 63
64 this study reported receiving a price premium for their tea. Those farmers who had received training reported that their livelihoods had improved and that increased productivity was a benefit of training; farmers that had not received training did not report such improvements. However, when the researchers calculated net income and productivity, they did not find a significant difference between the certified and non-certified groups. 4 A different study in Kenya, which compared responses from 1 farmers on Rainforest Alliance Certified farms with those from 15 non-certified farmers, also found no significant difference between productivity on Rainforest Alliance Certified farms and non-certified farms. 41 This study also compared changes in cash savings and found that the farmers on certified farms had saved an additional 9633 Kenyan Schillings (KES) (about US $95) over the past two years, compared with a loss of 7317 KES (about US $7) by those on non-certified farms. 42 For a study in Tamil Nadu, India, researchers interviewed 4 farm workers on seven Rainforest Alliance Certified tea estates and one non-certified estate. For the hired farm workers who pluck tea leaves, the annual income estimates that researchers calculated for workers on certified estates were significantly higher than those for workers on non-certified estates, as was the hourly rate for overtime. 43 On these same farms, a significantly higher percentage of workers on certified farms (compared to those on non-certified farms) had contracts and were entitled to annual paid leave, sick leave and maternity leave. These researchers found no significant differences between the two groups for the other worker wage or benefit variables that they examined. In Kenya, farmers from Rainforest Alliance Certified farms reported that as a result of certification they now treat their hired workers better, providing food, clothing and help in emergencies. In terms of wages, managers on certified farms paid hired workers 9.93 KES/kg, versus 6.65 KES/kg paid by non-certified farms. 44 According to the farm managers, the SAN Standard requirements for fair treatment of hired workers and annual audits have led managers to pay wages more regularly, and to provide better accommodation, food and clothing. Health, Household Management, and Education In Kenya, farmers who received training on best practices in the SAN Standard reported fewer ailments, which they attributed to the safer use of agrochemicals. 45 In addition, a focus group of farmers from Rainforest Alliance Certified farms associated certification with improved human and environmental health Waarts et al Stathers et al Stathers et al Lalitha et al Stathers et al Waarts et al Stathers et al Lalitha et al Lalitha et al Lalitha et al Stathers et al Waarts et al Lalitha et al. 213 On Indian tea estates, a significantly larger proportion of workers on Rainforest Alliance Certified estates than non-certified estates reported that they experienced positive changes in occupational health. 47 Specifically, on certified estates, 56 percent of female workers and 58 percent of male workers reported experiencing positive changes to their health; for non-certified workers, these rates were only 4 percent and 13 percent for female and male workers, respectively. Two managers of certified estates reported that the number of person-days lost to sickness has been reduced due to certification. 48 Research in India found that workers on Rainforest Alliance Certified estates were significantly more satisfied with their housing than workers on non-certified estates. 49 In Kenya, SAN/Rainforest Alliance certification was identified as having raised awareness about the importance of joint planning and decision making within households and the importance of household budgeting. 5 Members of certified groups cited cleaner homes, due to better waste management, as a benefit of training. 51 In India, a higher proportion of workers children on Rainforest Alliance Certified estates attended school, compared with children of workers on non-certified estates. 52 Those workers were also more satisfied with the schooling than workers on non-certified estates. 64 Crop Spotlight: Tea

65 Farmer Spotlight: Certified Tea in Kenya Simon and Esther Langat of Nyanza Province, Kenya, are a husband-and-wife smallholder team who produce for the Momul Tea Factory, the first smallholder tea group to achieve SAN/Rainforest Alliance certification, in 29. Simon: I have a two-acre farm, which I have had for 28 years. We plant vegetables and raise cows, but tea is our main source of income; it allows us to pay school fees and to provide employment to three workers who pluck our tea. I teach at the local school but my wife is fully engaged at the farm. During the holidays, our children, who are in college, come home to help. Rainforest Alliance certification is good because it emphasizes environmental conservation, water harvesting, worker welfare and proper disposal of waste. I bought a water tank for harvesting rain water, and I built a bio-gas unit to create renewable energy for cooking. Around my farm I have also planted indigenous trees. I have bought personal protective equipment for my pluckers, and they are happier. We used to use longer plucking intervals, but the Rainforest Alliance taught us to use a seven- to eight day-plucking interval, and because of that my yield has doubled. Finally, the Rainforest Alliance trainings taught me to keep records: now I always record my daily yields, and that encourages me to improve. My neighbors have learned from us and are now using some of these practices, too. I hope to be a role model for environmental conservation. SAN/Rainforest Alliance Impacts Report 65


66 Crop Spotlight: Bananas 66 Crop Spotlight: Bananas
67 1, 8, Figure 24. Trends in Rainforest Alliance Certified banana production area (in hectares). 6, 4, 2, ,, 5,, Figure 25. Trends in total quantity (in metric tons) of Rainforest Alliance Certified bananas produced. 4,, 3,, 2,, 1,, Figure 26. Rainforest Alliance Certified banana production, by country. Costa Rica 2.2% Guatemala 44.9% Honduras 11.8% Columbia 1.2% Panama 4.3% Ecuador 4.1% Philippines 3.2% other 1.3% 5.6% of the world s bananas are Rainforest Alliance Certified 62 countries where Rainforest Alliance Certified bananas are sold small farms (<2 ha) growing Rainforest Alliance Certified bananas 1,665 medium/large farms (>2 ha) growing Rainforest Alliance Certified bananas Figure 27. Rainforest Alliance Certified bananas by the numbers. SAN/Rainforest Alliance Impacts Report 67

68 Crop Spotlight: Bananas Bananas are the world s most popular fruit, and the basis of a US $7 billion global industry that employs hundreds of thousands of workers. In the 198s and 199s, banana production expanded significantly in several tropical regions, with tropical forests being cleared for large banana monocultures using heavy inputs of water, fertilizers and pesticides. These unsustainable practices and the low genetic variability of intensively-grown banana cultivars led to widespread outbreaks of viruses, fungi and insects. Plastic bags impregnated with pesticides, used to protect banana clusters until harvest, were commonly tossed on the ground or into waterways. Dependence on agrochemicals led to concerns for the environment and worker health and safety. In tandem with increased public awareness of the unacceptable conditions on banana farms, the Rainforest Alliance created its first banana standard in 199. By 1997, Chiquita had committed to certifying all its bananas to the Rainforest Alliance standard. 53 By the end of 214, 1,665 banana farms in 12 countries were Rainforest Alliance Certified, covering over 9, production hectares. A bunch of bananas awaits packing on a Rainforest Alliance Certified Chiquita plantation in Costa Rica. Starting in 1997, Chiquita committed to achieving certification for all of its bananas. Direct Results (Farm Practices and Management Systems) Only one peer-reviewed study has evaluated the effects of SAN/Rainforest Alliance certification on the adoption of more sustainable farm practices and effective management systems. Here, we summarize this study and present results from a new analysis of changes in certified banana farms practices over time, using information available from annual audit reports. 53 The initial Rainforest Alliance banana standard predates the establishment of the SAN in Melo & Wolf 25. Note: although this report generally focuses on reviewing literature published from 212 onward, in the case of bananas, we chose to review two older studies because the SAN Standard for bananas has changed relatively little since the time of this research, so the studies provide evidence that is relevant for understanding the effects of the SAN Standard in the evaluation period. In Ecuador, researchers compared the performance of 1 Rainforest Alliance Certified banana farms and 14 similarly-sized non-certified farms relative to a set of 29 environmental and social best practices. 54 Practice-level performance was then amalgamated to create a land management index, a water quality management index, an agrochemical management index and a waste management index for certified and non-certified farms. For each of these indices, Rainforest Alliance Certified farms performed significantly better than the non-certified farms. The authors also reported differences in implementation for a sub-set of the 29 practices, although they did not report the statistical significance of these differences. For all practices for which data were reported, the certified farms performed better than non-certified. These practices included: Creating buffer zones or vegetative barriers Treating banana processing wastewater before release Avoiding use of the herbicide paraquat Conducting analytic and diagnostic procedures before using agrochemicals Record-keeping on agrochemicals Training on pest management for farm workers Returning banana stalks to the field to enhance organic matter Disposing of plastic bags properly 68 Crop Spotlight: Bananas

69 A worker cuts bunches of bananas off their stalk at a farm in Costa Rica. To better understand the adoption of more sustainable practices by certified banana farms, we conducted a time-series analysis based on data contained in certification audit reports for 26 Rainforest Alliance Certified banana farms in Costa Rica, Guatemala, and Honduras. We identified all criteria for which auditors issued a non-conformity at the time of the first audit (in 211 or later), and then tracked these non-conformities over all subsequent audits (up to 214) to determine which had been eliminated by time of the most recent audit, on average 2 months later. 55 Elimination of a non-conformity indicates an improvement in farm practices related to the requirements of the criterion. On average, certified banana farms were issued 1 non-conformities at their first audit, with non-conformity rates ranging from 1 25 percent for each of the 1 SAN principles. By their most recent audit, 82 percent of these non-conformities had been eliminated (Figure 28). We also evaluated each of the 99 SAN criteria individually to assess change between the initial and most recent audits. Full results are available in Annex B. Selected results that relate to the most salient sustainability challenges in the banana sector are presented on page 71 and discussed further below. Challenge: processing effluent contaminates water bodies. Two pollutants associated with banana processing facilities are of greatest concern. The 55 For further explanation of this methodology, please see Annex C. most recent audit initial audit 1. Social and environmental management 2. Ecosystem conservation 3. Wildlife protection 4. Water conservation 5. Fair treatment of workers 6. Occupational health and safety 7. Community relations 8. Integrated crop management 9. Soil management and conservation 1. Integrated waste management % Figure 28. Average proportion of the criteria in each of the ten SAN principles for which banana producers registered a non-conformity at the time of the initial audit (open circle) and the subset of these initial non-conformities that remained outstanding at the time of the most recent audit (shaded circle). Data are for the period for 26 banana certificates in Central America (Costa Rica, Guatemala, and Honduras). SAN/Rainforest Alliance Impacts Report 69

70 Bananas are washed after harvesting at a farm in Costa Rica. Between their initial and most recent audits, the proportion of certified banana farms in Central America that conformed to criteria on wastewater treatment infrastructure and water quality monitoring jumped from less than half to nearly all. first is organic waste, which accumulates while preparing and washing bananas and can harm aquatic life through eutrophication when released into nearby water bodies. The second pollutant of concern is fungicide residues. These pollutants can be minimized using filtering systems that collect and treat organic residue. SAN/Rainforest Alliance Results: At the initial audit, less than half of certified banana farms had in place compliant wastewater treatment systems and water quality monitoring systems (criteria 4.4 and 4.6, respectively). By the most recent audit, nearly all farms had come into conformance. From the start, all banana farms conformed to the critical criteria prohibiting illegal wastewater discharge and the dumping of solid waste in water bodies. Challenge: overuse and misuse of agrochemicals. Excessive use of agrochemicals can harm water resources and wildlife while contributing to pesticide-resistant pest populations. Farm workers may be exposed to toxic chemicals if they do not use adequate personal protective equipment or if the farm lacks safe facilities and procedures for pesticide storage, mixing and clean-up. SAN/Rainforest Alliance Results: All certified farms avoided SAN Prohibited Pesticides and applied the principles of integrated pest management. Certified farms also took steps to reduce use of WHO-classified pesticides (Criterion 8.5), with 58 percent of certified farms in conformance at the initial audit, rising to nearly 1 percent by the most recent audit. While the large majority of banana farmers had adequate buffers along water bodies and between chemical use and natural areas (Criteria 2.5 and 2.6) during the initial audit, the farms that were non-conformant initially remained so by the 7 Crop Spotlight: Bananas
71 Adoption of Sustainability Practices on Certified Banana Farms biodiversity conservation farmer, worker & family wellbeing natural resource conservation farm productivity & profitability Key sustainability issues in banana production asterisk (*) denotes Critical Criteria most recent audit initial audit Percentage of certified operations with a non-conformity to selected SAN criteria at initial audit and the percentage of these initial non-conformities remaining by the time of the most recent audit for 26 certified banana operations in Central America ( ) Effluent from washing and processing sites contaminates water bodies * * Wastewater treatment systems No illegal wastewater discharge Water quality monitoring for discharge No solid waste in water bodies % Overuse and misuse of agrochemicals creates human health and environmental risks * 8.5 Buffers between chemical use and natural areas Buffers along water bodies Integrated pest management Agrochemical rotation and reduction No use of illegal/san-prohibited pesticides Reduce/eliminate WHO-classified pesticides Workers experience unjust labor practices and lack access to potable water or decent housing 5.2* 5.5* * No labor discrimination Workers paid minimum wage or higher Working hours restrictions Workers have the right to organize Clean and safe housing Access to potable water Solid waste contaminates the land and water, and is disposed in ways that threaten human well-being Integrated waste management program No open dumps or open-air burning Safe waste deposit areas No waste accumulation At some sites, plantation management lacks the awareness, commitment, or resources to effectively drive sustainability improvements Social and environmental management system Plans and policies to comply with standard Management commitment to certification Documentation of management system Evaluate impacts of new farm activities Continual improvement program SAN/Rainforest Alliance Impacts Report 71

72 most recent audit. At the time of initial audit, about 7 percent of producers had a worker training program for agrochemicals covering eight points specified in the SAN Standard, and this proportion increased further over time. Challenge: unjust labor practices and lack of access to potable water or decent housing. Throughout much of the world, agricultural workers lack basic labor rights and protections, and live in conditions of squalor. A spraying team suits up in protective gear before applying agrochemicals on a banana farm in Honduras. SAN/Rainforest Alliance Results: The audit report results indicate that certified banana farms comply with requirements related to clean and safe housing for workers. Additionally, farms uphold a variety of labor rights outlined in the SAN Standard and pay wages at least equal to the legal minimum wage or the regional average wage, whichever is greater. Given that many agricultural workers earn well below the minimum wage, this practice may signify an important benefit for workers on certified farms. Challenge: solid waste contaminates the land and water. Banana farms typically protect clusters of growing bananas from attack by fungal disease and insect pests by enclosing them in pesticide-impregnated plastic bags. These plastic bags create an environmental risk if they are not properly disposed. SAN/Rainforest Alliance Results: Certified banana farms are forbidden to dump solid waste in water bodies, pursuant to Critical Criterion 4.7. Certified farms also eliminated the use of open dumps and open-air burning (increase in conformance from 88 percent to 1 percent). Many farms still have improvements to make in the areas of developing safe final deposit areas for on-farm waste disposal (Criterion 1.3) and avoiding the accumulation of all types of waste on the farm (Criterion 1.5); while many of the initial non-conformities were resolved, new ones were introduced in subsequent audits. Challenge: limited awareness, commitment, or resources for farm management to effectively drive sustainability improvements. The banana export sector is dominated by large plantations, which are professionally managed, often under the auspices of corporate farm owners. For these larger operations, the establishment of written management systems, plans and policies for socially and environmentally responsible farming take on extra importance. SAN/Rainforest Alliance Results: The large majority of farms had in place policies, plans and programs to institute socially and environmentally responsible management throughout the organizational hierarchy, and conformance increased further by the time of the most recent audit. Likewise, nearly all certified farms had instituted a continuous improvement program to identify and rectify needed improvements, ensure follow-up, and document problems, corrective actions and outcomes of these actions. Key Outcomes and Broader Impacts 56 Melo & Wolf 27 Only one peer-reviewed study has examined outcome-level results on Rainforest Alliance Certified banana farms. Researchers working in Ecuador examined Rainforest Alliance Certified banana farms and a sample of similar-sized non-certified banana farms, and found that yields on certified farms were 39.9 metric tons per hectare per year versus 32.7 metric tons per hectare per year on uncertified farms. 56 The statistical significance of these results was not reported. The average banana yield in Ecuador during the same period was 26.9 metric tons per hectare per year. The authors attribute the relatively high yields on both certified and non-certified farms to the use of fertilizers and agrochemicals by farms in the sample. However, they noted that the certified farms used these inputs more efficiently as a result of good practices instituted through regular worker training events. 72 Crop Spotlight: Bananas

73 Farmer Spotlight: Certified Bananas in Costa Rica Eriberto Ruiz works on Finca Santa Marta, a Rainforest Alliance Certified banana farm in Bataan, Limón, in the Atlantic region of Costa Rica. I wake up every day at 4 a.m., get ready, eat breakfast and take a 1-minute bicycle ride to the farm, where I prepare the land, cover the banana bunches and harvest the bananas. This farm is Rainforest Alliance Certified, and they do things differently here. They are fair to the workers. We earn a good salary. It s not like we will be rich, but I am very organized, so I can provide for my family and live peacefully. The farm provides benefits like social security, paid vacations, holidays, Christmas bonus and overtime pay. When I worked on a cattle farm here in the Bataan, I didn t have any social benefits. I had to work more and was paid less. I have learned many new things on the farm. For example, I didn t know anything about sustainability before I started working here. The owners explained to us why it is so important to plant new trees, conserve the soil and water and protect the animals. We receive trainings at the farm twice or three times a year about other things too, like first aid and the safe use of agrochemicals. I do things differently in my garden at home now too I don t use chemicals anymore, I don t pollute the water, and I planted new trees. I want to protect the land and my family. SAN/Rainforest Alliance Impacts Report 73
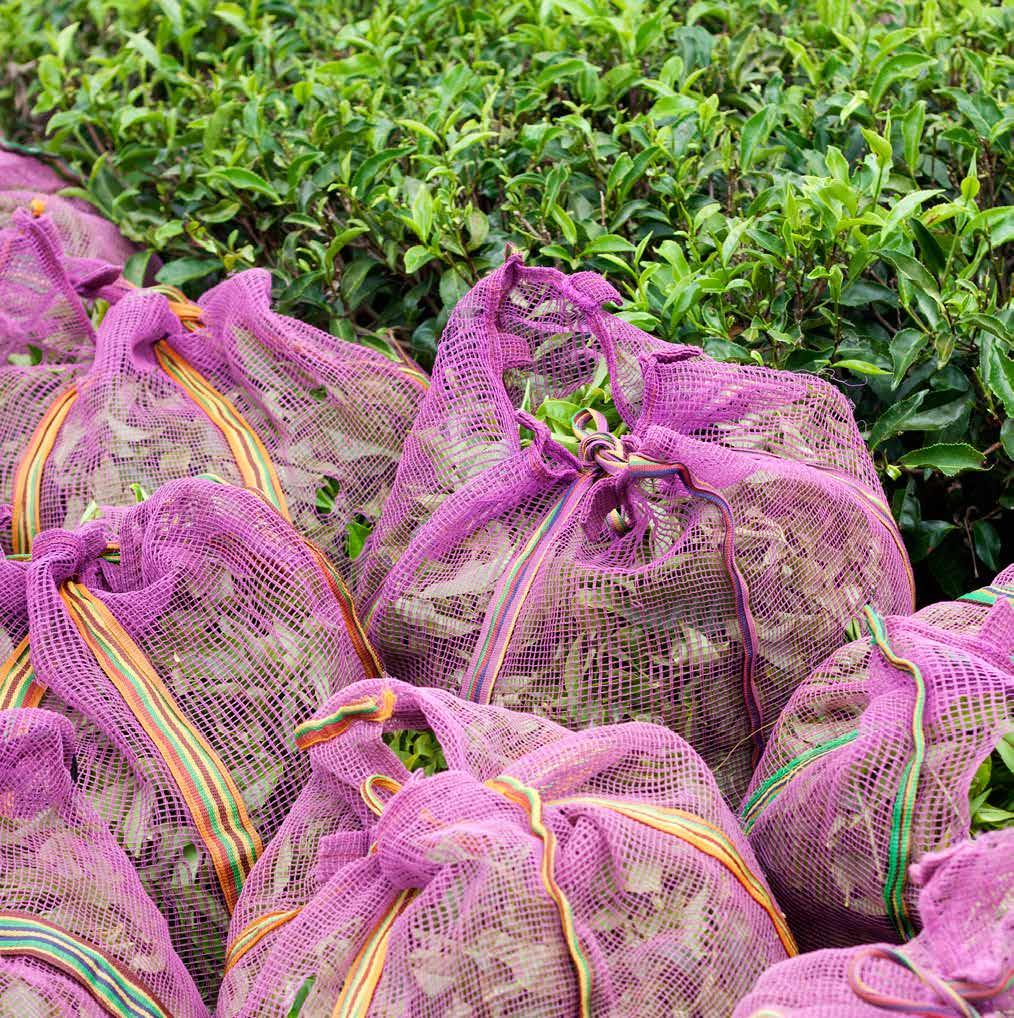
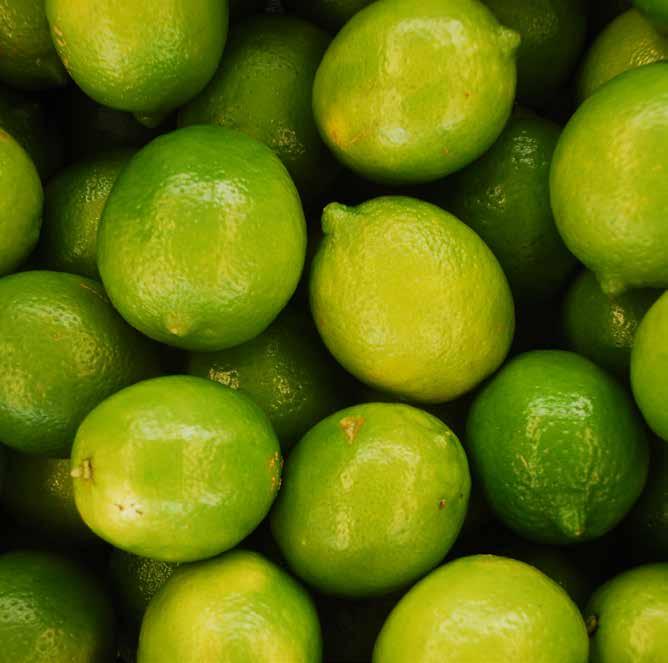

74 Issue Spotlight: Livelihoods 74 Issue Spotlight: Livelihoods

75 The challenges faced by farmers and agricultural workers in developing countries can be daunting: smallholder farmers often struggle to cover their basic needs and save for the future, while farm workers are often paid far below a living wage, live in deplorable housing and are denied basic labor rights such as overtime pay and the right to organize. Farmers, farm workers and their families are placed at risk if they apply agrochemicals without adequate safety gear or store agrochemicals in inappropriate places such as their living quarters. In the worst cases, farms engage in forced labor or children are compelled to conduct dangerous and exhausting farm work, risking their health while denying them the opportunity to succeed in school. Issue Spotlight: Livelihoods The SAN Standard addresses all of these concerns and more. To achieve certification, farms must comply with several critical criteria related to livelihoods and human well-being, including paying all workers the legal minimum wage or regional average wage, whichever is greater (Criterion 5.5); avoiding employment discrimination (Criterion 5.2) and employment of minors under 15 years of age (criterion 5.8); avoiding use of the most toxic agrochemicals (Criterion 8.4); and requiring all farmers and workers to take safety precautions when using chemicals that are permitted (Criterion 6.13). Several other non-critical criteria also support improved livelihoods for farmers, workers and their families. For smallholders, a key mechanism to support improved livelihoods is to increase the productivity and profitability of farming certified crops. The SAN Standard promotes this outcome by specifying the use of best agronomic practices, an approach that is supported and reinforced through training programs implemented through the work of SAN members and many other partners. The evidence summarized in this section suggests that Rainforest Alliance Certified farms have adopted the practices described above at a higher rate than non-certified farms. In the cases where researchers have dug deeper to examine the outcomes of these practices, the available evidence suggests that these practices have led to higher productivity, improved wages and rights for farm workers and better health and education for farmers, farm workers, and their families. At the same time, as highlighted in the crop spotlights, audit data reveal that further improvement is still needed with respect to some key social welfare and safety issues. These insights are part of the reason why the SAN has instituted additional critical criteria related to agrochemical safety, worker housing and access to potable water as of December 215 (see Sidebar, page 22). A teacher works with schoolchildren at a Craigmore tea plantation in Tamil Nadu, India. All children of tea workers on the plantation receive free schooling. SAN/Rainforest Alliance Impacts Report 75

76 Worker housing on the Fazenda Itaoca coffee farm in Brazil. Wages and Rights of Farm Workers Two independent studies have examined the wages and rights of hired workers on Rainforest Alliance Certified farms. The first, a study of tea farms in India s Tamil Nadu state, found that the annual incomes of workers on certified farms were significantly higher than those on non-certified farms, based on the researchers estimates. 57 The hourly rate of pay for overtime was also significantly higher on the certified farms, while significantly more workers on certified farms had contracts and were entitled to annual paid leave, sick leave and maternity leave. No significant differences were found between certified and non-certified farms for several other worker wage or benefit variables, such as number of working hours per day or trade union membership. The same study found that workers on Rainforest Alliance Certified estates were significantly more satisfied with their housing than workers on non-certified estates, that a larger proportion of certified estate workers children attended school, and that those workers were also more satisfied with the schooling than workers on non-certified estates. Health and Education Central to the SAN Standard and the work of SAN members is the premise that agricultural work should not cause sickness or injury to farmers, workers, or their family members, nor should it prevent the children of farm families from attending school. 57 Lalitha et al Hughell & Newsom Haggar et al. 212 Putting the knowledge and equipment in place for the judicious and safe use of agrochemicals is one means toward this goal. In Colombia, researchers found that SAN/Rainforest Alliance coffee certification was associated with a significantly higher proportion of farm workers storing agrochemicals safely, using protective equipment while working with chemicals and receiving training in first aid and the correct use of pesticides, compared to workers on comparable non-certified farms. 58 In Nicaragua, certified coffee farmers also applied agrochemicals less frequently, and used less toxic chemicals Issue Spotlight: Livelihoods
")
77 Research on agrochemical practice adoption on tea farms has revealed similar results. Compared with non-certified farms, a significantly higher percentage of workers on Rainforest Alliance Certified tea farms wore protective equipment while applying agrochemicals (in Kenya and India) 6 and received safety training (in Kenya). 61 Certified farms were also significantly more likely to create no-pesticide buffer zones around the factory, houses, schools, forests and water bodies (in India). 62 On cocoa farms in Ghana, workers on certified operations applied safe agrochemical storage practices and used protective equipment while applying agrochemicals at substantially higher rates than workers on non-certified operations, with the use of protective equipment in excess of 95 percent on certified farms. 63 Whether or not these improved practices lead to measurable improvements in worker health is an important topic for future research. In the meantime, the available evidence suggests that farmers themselves feel that these practices do make a positive difference. In Kenya, tea farmers who received training on best practices in the SAN Standard reported fewer ailments, which they attributed to the safer use of agrochemicals. 64 In a separate study in Kenya, focus groups with certified tea farmers associated certification with improved human and environmental health. 65 Evidence from Indian tea estates points in the same direction. Two managers of Rainforest Alliance Certified tea estates reported that the number of person-days lost to sickness had been reduced due to certification. 66 In the same study, a significantly larger proportion of workers on certified estates than on non-certified estates reported experiencing positive changes in occupational health. One worker on a Rainforest Alliance Certified tea farm in India spoke about the farm conditions before certification and how they have improved since the farm became certified. He says, We didn t use all of the protective gear, and spraying used to be very troublesome. Our eyes used to burn, which prevented us from closing them and sleeping at night. We experienced a loss of appetite, stomach pain and gastric problems. We had to visit the hospital several times, but now we don t. Now we feel better. 67 Regarding the well-being of children, Critical Criterion 5.8 of the SAN Standard prohibits the employment of minors under the age of 15, and restricts the work of those years old. Two additional criteria (5.9 and 5.19) restrict the activities of minors when working on family farms such that farm work does not endanger minors or interfere with their schooling. Two independent studies Irene Atieno is a student at Kericho HQ Primary School on Unilever s Kericho tea estate in Kenya. 6 Waarts et al. 212; Lalitha et al Ochieng et al Lalitha et al Addae-Boadu Waarts et al Stathers et al Lalitha et al Lalitha et al. 213 SAN/Rainforest Alliance Impacts Report 77
78 Figure 29. Coffee production, in kilograms per hectare, for certified and non-certified farms in the Colombian regions of Cundinamarca and Santander. Standard error bars are shown. certified farms Cundinamarca Santander non-certified farms ,2 1,5 suggest that these criteria are contributing to better educational outcomes for children. One study on cocoa farms in Côte d Ivoire found that significantly more children on Rainforest Alliance Certified farms were studying at the appropriate grade level, compared with children on non-certified farms. 68 Research on coffee farms in Colombia found that the children of certified farmers had significantly higher levels of education than those of non-certified farmers, with a median educational achievement that was two years higher than that of non-certified farmers children. 69 Farm Productivity Several studies have documented that Rainforest Alliance Certified farms implement various agronomic and farm management practices generally associated with increased productivity at a higher rate than non-certified farms. For coffee farms, these practices include farm record-keeping and the periodic pruning of coffee bushes 7 ; for cocoa farms, they include pod breaking, fermentation, and the replanting or rejuvenation of old cocoa trees 71 ; for tea farms, they include record-keeping on farm inputs and production, the frequent application of compost, and the frequent plucking of tea leaves. 72 Evidence suggests that these practices do, in fact, lead to increases in productivity. In Colombia, in one of two study regions, farm productivity on Rainforest Alliance Certified coffee farms was twice that of non-certified farms (Figure 29), while net revenue was 2.5 times as high. In the other region, there was no significant difference, a result that the authors suggest may relate to that region s lower soil quality and lower rainfall, which could dampen the beneficial effects of productivity-enhancing agronomic practices. 73 A different study in Colombia found that 49 percent of certified coffee farmers cited increased productivity as the reason they remain in the program. 74 In Peru, a coffee cooperative increased its annual production by 148 kg/hectare after SAN/Rainforest Alliance certification, which led to an additional US $28/hectare in net revenue for certified farmers; the study authors attribute this increase to systematic pruning and appropriate fertilizer use Bennett et al Rueda & Lambin Rueda & Lambin Bennett et al Waarts et al Hughell & Newsom Rueda & Lambin Barham & Weber Deppeler et al Borg & Selmer Krain et al Bennett et al. 212 With regard to cocoa, researchers found that farmers on Rainforest Alliance Certified farms in Ghana achieved significantly higher yields than non-certified farms, while 67 percent of certified farmers indicated that returns from certification were much more than what they invested in the process. 76 In a separate study from Ghana, certified cocoa farmers were found to have improved their productivity, and farms with the highest productivity were those with a long certification history. 77 In Côte d Ivoire, the average productivity on certified cocoa farms was nearly 5 percent higher than on non-certified farms, and all six study cooperatives increased their cocoa quality, improving measures of flavor, color, amount of foreign matter and moisture content. 78 The researchers attributed these differences to farmer training in crop management, tree pruning, raising seedlings in nurseries, agroforestry systems and integrated pest management. Another study in Côte d Ivoire also found evidence of strong farm-level economic benefits for SAN/Rainforest Alliance certification, including significantly higher yields and higher income on certified farms. 79 Sixty-seven percent of the certified farmers in this study also reported that their economic circumstances had improved, while 75 percent of the non-certified farmer group said that their 78 Issue Spotlight: Livelihoods

79 Freshly-harvested cocoa pods on a certified farm in Côte d Ivoire. Researchers found higher productivity, higher quality cocoa, and higher income among certified farms in the country. circumstances had worsened. Research in Ghana and Nigeria found that Rainforest Alliance Certified farms outperformed non-certified farms in measures of profitability, including benefit/cost ratio and internal rate of return. 8 One study in Kenya found that farmers trained in SAN best practices had lower net income than farmers without training. 81 The authors infer that this result may be due to the higher input costs (fertilizer and labor) and to a reduction in tea production area as farmers implemented the SAN Standard criteria on conserving riparian buffers. This result suggests the possibility of trade-offs among some of the different objectives of the SAN/Rainforest Alliance certification system, although it is unclear from the study whether trade-offs associated with higher input costs would persist, or whether these investments would be rewarded with improved productivity over time. In contrast, a different study in Kenya examined tea farmers cash savings and found that certified farmers had saved an additional 9,633 Kenyan Shillings (KES) (about US $95) over the past two years, compared with a loss of 7,317 KES (about US $7) by non-certified farmers. 82 Other research on productivity on tea farms provides conflicting evidence about effects on productivity 83, or no difference between certified and non-certified farms. 84 Price Premiums Unlike productivity increases, price premiums appear to affect the financial situation of smallholder farmers only modestly, if at all. Studies that examined price premiums on coffee farms found them to be variable, averaging 7.4 percent of market price for coffee in Peru 85, 3 percent in Nicaragua 86 and 2 percent in Colombia. 87 No price premium was observed on certified cocoa farms in Côte d Ivoire. 88 In Kenya, no price premiums were observed on tea farms that had received training on the SAN Standard, though focus group discussions revealed that approximately half of the trained farmers who had gone on to achieve SAN/ Rainforest Alliance certification received a price premium or additional bonus due to their certified status. 89 As noted earlier in the Coffee Spotlight, while some farmers may receive less of a price premium than they anticipate, they also tend to realize other (often unanticipated) benefits from participating in certification, such as improved access to training and technical assistance, peer learning networks and a safer farm environment. 9 8 Ghana: Addae-Boadu 214; Nigeria: Oseni & Adams 213. As neither study reported statistical significance, these findings are shared here only as indicative, descriptive results. 81 Waarts et al Stathers et al Waarts et al Stathers et al Barham & Weber Haggar et al Rueda & Lambin Bennett et al Waarts et al Rueda & Lambin 213 SAN/Rainforest Alliance Impacts Report 79


80 Issue Spotlight: Water 8 Issue Spotlight: Water

81 Conventional agricultural practices can degrade water quality, impair aquatic ecosystems and diminish water availability in many different ways. Indiscriminate or excessive use of fertilizers contaminates waterways with nutrient-rich runoff, which can lead to algal blooms, poor water quality and deterioration of aquatic habitat for native species. Toxic pesticides can also enter waterways and threaten human and environmental health if applied in excess quantity, or in the wrong manner, place or time. Soil erosion and sedimentation is another major impact of agriculture, and tends to be exacerbated by planting on steep slopes, maintaining insufficient ground cover or planting too close to the edge of rivers or streams. Sedimentation also impairs water quality, and can negatively affect downstream infrastructure such as urban water supplies and hydroelectric dams. The release of domestic or industrial wastewater from farms or processing facilities can also have devastating impacts on water quality. Finally, the excessive use of irrigation can contribute to the depletion of aquifers, the reduction of flows in nearby waterways and water stress for downstream water uses. These impacts are exacerbated by inefficient irrigation systems and practices, which are common worldwide. Issue Spotlight: Water Ivan Vega stands with his son in the protected stream that runs through his certified coffee farm in Colombia. The SAN Standard includes numerous provisions to reduce the impacts of farming on water quality and quantity. For instance, critical criteria forbid the use of any pesticide that is on the SAN List of Prohibited Pesticides or is locally banned (Criterion 8.4) and require that discharged wastewater complies with legal requirements or, in their absence, specified SAN parameters (Criterion 4.5). Other criteria address topics such as the maintenance of protective buffer zones along rivers and other water bodies (Criterion 2.6), rational use of organic or inorganic fertilizers based on soil analysis (Criterion 9.2) and maintenance of irrigation systems in good working order to avoid waste or leakage (Criterion 4.3). Water Stewardship Index To quantify the performance of Rainforest Alliance Certified farms in the area of water stewardship, we created an index based on 26 criteria of the SAN Standard most relevant to water conservation and water quality protection (see page SAN/Rainforest Alliance Impacts Report 81
82 Water Stewardship Index Criteria of the SAN Standard included in the water stewardship index. Each criterion is characterized here based on the aspect(s) of water stewardship that it addresses. asterisk (*) denotes Critical Criteria SAN criteria Reduce water pollution from sediment, fertilizers, and toxic materials Optimize water use and reduce its potential impacts Protect aquatic ecosystems and their buffers * 2..2* * * * Evaluate impacts of new farm activities Service providers comply with Standard Protect/restore all natural ecosystems No natural ecosystem destruction Buffers along water bodies Agroforestry shade cover Water conservation program Permits for water use Irrigation monitoring and efficient use Wastewater treatment systems No illegal wastewater discharge Water quality monitoring for discharge No solid waste in water bodies Septic tanks suitably installed and operated Water quality monitoring Safe storage areas for harmful substances Location of agrochemical and fuel storage areas Integrated pest management Agrochemical rotation and reduction Fire use restricted for pest management Soil erosion control Soil/crop fertilization program Vegetative ground cover New production plots only in suitable areas Integrated waste management program Safe waste deposit areas 82 Issue Spotlight: Water

83 82). We then used audit report data to quantify this index at the time of the initial audit (211 or later) and at the time of the most recent audit (up to 214) for 53 tea certificates in East Africa, 68 coffee certificates in Central America, 72 cocoa certificates in West Africa, and 26 banana certificates in Central America. 91 The difference between the index scores at these two time periods indicates the level of overall change in water-friendly practices on certified farms. A nursery worker waters young tea plants on the James Finlay tea estate in Kenya. Initial overall average compliance with water stewardship criteria ranged from 77.5 percent for cocoa producers (in West Africa) to 84.3 percent for banana producers (in Central America). By the time of the most recent audit, the index score had increased by about four points for producers of all crops (Table 1). On tea farms in East Africa, conformance to the two criteria addressing the safe storage of agrochemicals and fuels had the highest rates of improvement, with increases of 25 percent between the initial and most recent audits. Tea farmers also made good progress in ensuring that service providers are compliant with the SAN Standard. Practices for which new non-conformities meant that 91 For more information on the methodology, please see Annex C. Crop (region) Banana (Central America) Cocoa (West Africa) Mean water stewardship index at initial audit Mean water stewardship index at most recent audit Table 1. Average water stewardship index scores at the time of the initial audit (211 or later) and the time of the most recent audit (up to 214) for bananas in Central America (n=26), coffee in Central America (n=68), cocoa in West Africa (n=72) and tea in East Africa (n=53). Coffee (Central America) Tea (East Africa) SAN/Rainforest Alliance Impacts Report 83

84 conformance rates at the most recent audit were slightly lower than at the initial audit included creating a waste management plan, instituting a water conservation program, maintaining best-practice wastewater treatment infrastructure and monitoring irrigation use. Between their initial and most recent audits, cocoa producers in West Africa also made major improvements in the criteria related to the safe use of agrochemicals. In addition, gains were made in conformance to criteria related to soil management, such as the use of soil analyses to guide the application of fertilizers. Improvements were also seen in criteria related to waste management plans and the proper use of septic tanks. Conformance to the wastewater treatment criterion decreased over time, though all farms were in conformance with the legal wastewater discharge criterion at all points during the audit cycle. Certified coffee producers in Central America made the greatest improvements in criteria related to the creation of buffers along water bodies, with one-half of farms in conformance at the initial audit, and nearly 9 percent in conformance by the most recent audit. Improvements in wastewater treatment infrastructure were next highest, with conformance to SAN Standard parameters increasing from 52 percent to 76 percent by the most recent audit. With the exception of criteria related to soil erosion prevention and vegetative ground cover, which saw slight decreases in conformance rates over time, farmers improved performance for all criteria that were included in the water index. Forested buffer zones along a stream on the Hacienda Miramonte coffee farm in Costa Rica. At their initial audits, over 6 percent of banana producers did not conform to SAN requirements for wastewater treatment infrastructure and water quality monitoring specified in Criteria 4.4, 4.6 and 4.9. By the most recent audit, however, conformance to these criteria had increased markedly, with 1 percent of farms conforming to monitoring requirements and 92 percent meeting the wastewater treatment infrastructure requirements. Other areas with strong improvement include the use of vegetative ground cover and the inventory and reduction of agrochemical use. More improvement is needed in the areas of waste management, the creation of buffer zones between crops and aquatic areas, and ensuring that service providers are compliant with the standard; conformance to all of these criteria decreased over time due to new non-conformities. Water-Related Results in Published Studies At least seven published studies have evaluated the effects of SAN/Rainforest Alliance certification on water-related outcomes, based on empirical research comparing certified and non-certified farms. These studies have focused primarily on erosion control, agrochemical reduction and wastewater treatment practices. One study also examined outcome-level results related to water quality and aquatic invertebrates. Here, we summarize results of this research. 92 Ochieng et al Addae-Boadu Hughell & Newsom Rueda & Lambin Haggar et al Bennett et al. 212 In several studies, Rainforest Alliance Certified farms were found to be implementing erosion-control measures at a higher rate than non-certified farms. These measures included the maintenance of protective buffer strips along water bodies on tea farms in Kenya 92 and cocoa farms in Ghana. 93 Certified coffee farms in Colombia had a significantly higher percentage of streambank vegetation than non-certified farms, 94 and were more likely to protect water sources through fencing and reforestation. 95 A study of coffee farms in Nicaragua found that large farms with SAN/Rainforest Alliance certification were associated with better treatment of water contamination and implementation of water conservation measures, while large-scale uncertified farms were associated with erosion around water sources. 96 A study in Côte d Ivoire 97 characterized cocoa farmers use of various conservation measures to increase water infiltration and prevent soil erosion. Overall, 42 percent of Rainforest Alliance Certified farms employed one or more such conservation measures, compared with just 4 percent of non-certified farmers. 84 Issue Spotlight: Water

85 A river carrying a heavy sediment load empties into the ocean on the Costa Rican coast. Farming techniques used on SAN/Rainforest Alliance Certified farms can greatly reduce soil erosion and keep waterways clear. These researchers also directly evaluated erosion levels by quantifying visual signs of erosion such as rills (small channels in the soil), gullies and the accumulation of soil downslope on the streambanks of certified and non-certified cocoa farms. On a scale of to 3, with indicating no signs of erosion and 3 indicating severe erosion, on average non-certified farms scored.97 and certified farms scored.21. Two independent studies have evaluated agrochemical use on Rainforest Alliance Certified farms versus non-certified farms, with both concluding that certification supported the more judicious and less risky use of chemicals. In Kenya, the percentage of tea farmers who avoided spraying agrochemicals within 15 meters of water bodies increased significantly after training on the best practices outlined in the SAN Standard. 98 On coffee farms in Nicaragua, researchers strongly associated the reduced use of agrochemicals with SAN/Rainforest Alliance certification, compared to the control group of non-certified farms. 99 They also found that certified farms had a much lower index of agrochemical risk (a product of chemical toxicity and frequency of use) than control farms. It is likely that the reduced use of agrochemicals observed in these studies is due, at least in part, to the increased use of alternative methods to control pests. For example, in Colombia Rainforest Alliance Certified coffee farms adopted significantly more integrated pest management strategies to control leaf rust and berry borer infestation than non-certified farms. 1 Moreover, the increased density and diversity of tree cover and natural ecosystem patches on certified 98 Waarts et al Haggar et al Rueda & Lambin 213 SAN/Rainforest Alliance Impacts Report 85


86 Encouraging Water-Friendly Coffee Farming and Processing in Rwanda The rolling hills of southwestern Rwanda are home to the roughly 1,3 coffee farmers who belong to the Maraba coffee cooperative and the 9 farmers who supply coffee cherries to BufCoffee Ltd, a private company. On their small plots of land typically less than one hectare in size these farmers grow coffee as a cash crop in addition to banana, beans, cassava and other food for their families. During the coffee processing season of March to June, farmers harvest their coffee cherries and bring them to the nearby Sovu and Remera coffee washing stations, where the coffee cherries are processed and dried in preparation for dry-milling, roasting and export. With support from the Scherman Foundation s Rosin Fund, in 213 the Rainforest Alliance and local partner POSADA launched a new project that aims to improve water quality in this region. First, a wastewater treatment system was built at the Sovu coffee washing station. This system consists of a series of four lagoons that use lime, micro-organisms, plants and gravity to remove the effluent s damaging organic matter, neutralize its low ph and increase depleted dissolved oxygen. Water quality measurements taken by Cecile Mukamurigo, an employee at the Sovu coffee washing station. Neutralization tank, part of the wastewater treatment system at the Sovu coffee washing station. Remera coffee washing station. farms (as documented elsewhere in this report) likely contributes to improved natural pest control and a reduced need for chemical pest control on coffee farms. Research in East Africa has found that shade tree cover reduces coffee berry borer impact, 11 and experiments in Costa Rica found that the presence of forest cover on coffee farms is associated with a reduction in coffee berry borer infestations by approximately 5 percent, due to increased bird abundance in these forest elements Jaramillo et al Karp et al Rueda & Lambin Rueda & Lambin Hughell & Newsom 213 Two studies in Colombia have examined the effects of certification on stream pollution, eutrophication, and its causes (including fertilizer runoff and processing wastewater). Researchers found that significantly more farmers on Rainforest Alliance Certified farms were using soil analysis to guide decisions about fertilizer application than those on non-certified farms: 23 percent of farmers versus 9 percent, respectively. 13 This practice typically results in a more targeted and conservative use of fertilizers and reduces the leaching of excess nutrients into ground and surface waters. Also in Colombia, certified coffee farms were found to be significantly more likely than non-certified farms to use water-saving technologies while processing coffee, to prevent the release of grease into water bodies by using grease traps in the kitchen, to avoid discharging wastewater into fields 14 and to use septic tanks for treating sewage. 15 All of these practices help reduce the release of excess nutrients and other pollutants into water bodies. Also in Colombia, researchers sought to evaluate the consequence for water quality of these management practices as applied on certified farms. For the majority of stream health variables examined, they found that streams originating on Rainforest Alliance Certified coffee farms had significantly better water qual- 86 Issue Spotlight: Water


87 scientists at the University of Rwanda s Butare campus confirm that the system is working: all measures of water quality including BOD, COD, turbidity and ph improved markedly after the system was built. Servelier Havugimana, the manager of the Sovu washing station, has also noticed a difference. He says, I thank the Rainforest Alliance for the support in constructing the wastewater treatment system. Neighbors no longer complain about the bad smell or about pollution in the stream below the coffee washing station, which is used to irrigate rice and other crops. Work is underway to build a second wastewater treatment system, this one at the Remera washing station. In addition, farmers from Maraba and BufCoffee learned about water-friendly farming practices through a series of multi-day training workshops. Workshops were held in Kinyarwanda, the local language, and covered topics such as the creation of stream-side buffer zones, the use of vegetative cover to prevent erosion, and the collection of rainwater for domestic use. According to Laurent Twagirayezu, a farmer who participated in the program, This was the first time that I used a training manual that I could read myself and understand well, since it is written in my mother tongue, Kinyarwanda. Now I am able to handle chemicals safely and protect the health of my three children, my wife and the neighbors in my village. And since my coffee farm is located on a hillside, I am now applying the soil management practices that I learned, such as planting cover crops, mulching and using trenches to control erosion. These practices should also help me increase productivity. Jean-Marie Irakabaho, local project manager, calibrating the water quality monitoring probe. Servelier Havugimana, Sovu washing station manager, beside parts of the new wastewater treatment system. Farmer Laurent Twagirayezu points to a passage in the farmer training manual. ity than those originating on non-certified farms. (A minority of stream health variables showed no significant difference between certified and non-certified, and in no cases did non-certified farms perform better.) One measure of stream quality was the Stream Visual Assessment Protocol (SVAP), a scoring system that takes into account the condition of the stream channel, vegetation and woody debris, water clarity and other variables. Certified farms had significantly higher SVAP scores, indicating better water quality. Researchers also found that streams originating on certified farms contained significantly more pollution-intolerant invertebrates, which also indicates higher water quality. Finally, certified farms in one of the two regions had significantly higher amounts of dissolved oxygen, lower biochemical oxygen demand (BOD) and lower chemical oxygen demand (COD), all of which indicate higher water quality (no significant difference was observed in the other region studied). Finally, on banana farms in Ecuador, researchers characterized adoption of a variety of water and waste management practices on Rainforest Alliance Certified versus non-certified farms. The certified farms scored much higher than non-certified farms for both the water quality practices (.73 versus.27 on the 1 scale of an index of good practices) and waste management practices (1. versus.33 on a similar 1 scale). All certified banana farms in this study had installed solid and latex filtering and retention systems at processing facilities and established systems for post-harvest treatment of fungicide residuals prior to wastewater discharge. Additionally, all certified farms were managing solid waste to reduce water-related impacts, for instance by utilizing secondary markets for bananas that were not export grade, by returning stalks to the fields to replace soil organic matter and by keeping organic matter out of watercourses Melo & Wolf 25 SAN/Rainforest Alliance Impacts Report 87


88 Issue Spotlight: Biodiversity Conservation 88 Issue Spotlight: Biodiversity Conservation

89 Biodiversity conservation has always been an important focus of the SAN s and Rainforest Alliance s work, and this emphasis is reflected in the SAN Standard, which has been rated as among the most rigorous of the voluntary sustainability standards with regard to environmental protection. 17 In addition to promoting conservation through the SAN Standard, the SAN members and their local partners provide training on biodiversity-related topics for farmers who are preparing for certification or have already achieved certification. For instance, training curricula address the identification and protection of natural ecosystems, sensitization to hunting prohibitions and to the value of wildlife, protection of water bodies, and best practices for managing shade canopies in agroforestry crops to deliver multiple benefits for farm productivity and conservation. 18 Issue Spotlight: Biodiversity Conservation In this section, we review the effects of the SAN/Rainforest Alliance certification system on the adoption of biodiversity-friendly farming practices as well as key outcomes related to natural ecosystems and wildlife. Biodiversity Stewardship Index SAN critical criteria (i.e., criteria that are fully mandatory for all certified farms) require that all natural ecosystems on the farm are conserved, and that high value ecosystems were not destroyed in the recent past. 19 These criteria go far toward ensuring that Rainforest Alliance Certified products are not linked to deforestation. Additionally, Critical Criterion 3.3 helps safeguard endangered species and all wildlife by prohibiting hunting, except for cultural or ethnic groups under limited circumstances. Beyond these critical criteria, the SAN Standard contains seven continuous improvement criteria focused on ecosystem conservation (Principle 2), five continuous improvement criteria focused on wildlife protection (Principle 3) and several other criteria throughout the standard that directly or indirectly address biodiversity conservation. To quantify the performance of Rainforest Alliance Certified farms in the area of biodiversity conservation, we created an index based on 16 criteria of the SAN Standard that are most closely linked to habitat and wildlife conservation outcomes (see page 9). We then used audit report data to assess changes in this index from the time of the initial audit (211 or later) to the time of the most recent audit (up to 214) for 53 tea certificates in East Africa, 68 coffee certificates in Central America, 72 cocoa certificates in West Africa and 26 banana certificates in Central America. 11 Initial overall average compliance with these biodiversity-related criteria ranged from 81.5 percent for cocoa to 93.3 percent for bananas. By the time of the most recent audit, the index score had increased by about two percentage points for banana and tea, increased 5.5 points for coffee and decreased almost one point for cocoa (Table 2). The set of coffee producers evaluated made large improvements in the creation of buffers along water bodies and the protection of wildlife habitat, with a reduction in total non-conformities from 49 percent to 13 percent and from 32 percent to 12 percent, respectively. The proportion of producers conforming to the SAN s agroforestry shade parameters (minimum 4 percent shade canopy cover, 12 native species per hectare and two vertical canopy strata) also increased, to nearly 8 percent by the most recent audit. Other areas of improvement included establishing or maintaining vegetated buffers between areas of chemical use and natural ecosystems; adoption of integrated pest management; and the rotation and reduction of agrochemicals. Non-conformance rates increased for only one of the biodiversity index criteria (maintenance of ecosystem connectivity), and this rise was slight (from 12 percent to 15 percent non-conformance). Most of these were minor non-conformances, indicating that those farms had partially implemented their plan to maintain or restore natural ecosystem connectivity by planting various types of native vegetation. A sloth bear on a tea estate in Tamil Nadu, India. 17 Potts et al Many of these training modules are available for free download at sustainableagriculturetraining.org. 19 Natural ecosystems include all types of ecosystems with a largely natural species composition, structure, and function. These include flowing and still water bodies (streams, rivers, pools, ponds, lakes, lagoons, etc.) and other water bodies (swamps, marshes, bogs, mangroves, etc.); primary and secondary forests, including natural succession stages without significant human disturbance for at least 1 years; and other terrestrial natural ecosystems such as bushlands and grasslands. High value ecosystems are the subset of natural ecosystems of special importance to environmental conservation by virtue of their rarity, their importance for providing ecosystem services, their value to endemic or endangered species populations, or other critical conservation values. 11 For more information on the methodology, please see Annex C. SAN/Rainforest Alliance Impacts Report 89
90 Biodiversity Stewardship Index Criteria of the SAN Standard included in the biodiversity stewardship index. Each criterion is characterized here based on the aspect(s) of biodiversity conservation that it addresses. asterisk (*) denotes Critical Criteria SAN criteria Increase conservation value on the farm Increase conservation value in the broader landscape Minimize negative impacts on terrestrial and aquatic biodiversity 2.1* 2.2* * * Protect/restore all natural ecosystems No natural ecosystem destruction No harm to nearby protected areas No harvest of threatened plants Buffers between chemical use and natural areas Buffers along water bodies Agroforestry shade cover Maintain ecosystem connectivity Protect wildlife habitat No hunting Farms support local community and economy Support environmental education and research Integrated pest management Agrochemical rotation and reduction Promote use of fallow areas New production plots only in suitable areas For the majority of biodiversity-related criteria, all of the banana farms in Central America conformed fully from the first audit onwards. Two areas with lower conformance at the initial audit support for environmental education and research (65 percent initial conformance) and agrochemical rotation and reduction (77 percent initial conformance) both saw large improvements, with all initial non-conformities eliminated by the most recent audit and only one new non-conformity related to agrochemical rotation and reduction. Implementation of a plan to maintain or restore ecosystem connectivity, a third area with comparatively lower conformance at the initial audit (77 percent initial conformance), improved only slightly (to 81 percent). Tea producers in East Africa also performed well at the initial audit: for 12 of the 16 biodiversity-related criteria, either zero or only one of the 53 evaluated producers were out of conformance at the initial audit, and conformance remained high for all of these criteria by the time of the final audit. The proportion of producers maintaining vegetated buffers between chemical use and natural ecosystems increased from 79 percent to 98 percent during the study period. Two criteria proved more difficult for producers to attain substantial progress: 9 Issue Spotlight: Biodiversity Conservation
 and the time of the most recent audit (up to 214) for bananas in Central America (n=26), coffee in")
91 Crop (region) Banana (Central America) Cocoa (West Africa) Mean biodiversity stewardship index at initial audit Mean biodiversity stewardship index at most recent audit Table 2. Average biodiversity stewardship index scores at the time of the initial audit (211 or later) and the time of the most recent audit (up to 214) for bananas in Central America (n=26), coffee in Central America (n=68), cocoa in West Africa (n=72) and tea in East Africa (n=53). Coffee (Central America) Tea (East Africa) maintaining buffers along water bodies (non-conformance rates remained steady at 28 percent) and agrochemical rotation and reduction (non-conformance rates dropped from 6 percent only to 57 percent). The former of these is inherently a challenge for tea smallholders in Kenya, many of whom manage plots well under a hectare in size and who feel they cannot afford to take rows of tea bushes out of production to accommodate the specified riparian buffer widths. Overall, performance of cocoa producers in West Africa remained about steady with respect to the biodiversity-related criteria. While there were improvements in a few criteria and slippage in a few others, generally these changes did not amount to more than about a 1 percent change in either direction. Criteria that continued to register at least 2 percent non-conformance by the final audit included maintaining buffers between chemical use and natural areas (28 percent non-conformance), maintaining buffers along water bodies (24 percent), conforming to the SAN s agroforestry shade parameters (97 percent), A vervet monkey at the Unilever Monkey Sanctuary, located on the company s Kericho tea estate in Kenya. SAN/Rainforest Alliance Impacts Report 91

92 implementing a plan to maintain or restore ecosystem connectivity (24 percent), applying integrated pest management (64 percent) and rotating and reducing use of agrochemicals (38 percent). The lack of apparent progress in these criteria may partially reflect the continual influx of members into many of the certified groups members who often start at a lower performance level. Many of these criteria are also challenging for smallholders to implement because they may require the set-aside of land that farmers are unable to spare (e.g., for vegetated buffers) or access to knowledge or techniques that they have not yet gained or adopted (e.g., for agrochemical rotation and integrated pest management). And, as discussed in the cocoa spotlight section, managing cocoa plots according to the SAN agroforestry shade parameters may be inconsistent with agronomic advice that farmers received from others, or at odds with local policy incentives related to trees on farms. Biodiversity-Related Results in Published Studies The wildlife-friendly practices discussed above have been extensively documented in other scientific literature to increase the quantity and quality of wildlife habitat in agricultural landscapes, and to help sustain populations of native species. These linkages between the adoption of conservation-friendly practices and key biodiversity outcomes have also been evaluated specifically in the context of SAN/Rainforest Alliance coffee certification through several studies. This body of literature has yielded important conclusions in several topic areas: Deforestation rates: In Ethiopia, researchers found that SAN/Rainforest Alliance certification had a beneficial effect on forest protection, decreasing the probability that natural forests producing shade-grown coffee would be deforested, relative to nearby non-certified and non-coffee producing forests. 111 Increased shade cover provides habitat and ecological connectivity for species like this oriole blackbird, found on a coffee farm in Colombia. 111 Takahashi & Todo Hardt et al Rueda et al Komar 212 Landscape connectivity: Evidence from Brazil and Colombia suggests that SAN criteria related to conserving the connectivity of natural ecosystems, protecting or restoring riparian buffers, and maintaining a diverse shade canopy are actually resulting in habitat restoration and increased habitat connectivity at a landscape level. In Brazil, researchers used a time series of remote sensing images to compare changes in landscape composition and connectivity on and around certified versus non-certified coffee farms. Results suggested that, relative to surrounding areas, certified farms provide greater deforestation control, increased habitat availability, and greater habitat connectivity (based on modeling of habitat requirements for two terrestrial mammal species). 112 In Colombia, researchers also documented contributions of shade cover on Rainforest Alliance Certified farms to increased tree cover and ecological connectivity detectable at a landscape level, as discussed further in the Coffee Spotlight. 113 Bird diversity and survivorship: In El Salvador, where shade-grown coffee provides among the last forest-like refuges within largely deforested landscapes, research examined bird diversity, movement, and survivorship on Rainforest Alliance Certified farms producing shade-grown coffee versus nearby non-certified, full-sun coffee plantations. Migratory birds captured on certified farms demonstrated higher rates of survivorship and fidelity to the sites they visited than birds captured on non-certified farms. Forest fragments retained on certified farms, consistent with SAN requirements, were also inferred to play an important role in bird conservation, as forestmigratory birds on certified farms demonstrated higher levels of fitness than birds captured on nearby non-certified farms. Survival of resident (i.e., non-migratory) bird species did not differ between certified and non-certified farms. 114 Biodiversity outcomes related to increased tree species diversity and aquatic ecosystem health are discussed in the Coffee Spotlight section. 92 Issue Spotlight: Biodiversity Conservation


93 Farmers Make the Case for Restoring Natural Ecosystems Banana plants were removed to restore native vegetation to portions of the Nogal reserve. An important tenet of the SAN Standard is to farm only in places where the land is suitable for productive agriculture, while maintaining or restoring natural ecosystems in sites that are less productive or more prone to hazards such as flooding and erosion. Doing so can help reduce economic risk and improve overall farm management, while at the same time benefiting biodiversity and local communities. This case example illustrates how a SAN/Rainforest Alliance certified producer is helping to put these principles into action. Lying near Costa Rica s Sucio river, the 12-hectare Nogal Wildlife Refuge is a forest habitat conserved for flood protection and providing a series of natural corridors that link adjacent forest patches and riparian areas. But it didn t start out that way. The land that is now the reserve used to include a mix of degraded forest patches and farm plots. Some of these farm plots were relatively low-productivity, and the owners decided that their value was greater for wildlife habitat than for agriculture. Beginning in 25, through a partnership between Chiquita and the Swiss retailer Migros, parts of the reserve and connecting corridors (including former agricultural lands) were actively reforested with over sixty native tree species. Other partners later joined the restoration efforts, including the German international development agency GIZ and the food procurement firm IPL. Now, after just ten years, monitoring data are revealing just how important this restored natural ecosystem is for protecting rare species and providing habitat for a diverse array of plants and animals. The numbers of howler and whitefaced capuchin monkeys have increased, and troops of endangered spider monkeys are now seen moving through the corridor. A hundred species of fruit-eating butterflies have been observed, including one that had not been recorded on the Caribbean side of Costa Rica for over a century. And, of the 1,429 species that have been observed in the forest corridor, 51 are rare or threatened enough to be under formal protection. In addition to its wildlife conservation goals, the reserve also promotes environmental awareness in local communities. More than 3, schoolchildren and adults have participated in the refuge s environmental education programs. The success of the Nogal reserve illustrates how targeted restoration activities, as promoted by the SAN Standard, can help sustain functional habitat in agricultural landscapes, benefiting wildlife and local communities alike. Several local landowners contributed to establishing contiguous habitat areas. The neighboring Leon family restored almost five hectares (shown here shortly after planting) to connect forest patches in the Nogal corridor. An ocelot (photographed here with a wildlife camera trap ) walks through the Leon reforestation corridor, planted in The Nogal reserve helps support environmental awareness and stewardship in local communities through a variety of education and community development activities. Here, local children are dressed to perform an environmental theater written by Nogal staff member Mayela Atencio. SAN/Rainforest Alliance Impacts Report 93


94 Issue Spotlight: Climate-Smart Agriculture 94 Issue Spotlight: Climate-Smart Agriculture

95 Many farmers around the world are already experiencing the effects of climate change: increased frequency of extreme weather events, droughts, altered growing seasons and pest outbreaks. These changes are destabilizing many farming communities and compromising the ability of farmers to provide decent agriculture-based livelihoods for themselves and their families. For example, coffee rust a destructive fungus that attacks coffee plants is wreaking havoc on farms in several regions of Guatemala and Honduras, a crisis exacerbated by climate change. Similarly, the coffee berry borer, a tiny beetle that renders coffee cherries unharvestable, has expanded its range due to rising temperatures. 115 At the same time, farming is also a major contributor of the greenhouse gases (GHGs) that cause climate change: agriculture and its associated land-use change contribute up to 25 percent of all global GHG emissions, principally from deforestation, use of fertilizers and livestock methane emissions. 116 Issue Spotlight: Climate-Smart Agriculture To address these challenges, the SAN and Rainforest Alliance promote the adoption of climate-smart agriculture (CSA) through provisions of the SAN Standard and the work of several SAN members. According to the UN Food and Agriculture Organization (FAO), CSA is an approach to achieving sustainable agricultural development under climate change by: sustainably increasing agricultural productivity and income; adapting and building resilience to climate change; and reducing and/or removing greenhouse gases emissions, where possible At the field level, CSA involves a bundle of strategies and a holistic approach to agriculture that increases the capacity of the farm and the farmer to sustain productive agriculture under a range of environmental conditions an outcome referred to as climate change adaptation or increased climate resilience. These strategies may include: increasing the water-storage capacity of soils through the use of ground covers, composting, and other techniques; adopting drought- or pest-resistant crop varieties; adjusting planting or harvest cycles in response to changing climate patterns; increasing the diversity of crops and plants on the farm to mitigate the risk of catastrophic crop loss; and providing better training and fostering peer-learning networks to increase farmers knowledge of climate-smart practices and adaptation strategies. Additionally, CSA involves taking steps to reduce GHG emissions and increase the storage of carbon in plants and soil especially when these practices also support farm productivity and livelihood stability. For instance, planting of fruit and timber trees, and restoration of steep slopes and streamsides with natural vegetation, can provide triple benefits for farm productivity, livelihood diversification and carbon storage. A Vietnamese coffee farmer gathers fallen leaves, trimmed branches, and other organic waste for composting. The use of compost can increase soil s water storage capacity, making it more drought-resilient. In this section, we assess the extent to which Rainforest Alliance Certified farms are applying a CSA approach and progressively increasing adoption of CSA over time by evaluating farm practices and management systems through the lens of a CSA index. Climate-Smart Agriculture Index To quantify the extent to which farmers on Rainforest Alliance Certified farms have adopted climate-smart practices, a climate-smart agriculture index (CSA index) was developed to quantify changes in adoption from the time of the initial certification audit (211 or later) to the most recent audit (up to 214). This analysis focuses on the same four crops and geographies featured earlier in this report (bananas in Central America, coffee in Central America, cocoa in West Africa and tea in East Africa). The index consists of 31 criteria in the SAN Standard prescribing practices or management systems that can promote climate 115 Magrach & Ghazoul IPCC 214 SAN/Rainforest Alliance Impacts Report 95
96 Climate-Smart Agriculture Index Criteria of the SAN Standard included in the climate-smart agriculture index. Each criterion promotes climate change adaptation/resilience and/or climate change mitigation. asterisk (*) denotes Critical Criteria SAN criteria Climate change adaptation and resilience Climate change mitigation * 2.2* Social and environmental management system Plans and policies to comply with Standard Evaluate impacts of new farm activities Service providers comply with Standard Training and education program Energy efficiency plan Protect/restore all natural ecosystems No natural ecosystem destruction No harm to nearby protected areas Buffers between chemical use and natural areas Buffers along water bodies Buffers between crops and areas of human activity Agroforestry shade cover Maintain ecosystem connectivity Protect of wildlife habitat Water conservation program Irrigation monitoring and efficient use Wastewater treatment systems Access to education Educational program about certification Emergency response plan Protect workers from extreme weather Farms support local community and economy Integrated pest management Fire use restricted for pest management Soil erosion control Soil/crop fertilization program 96 Issue Spotlight: Climate-Smart Agriculture
97 SAN criteria Climate change adaptation and resilience CSA Index cont d Climate change mitigation * 1.6 Vegetative ground cover Promote use of fallow areas New production plots only in suitable areas Decrease net greenhouse gas emissions change adaptation/resilience (i.e., helping producers better manage their farm in the face of climate change) and/or climate change mitigation (i.e., reducing GHG emissions and increasing carbon storage). Several criteria contribute to both outcomes (page 96). 117 The index score is calculated as the percentage of the 31 criteria in the index with which each certified operation fully complies. We calculated the index score for each certificate the time of the first audit and the most recent audit, then averaged these scores across all certificates in each crop/geography grouping. Average CSA index scores at the time of the initial audit ranged from 78.6 percent in coffee (in Central America) to 88.6 percent in tea (in East Africa). These scores increased most substantially for coffee producers (by an average of 6.5 points), moderately for bananas and tea (by an average of points) and barely at all for cocoa producers. By the time of the most recent audit, tea and banana producers both achieved, on average, greater than 9 percent conformance with climate-smart SAN criteria (Table 3). Among certified coffee producers in Central America, the greatest improvements in adoption of CSA practices were associated with protecting and increasing on-farm vegetation (e.g., along water bodies, in shade agroforestry canopies, and as hedgerows or other features separating crop plots from areas of human activity); improving water use efficiency and wastewater treatment systems; and instituting education programs for farmers and workers about sustainable 117 The selection of SAN Standard criteria for inclusion in the CSA index is based on the authors judgment of which criteria are most likely to support climate change adaptation and/or mitigation. This judgment is guided by the current literature on farm-level CSA practices, such as the FAO s 213 Climate-Smart Agriculture Sourcebook. Climate-Smart Agriculture in Practice The UN Food and Agriculture Organization s definition of climate-smart agriculture includes a triple focus on sustainable productivity, climate change adaptation and climate change mitigation. An example from Ghana shows how the application of the SAN Standard coupled with CSA training and landscape conservation can put this concept into practice, yielding win-win outcomes for producers and for the climate. In Ghana, cocoa production is a leading cause of deforestation, while cocoa farmers are also experiencing negative effects of changing weather patterns, including a longer dry season. In this context, the Rainforest Alliance teamed up with cocoa trader Olam International to help farmers in Ghana s Juabeso-Bia region to adapt to climate change and enhance productivity while increasing on-farm carbon storage and reducing GHG emissions. Farmers were trained in a range of skills and practices to better manage risk, boost productivity, increase on-farm tree cover, and build resilience. Concurrently, improved land-use monitoring and education focused on reducing incursion into nearby protected areas and their biodiversity-rich forests. Working with a dedicated company partner in the context of an international value chain has facilitated rapid scale-up of CSA practices and outcomes. The project delivered training to more than 2, farmers in 36 communities, leading to 6, hectares of Rainforest Alliance Certified farmland within the 27, hectare landscape. More than 2, shade-tree seedlings were planted, which, together with other climate-smart practices, are expected to sequester an estimated 14, tons of CO₂-equivalent over a 2-year period. Work has begun to validate these net emission reductions against the Climate, Community & Biodiversity Standards, with the aim of ultimately generating carbon credits, which can provide local communities with an additional incentive to conserve and restore diverse vegetation on their farms. SAN/Rainforest Alliance Impacts Report 97
98 Table 3. Average climate-smart agriculture (CSA) index scores at the time of the initial audit (211 or later) and the time of the most recent audit (up to 214) for bananas in Central America (n=26), coffee in Central America (n=68), cocoa in West Africa (n=72) and tea in East Africa (n=53). Crop (region) Banana (Central America) Cocoa (West Africa) Coffee (Central America) Mean CSA index at initial audit Mean CSA index at most recent audit Tea (East Africa) production systems. Conformance with provisions related to integrated pest management, erosion control, and crop fertilization were generally high (>75 percent) but showed little improvement from the initial audit to the most recent audit. These results indicate that coffee producers are taking important steps to guard against the effects of climate change, but further investment is still needed for a minority of producers to institute key practices related to water, soil and pest management. Certified tea producers in East Africa registered the highest CSA index scores at both the initial and the most recent audit. Nearly all operations took steps to protect natural ecosystems, maintain ecosystem connectivity and address soil health through erosion control, fertilization, and ground protection measures. Additionally, about 9 percent of operations had taken steps to reduce GHG emissions. On the other hand, several operations registered new non-conformities related to water conservation and wastewater treatment systems following the initial audit. About one-quarter of operations remained out of conformance with Criterion 2.6, addressing riparian buffers, due in part to the inability of smallholders to take significant land out of production for streambank restoration. These gaps highlight priority foci for future work. For certified cocoa farms in West Africa, the greatest progress toward CSA came in the area of improved crop fertilization and soil health, followed by the development of emergency response plans. Practices that continue to have relatively low adoption include the use of integrated pest management, buffers between crops and areas of human activity, and adherence to the SAN s shade canopy cover parameters. As noted in the cocoa spotlight, adoption of sustainable practices by smallholders can be an incremental process; these results suggest that further investment is needed to support this trajectory. Certified banana farms in Central America were, by the time of the most recent audit, fully compliant in the establishment of social and environmental management systems, worker training programs, and plans and measures to protect against extreme weather and other emergencies. Nearly all operations also conformed to criteria related to ground cover, soil and crop fertilization, and protection of wildlife habitat. With the inclusion of at least 31 CSA-related practices (see page 96), the SAN Standard provides a structured mechanism for defining and codifying CSA in the context of tropical and sub-tropical agriculture. Most of these 31 practices are defined in the SAN Standard in a general enough way that they are broadly applicable to different biomes and cropping systems, and can be adapted and implemented in context-appropriate ways. The analysis here indicates that farmers who have achieved certification adopt roughly between 8 percent and 9 percent of the CSA practices in the Standard, and that this percentage generally increases modestly after a few years in the certification program. The analysis also highlights key areas for further investment, and for increased focus in the new SAN Standard, to further improve the uptake of key CSA practices. 98 Issue Spotlight: Climate-Smart Agriculture


99 Farm Profile: Hondupalma Cooperative in Honduras Hondupalma is a 3-member oil palm farming cooperative located in northern Honduras. On its 9,5 hectares, Hondupalma produces 6 tons of fresh oil palm fruit per day, which it processes in its own plant. The resulting palm oils and fats are consumed in Honduras, Mexico, the United States, Guatemala, El Salvador, Panama and the Dominican Republic. In 213, Hondupalma achieved SAN/Rainforest Alliance certification, but according to Alex Osorio, who is in charge of the cooperative s management system, the road to certification was not easy and required a huge investment. With support from the local NGO ICADE. Hondupalma made a series of changes to come into compliance with the SAN Standard: it halted expansion of plantations, made an inventory of wildlife species on the farm, and monitored water quality in the streams passing through the cooperative s lands. In addition, the cooperative improved conditions for its workers by ensuring that wages, housing, education for workers children and access to healthcare all met the SAN Standard and Honduran laws. Hondupalma has also considerably reduced the use of agrochemicals by applying an effective and inexpensive alternative pest control method to fight the palm weevil (Rhynchophorus palmarum), an insect that attacks the trunk of the palm tree. The method involves attaching pheromone traps, which include small containers of molasses, to the palm trunks. The palm weevil is naturally attracted by the molasses, enters the container to eat it, becomes trapped inside and dies. Harvester cutting oil palm fresh fruit bunches. But were all of these changes worth the effort? The SAN Standard required the cooperative to review its operations and seek efficiencies that benefit the environment as well as the bottom line. According to Osorio, the cooperative has increased its productivity and is now using its plantation wastes to produce bio-gas, which fuels the processing plant. He says, We have learned to be careful and very efficient in our use of all resources. Guided in part by the SAN Standard s integrated pest management requirement, Hondupalma cooperative members have reduced pesticide use, instead controlling palm weevils (Rhynchophorus palmarum) with non-toxic pheromone traps, pictured here. Palm bunches are collected in the field and transported to the Hondupalma processing plant. Palm oil produced by Hondupalma. SAN/Rainforest Alliance Impacts Report 99

100 Conclusion: Looking Forward This impacts report has addressed the question of whether the SAN/Rainforest Alliance certification system has delivered the results specified in the Theory of Change. Based on the available evidence, the overall answer to this question is yes. Specifically: Certified land area, production volume and sales increased dramatically in the period, creating the enabling conditions for field-level outcomes and market transformation at significant scale. Evidence from ten published studies indicates that certified farms generally adopt more sustainable practices than non-certified farms. Audit data from 219 certificates confirm that adoption of sustainable practices generally increases over time as operations remain certified. A worker sifts coffee cherries on Fazenda Recanto, a certified farm in Brazil. Numerous published studies document improvements in the four key outcome areas specified in the Theory of Change: conserving biodiversity, safeguarding natural resources, increasing farm productivity and profitability and improving the lives of farmers, workers and their families. Some studies document no significant change in some of these variables, but there are very few instances of negative results. Although evidence on broader impacts is quite limited, a handful of published studies suggest that clusters of certified farms are contributing to landscape-level conservation values, while one study documents spillover effects of good practices from certified farms to their non-certified neighbors. These results point to the contribution of certification to sustainable, resilient rural landscapes. This quantitative evidence is supported by qualitative evidence in published studies and informal feedback from producers, which suggest that SAN/Rainforest Alliance certification is delivering a range of tangible benefits (e.g., improved farm management systems and fewer health problems) as well as less tangible benefits (e.g., improved outlook on farming livelihoods). While these results provide valuable insights into the results of the SAN/Rainforest Alliance certification system, we also note some important gaps in the evidence base. First, results from published studies are focused on the specific sets of farms or landscapes on which those studies focused, and cannot necessarily be generalized across all certified operations. Conducting additional research that examines similar research questions in different contexts is necessary to improve the generalizability of findings. Second, there remains very little evidence on certain Theory of Change outcome areas; these remain priorities for future research. In instances where the M&E system has revealed comparatively lower performance relative to certain Theory of Change objectives in specific crops or locations, the SAN and its members work in two primary ways to address these issues. First, together with local partners, they seek to provide field-level support to address priority issues. This support can range from providing focused training modules or technical guidance on specific topics to broader engagement with entire industry sectors or sets of stakeholders in specific landscapes. For instance, training on cocoa production in West Africa provided by SAN members and partners emphasizes improved shade canopy management to optimize ag- 1 Conclusion: Looking Forward

101 Conclusion: Looking Forward ronomic and conservation outcomes. And to address drivers of land degradation and climate change vulnerability, the Rainforest Alliance is working with the tea sector to address these issues at a landscape scale in critical tea-growing regions such as Kericho-Mau in Kenya and Darjeeling in India. Second, the SAN has led a process of revising the SAN Standard to incorporate learning from the M&E system, as elaborated earlier in this report. In some cases, this process has led to tighter or more prescriptive requirements to address more effectively key areas of social and environmental risk. For instance, to accelerate progress in improving worker housing and access to potable water, the SAN has now established critical criteria related to these outcomes. The revision process has also resulted in changes that can help producers more effectively localize sustainable agriculture practice to specific contexts. The new standard is also slated to place a stronger emphasis on driving continuous improvement, thereby building on the positive trends observed in the period while reducing the likelihood that certain issues will remain inadequately addressed over time. The results documented in this impacts report hint at the vast opportunity to manage tropical and sub-tropical farming systems to simultaneously increase productivity, improve livelihoods, and conserve nature and at the ability of standards and certification to facilitate this transition to sustainable agriculture. Drawing on insights from monitoring, evaluation, and impact assessment, the SAN and Rainforest Alliance will continue to work to increase the scale and effectiveness of this approach. A tea plucker bows in greeting on a tea estate near Coonoor, India. SAN/Rainforest Alliance Impacts Report 11
102 Annexes Annex A Global Reach, by Country Number of SAN/Rainforest Alliance certified farms, certificates, and total certified area for each of the 42 countries with SAN/Rainforest Alliance certificates. Data are as of December 214. Country Certified farms Certificates Total certified area (ha) Argentina ,568 Bangladesh ,76 Bolivia Brazil ,586 Burkina Faso Burundi 25, ,143 Cameroon 8, ,63 Chile ,991 China 3, ,93 Colombia 9, ,54 Costa Rica 3, ,887 Côte d Ivoire 12, ,497 Dominican Republic 2, ,23 Ecuador 3, ,311 El Salvador ,11 Ethiopia 23, ,247 Ghana 65, ,311 Guatemala 2, ,899 Honduras 1, ,675 India 9, ,126 Indonesia 48, ,677 Jamaica Kenya 67, ,163 Madagascar 6, ,814 Malawi 11, , Annexes
103 Annex A cont d Country Certified farms Certificates Total certified area (ha) Mexico 3, ,73 Nicaragua ,312 Nigeria 11, ,595 Panama ,368 Papua New Guinea 3, ,655 Peru 16, ,46 Philippines ,91 Rwanda 29, ,38 South Africa ,713 Sri Lanka ,883 Tanzania 64, ,298 Togo 3, ,24 Turkey 18, ,658 Uganda 21, ,515 Vietnam 7, ,119 Zambia 1 1 1, Zimbabwe ,877 SAN/Rainforest Alliance Impacts Report 13
104 Annex B SAN Standard Conformance Data, by Crop and Region Percentage of Rainforest Alliance Certified operations that registered a minor or major non-conformity at the time of the first audit (211 or later), and the subset of these initial non-conformities that remained outstanding at the time of the most recent audit (up to April 214). Data are for 26 banana certificates in Central America, 68 coffee certificates in Central America, 72 cocoa certificates in West Africa and 53 tea certificates in East Africa. Criteria descriptions in the left column are abbreviations only; for the full language of each criterion, please see the 21 SAN Sustainable Agriculture Standard, available at Asterisks indicate critical criteria, which are mandatory for certification. In cases where non-conformities with critical criteria were registered at the first audit, a certificate was not issued until the operation rectified these non-conformities. asterisk (*) denotes Critical Criteria Banana in Central America Cocoa in West Africa Coffee in Central America Tea in East Africa SAN criteria initial recent initial recent initial recent initial recent 1.1 Social & environmental management system Plans & policies to comply with Standard Management commitment to certification Management system available to workers Documentation of management system Evaluate impacts of new farm activities Continual improvement program Service providers comply with Standard Training & education program * Separation & traceability of certified products Energy efficiency plan * Protect/restore all natural ecosystems * No natural ecosystem destruction No harm to nearby protected areas No harvest of threatened plants Buffers between chemical use and natural areas Annexes
105 Annex B cont d Banana in Central America Cocoa in West Africa Coffee in Central America Tea in East Africa SAN criteria initial recent initial recent initial recent initial recent 2.6 Buffers along water bodies Buffers between crops and areas of human activity Agroforestry shade cover Maintain ecosystem connectivity Wildlife and habitat inventory Protect wildlife habitat * No hunting Inventory of wildlife in captivity Permits for wildlife breeding 3.6 Permits for wildlife reintroduction Water conservation program Permits for water use Irrigation monitoring and efficient use Wastewater treatment systems * No illegal wastewater discharge Water quality monitoring for discharge * No solid waste in water bodies Septic tanks suitably installed and operated Water quality monitoring Social and labor policy * No labor discrimination 5.3 Direct hiring of workers Fair payment policies * Workers paid minimum wage or higher 2 SAN/Rainforest Alliance Impacts Report 15
106 Annex B cont d Banana in Central America Cocoa in West Africa Coffee in Central America Tea in East Africa SAN criteria initial recent initial recent initial recent initial recent 5.6 Working hours restrictions Restrictions on overtime work * No employment of workers under Restrictions on minors work on family farms 5.1* No forced labour 5.11 Respectful treatment of workers 5.12* Workers have the right to organize Inform workers of key changes Clean and safe housing Access to potable water Access to medical services Access to education Educational program about certification Restrictions on minors harvesting work Occupational health and safety program Worker training program Agrochemical use training Annual medical exam Agrochemical medical tests Health and safety resources and services Safe operation of workshops and storage areas Safe design of workshops and storage areas Safe storage areas for harmful substances Annexes
107 Annex B cont d Banana in Central America Cocoa in West Africa Coffee in Central America Tea in East Africa SAN criteria initial recent initial recent initial recent initial recent 6.1 Safe agrochemical storage Location of agrochemical and fuel storage Avoid agrochemical spills during transport * Use of personal protective equipment Safety measures for agrochemical use Protect all persons from agrochemicals Wash facilities for agrochemical workers Wash clothes after agrochemical work Emergency response plan Adequate safety and first aid equipment Protect workers from extreme weather Farm activities respect community areas 7.2* Community outreach and participation Prioritize local hiring Farms support local community and economy Support environmental education and research Farm has legitimate land rights 8.1 Integrated pest management Agrochemical rotation and reduction Proper agrochemical mixing and application SAN/Rainforest Alliance Impacts Report 17
108 Annex B cont d Banana in Central America Cocoa in West Africa Coffee in Central America Tea in East Africa SAN criteria initial recent initial recent initial recent initial recent 8.4* No use of illegal/sanprohibited pesticides Reduce/eliminate WHOclassified pesticides * No transgenic crops 8.7 Fumigation only as post-harvest treatment * Fire use restricted for sugar cane harvest Fire use restricted for pest management 9.1 Soil erosion control Soil/crop fertilization program Vegetative ground cover Promote use of fallow areas * New production plots only in suitable areas 1.1 Integrated waste management program No open dumps or open-air burning Safe waste deposit areas Safe and legal waste transfer No waste accumulation Decrease net greenhouse gas emissions Annexes
109 This Annex describes the methods used to evaluate, synthesize, and report the results presented in this document, as well as the monitoring and evaluation (M&E) indicators around which the SAN/Rainforest Alliance M&E system is designed and executed. Annex C Methodology Methodology for Data Collection, Synthesis, and Reporting Information presented in the Impacts Report is derived from three sources: 1) basic data from SAN/Rainforest Alliance certificates; 2) audit data from a subset of 219 certificates representing four crops; and 3) results from about twenty impact research studies. Each of these information sources is discussed in sequence below. Basic Data from SAN/Rainforest Alliance Certificates The SAN certificate database is the source of information for time-series data on the number of certificates, number of farms, total production hectares, and total certified hectares. It is also the source for data on breakdowns of these quantities by crop, country, and region. Finally, the SAN certificate database records data on the quantity of certified products produced by each certified entity. The certificate database is updated continually as certificates are added, terminated or renewed. Following are some notes about the analysis of these source data: Time series: Trend data reported for number of farms, production hectares, total certified hectares, and quantity produced are based on all active certificates as of December 31 of each indicated year. Regional breakdowns: Data for total number of certificates, farms, and total certified hectares summarized by geographic region are based on the region classifications indicated in Figure 3. Breakdown by farm size: For group certificates, data on the proportionate breakdown of certified farms and certified land by farm size ( 2 ha, 2 5 Mesoamerica: Costa Rica, El Salvador, Guatemala, Honduras, Mexico, Nicaragua, Panama South America: Argentina, Bolivia, Brazil, Chile, Colombia, Ecuador, Peru Caribbean: Dominican Republic, Jamaica West & Central Africa: Burkina Faso, Cameroon, Côte d Ivoire, Ghana, Nigeria, Togo East & Southern Africa: Burundi, Ethiopia, Kenya, Madagascar, Malawi, Rwanda, South Africa, Uganda, Zambia, Zimbabwe South & West Asia: Bangladesh, India, Sri Lanka, Turkey East & Southeast Asia: China, Indonesia, Papua New Guinea, Philippines, Vietnam Figure 3. Classification of countries into regions for the purpose of regional breakdown analyses. This map includes only the 42 countries for which there were active SAN/Rainforest Alliance certificates as of December 31, 214. The East and Southeast Asia region also includes Melanesia (Papua New Guinea). SAN/Rainforest Alliance Impacts Report 19
110 Annex C cont d ha, and >5 ha) are based on the mean size of farms within each group certificate. Given that farm size distribution data from group certificates are therefore approximate, the overall distributions by farm size per region should be interpreted as indicative but not precise distributions. Quantity of products produced: Production volumes reported in the crop spotlight infographics are reported in metric tons of: Cocoa: cocoa beans Coffee: green coffee beans, or equivalent Bananas: bananas Tea: made tea (following initial processing and drying) Percent share of world production: Statistics on the percent share of Rainforest Alliance Certified crops in total world production are calculated by dividing the total production of each crop on certified farms by the total world production for the corresponding year, as reported by FAOSTAT for tea and bananas (faostat.fao.org), the International Cocoa Organization for cocoa ( and the International Coffee Organization for coffee ( It should be noted that data on certified production, as presented in each crop spotlight, reflect the total production of each crop on certified farms, not the total quantity of each crop that is sold or labeled as Rainforest Alliance Certified, which is lower. Production values are reported for twelve-month periods, but these periods do not always coincide with the calendar year. Total production values reported for each year are based on the updated production volume data for each certificate in each year, even if the reporting period for this production volume falls partially outside of the corresponding calendar year. As such, volume figures should be treated as approximate. Audit Data from SAN/Rainforest Alliance Certificates To evaluate patterns and trends in conformance with SAN criteria by crop and region, we analyzed data from 541 audit reports representing 219 SAN/Rainforest Alliance certificates. These certificates were selected according to the following criteria: They were active in 214. They covered operations that had been audited at least twice under the present (July 21) version of the SAN Standard (to enable time-series analysis to be conducted). They were located in one of the priority regions selected for analysis, including Central America (excluding Mexico) for coffee and bananas, West and Central Africa for cocoa and East Africa for tea. These crop/region groupings were selected because they represent the greatest concentrations of activity for each of the four largest Rainforest Alliance Certified crops. For each certificate, we compiled conformance data for all audits conducted between January 211 and September 214 (for cocoa, coffee and bananas) or June 215 (for tea). We then conducted two kinds of analyses. First, we identified all non-conformities occurring at the time of the first audit for each certificate and tracked the fate of these non-conformities over time to evaluate the extent to which they were eliminated (resolved) by the time of the final audit for the corresponding certificate. These results are reported in the crop spotlight sections. Second, we compared the absolute performance of operations with respect to the SAN criteria at the time of the initial audit versus the final audit. These results are synthesized by outcome area and reported in the water, biodiversity and climate-smart agriculture spotlight sections. The two methods each 11 Annexes
111 Annex C cont d provide different and complementary information about conformance trends over time. Further information on each method is provided in the following paragraphs. Tracking resolution of initial non-conformities: For each SAN criterion, we first calculated the percentage of producers in each crop/region grouping that were issued a non-conformity at the initial audit. We then calculated the proportion of these non-conforming farms that had addressed this non-conformity (i.e. auditors confirmed that the producer was now in full compliance with the criterion) by the most recent audit. For example, at the initial audit, if there were 3 producers in a crop/region grouping and six of them received a non-conformity for Criterion 1.1, then this criterion would have a non-conformity level of 6/3 or 2 percent at the initial audit. At the most recent audit, if only one of the original non-conformities for Criterion 1.1 remained outstanding then the recent audit non-conformity rate would be 1/3 or 3.3 percent. In the few cases where non-conformities with critical criteria were registered at the initial audit, a certificate was not issued until the operation rectified these non-conformities. Criterion-level data from this analysis for each crop/region grouping are reported in Annex B. In the crop spotlights, we present data on sub-sets of the criteria that are most salient to key agricultural sustainability challenges in each crop for the featured region. We also conducted a similar analysis at the level of each SAN principle for each crop/region grouping. For this analysis, we averaged criterion-level conformance and changes in conformance across all of the applicable criteria in each SAN principle. For instance, if an operation received non-conformities for three of the 11 criteria in Principle 1 at the initial audit, then this operation would have an initial non-conformance level of 3/11 or 27 percent. If one of these non-conformities remained outstanding at the recent audit, the recent audit non-conformance would be 1/11, or 9 percent. We then averaged these producer-level non-conformity rates for initial and recent audits to derive mean non-conformity rates for each crop/region grouping. Comparing initial and recent performance for key practices related to water, biodiversity and climate-smart agriculture: For each of these three topics, we created an index by selecting SAN criteria that most directly address that topic. We calculated the percentage of the selected criteria for which each certified producer was in conformance (i.e., did not receive a non-conformity) at the initial audit and again at the most recent audit. These values were then averaged across all producers in a given crop/region grouping to derive mean index score values for that grouping. Other information: Please note the following additional points about the audit-based analyses: For the sake of simplicity, the analyses presented in this report do not distinguish between minor non-conformities and major non-conformities. The terms conformance and conformity are identical in meaning and are used interchangeably in discussing results. The amount of time between the initial audit and the final audit varied among different operations in each crop/region grouping. This is because some operations were audited three or even four times within the study interval, whereas others were audited only twice. Additionally, for any given certified operation, the amount of time between individual audits sometimes deviated from the standard interval of 12 months. As a consequence, the period of time over which changes in conformance were evaluated differed within the sample group for each crop/region grouping. SAN/Rainforest Alliance Impacts Report 111
112 Annex C cont d For group certificates, the analysis of changes in conformance may be complicated by the fact that group membership can change over time. When new members join a group, they are inspected and may affect the conformance score for the group overall. Non-conformities associated with new group members are treated as new non-conformities for existing groups rather than as initial non-conformities, even though the members that recently joined the group were being audited for the first time. This dynamic is particularly prevalent among cocoa group certificates, and may serve to reduce the apparent progress in conformance among certified cocoa groups. Data from the SAN certificate database and audit records are analyzed and reported here only in aggregate form, which does not expose information about individual producers. Where conformance data for specific criteria are presented in this report, the criteria numbering is based on the July 21 SAN Standard, Version 3. As of December 215, an updated Version 4 of the July 21 SAN Standard was released and superseded Version 3. Please note that a small number of criteria are numbered differently in Version 4 than in Version 3. Impact Research Studies In addition to data derived through the certification audit process, evidence on the effects of the SAN/Rainforest Alliance certification system is available from numerous evaluation and impact studies conducted over the past several years. These studies complement the evidence base available from certification data: whereas data from the certification system are helpful to characterize support strategies, direct results and certain key outcomes, research studies can provide more in-depth assessment, particularly of key outcomes and broader impacts defined in the Theory of Change (see Overview of the Monitoring & Evaluation System, p. 25). Research studies can also help evaluate causal linkages between support strategies and results by using experimental or quasi-experimental designs to discern the effect of specific interventions. However, as the research studies each focus on specific groups of producers, crops or locations, their results may not be generalizable across all certified producers in a given region or crop sector. Some of the research studies on the effects of SAN/Rainforest Alliance certification were commissioned by Rainforest Alliance, but the majority was conducted independently of the SAN, Rainforest Alliance, or SAN members. Please see Annex D for the full citations of the research studies synthesized in this Impacts Report. We used the following criteria to determine which research studies to synthesize and reference in this report: The study was published in 211 or later (except for research on bananas, for which earlier studies were synthesized because more recent research was not available). The study sought to evaluate the effects of one or more SAN/Rainforest Alliance support strategies typically farmer training and/or certification on one or more Theory of Change results (direct results, key outcomes and/ or broader impacts). The study included a credible point of comparison or counterfactual, such as a control group of non-certified producers or a control site. We also included studies where the objective was to assess the effects of certification on change over time, in which case the point of comparison was an earlier 112 Annexes
113 Annex C cont d point in time for the producers being evaluated. Throughout this report in the four crop spotlights as well as the four issue spotlights we summarize key findings of research studies meeting the above criteria. In preparing these summaries, every effort was made to provide a balanced portrayal of positive, negative and neutral results. Specifically, research results were summarized as follows: Results relevant to the topics discussed in this report (i.e., relevant to the Theory of Change results) are generally summarized. Where results on a particular topic are summarized, we have strived to portray them in a balanced way, whether positive, negative or neutral. In general, only statistically significant results are summarized in this report. Where we use the term significant or significantly, it indicates that the original research reported statistical significance at p.5. In some instances, we summarize results that were not statistically significant (or where the researchers did not report statistical significance) because the results provide useful descriptive information on a particular topic and because better-quality evidence was not available. Any research results that were not reported to be statistically significant in the original study are noted as such in the text. We encourage interested readers to refer to the original source of each research study (as cited in Annex D) for additional information. Many of these studies are available from Rainforest Alliance s website at work/impact/research. Disclaimer This document has been prepared on the basis of data available from multiple sources, including the SAN and its certification bodies, as well as commissioned and independent research studies. The authors have not independently validated these data and therefore Rainforest Alliance does not guarantee or warrant the accuracy, reliability, completeness, or currentness of the information in this report. Rainforest Alliance will not be liable for any direct or indirect loss, damage, cost, or expense, including without limitation consequential damages incurred or arising by reason of any person using or relying on information in this report. Monitoring and Evaluation Indicators The thematic focus of M&E data collection and reporting is defined by the suite of M&E indicators presented in the M&E System Indicators table on page 115. These indicators were selected according to two primary criteria: 1. Indicators relate closely to the Theory of Change. Individual indicators are able to characterize specific Theory of Change support strategies, direct results, key outcomes, and broader impacts, while the indicator set collectively is sufficient to characterize all key results areas and to permit rich data analysis and disaggregation to gain further insight into different kinds of results and the conditions or contexts in which they are realized. 2. Indicators are specified according to evaluation good practice, such as applicable SMART guidelines for indicators to be specific, measurable, attainable, relevant and time-bound. Indicators are appropriate to assess the hypothesized intended as well as unintended consequences that may come about as a result of SAN/Rainforest Alliance certification, training and related interventions. SAN/Rainforest Alliance Impacts Report 113
114 Annex C cont d Wherever possible and appropriate, the M&E system indicators have been aligned with indicators or indicator frameworks developed and tested by the community of practice of sustainability standards systems, researchers, private companies and NGOs involved in developing sustainability performance measures for agricultural production systems and value chains. For instance, the SAN/Rainforest Alliance indicator set incorporates the large majority of the ISEAL Common Indicators. Indicators are divided into three categories, as presented in the M&E System Indicators table on page 115. Indicator set (A) pertains to the size, location and characteristics of Rainforest Alliance Certified farms, crops and lands. These indicators are used to document the reach of the support strategies identified in the Theory of Change. Indicator set (B) pertains to market-related direct results. Indicator set (C) the one most closely linked to social and environmental sustainability tracks direct results, key outcomes and broader impacts. These indicators are organized according to the key outcomes in the Theory of Change (see page 16). Please note that the table presents indicators, not means of measure. For certain indicators, especially in the right column of the table, there may be many different, credible ways to measure or quantify the indicator. For instance, water quality may be assessed by means of chemical tests, macroinvertebrate inventories, or certain visual assessments such as the use of sedimentation tubes. Within the bounds of the indicators framework, appropriate means of measure may be selected in the context of specific monitoring or impact studies. As shown in the table, some indicators are intended to be tracked across all certificates in the SAN/Rainforest Alliance certification system. Others require more in-depth evaluation and typically cannot be measured through the audit process; these indicators are assessed through sampled monitoring efforts or as part of impact studies. The table includes all indicators that are within the scope of the M&E system, as of October 215. Indicators in plain text are those that have been the focus on monitoring, evaluation, and impact studies to date, and for which some data have been amassed. Results related to most of these indicators are reported in this document. Indicators in italics have not been possible to monitor to date, or have only recently been the focus of monitoring, with little or no data amassed to date; these indicators are considered priorities for ongoing or future investigation. 114 Annexes
115 Annex C cont d M&E System Indicators Summary of indicators for the SAN/Rainforest Alliance M&E system. Indicators in plain text have been the primary focus of monitoring, evaluation, and impact studies to date; information on most of these indicators is presented in this Impacts Report. Indicators in italics have not been possible to monitor to date, or have only recently been incorporated into monitoring efforts. SAN/Rainforest Alliance M&E system indicators Theory of Change results theme Intended to be assessed for all certificates through auditing and traceability processes Intended to be assessed for a sample of certified operations, or as part of impact studies (A) Indicators to track support strategies (outputs): reach of the SAN/Rainforest Alliance support strategies and characteristics of the people, groups and lands reached through these support strategies Farms and producers Number of certificates, by crop, location and type (group vs. individual) Number of certified farms, by crop, location and type (group member vs. individual) Size distribution of certified farms, by crop and location Size distribution of land area under cultivation (for group members only) Number of members per certified group, by gender and by inclusion in the certificate Workers Lands Producer training and support Other key characteristics of certificate-holders Number of workers on certified farms, by location, crop, employment status, worker origin and gender Certified land area, by location & crop Certified production area, by location and crop Number of producers trained in best practices, by location, crop, type (farmer vs. worker), gender, type of training provider, and training topics Number and identity of other certifications held Labor model(s) used by farmers within certified groups Level(s) of mechanization of farmers within certified groups Group s position(s) in the value chain Relation of certified lands to areas of high social or environmental risk (various spatial indicators) Farmer perception of training quality and utility Land tenure status of group members Farmer age (group members only) Years of formal schooling completed (group members only) SAN/Rainforest Alliance Impacts Report 115
116 Annex C: M&E System Indicators cont d SAN/Rainforest Alliance M&E system indicators Theory of Change results theme Intended to be assessed for all certificates through auditing and traceability processes Intended to be assessed for a sample of certified operations, or as part of impact studies (B) Indicators to track production- and market-related direct results and key outcomes: contributions of sustainable production, certification, and marketing to market and sector transformation Production Sales Public recognition, understanding, and use of the certification label Quantity of production, by product, variety, location and farm type (group vs. individual) Quantity of certified product sold as certified, by product type Proportion of product sold as certified, by product type and origin Number of countries in which Rainforest Alliance Certified products are sold Number of SKUs using the Rainforest Alliance Certified seal Amount of price premium to producers for certified sales Proportion of consumers recognizing and understanding the meaning of the seal in key consuming markets (C) Indicators to track field-level direct results, key outcomes, and broader impacts: results related to the areas of social, environmental, economic, and agronomic sustainability identified in the Theory of Change Biodiversity: Farms protect forests and other natural ecosystems Biodiversity: Farms increase the amount and diversity of native vegetation Biodiversity: Farms contribute to landscape-level conservation Biodiversity: Endangered species are protected and all native flora and fauna are conserved Natural resources: Soil health is maintained and improved, and erosion is minimized Natural resources: Water pollution is minimized Land area under conservation management, by location and management objective Conformance with key SAN criteria, by crop and location Conformance with key SAN criteria, by crop and location Conformance with key SAN criteria, by crop and location Conformance with key SAN criteria, by crop and location Conformance with key SAN criteria, by crop and location Conformance with key SAN criteria, by crop and location Rate of ecosystem destruction or restoration compared to surrounding areas Water quality and habitat quality characteristics in aquatic natural ecosystems Quantity and diversity of on-farm vegetation Changes in landscape composition and structure following certification Presence, abundance, or survivorship of species in key taxa around certified farms Adoption of specific practices to foster soil conservation and health Fertilizer application rates relative to crop requirements Sediment load in receiving water bodies on or near certified farms Chemical and biological properties of receiving water bodies on or near certified farms 116 Annexes
117 Annex C: M&E System Indicators cont d SAN/Rainforest Alliance M&E system indicators Theory of Change results theme Natural resources: Farms use water efficiently and within natural limits Natural resources: Farms reduce net greenhouse gas emissions Farmer, worker, and family well-being: essential needs are met related to food, housing, clean water, health care, education, transport, clothing, and savings Farmer, worker, and family well-being: minors are not exposed to harmful labor conditions Farmer, worker, and family well-being: worker rights are protected and the workplace is safe Farmer, worker, and family well-being: farmer groups support smallholders through effective and transparent management Farmer, worker, and family well-being: farms support rural communities and avoid harmful impacts to them Farm productivity and profitability: farms increase productivity of cash crops and food crops Farm productivity and profitability: farms produce higher-quality products Intended to be assessed for all certificates through auditing and traceability processes Conformance with key SAN criteria, by crop and location Conformance with key SAN criteria, by crop and location Conformance with key SAN criteria, by crop, location, and characteristics of farmer or worker populations (as characterized by indicator set [A]) Conformance with key SAN criteria, by crop and location Conformance with key SAN criteria, by crop and location Conformance with key SAN criteria, by crop and location Conformance with key SAN criteria, by crop and location Intended to be assessed for a sample of certified operations, or as part of impact studies Quantity of irrigation water used per unit crop produced (irrigated crops only) Estimates of net GHG emissions based on existing calculator tools (e.g., Cool Farm Tool) Education levels of children of certified farmers Number of school-aged children attending school full-time (compared to total number of school-aged children in household) Level of farmer savings and investment over past 12 months Change in household livelihoods assets index Characteristics of the group management structure Durability, transparency, and fairness of trading relationships Productivity (quantity produced per hectare) of certified crops, by crop and location Variety, age and regeneration status of perennial crop plants Change in smallholder farmers mix of crops (e.g., proportion of land devoted to certified crops) Measures of product quality (e.g., grading results or reject rates) SAN/Rainforest Alliance Impacts Report 117
118 Annex C: M&E System Indicators cont d SAN/Rainforest Alliance M&E system indicators Theory of Change results theme Farm productivity and profitability: water, fertilizer, energy, pesticides, and labor are used more efficiently Farm productivity and profitability: farms realize higher profits Farm productivity and profitability: farms are more resilient to changing conditions and extreme events Intended to be assessed for all certificates through auditing and traceability processes Conformance with key SAN criteria, by crop and location Conformance with key SAN criteria, by crop and location (including climate-smart agriculture index) Intended to be assessed for a sample of certified operations, or as part of impact studies Quantity of irrigation water used per unit crop produced (irrigated crops only) Fertilizer application rates relative to crop requirements Energy use for crop processing Gross income and net income for certified crops Gross income and net income from all farm activities Rates of crop loss or income loss due to climate-related shocks, such as pest or disease outbreaks or drought 118 Annexes
119 Annex D Bibliography Addae-Boadu S The cocoa certification program and its effect on sustainable cocoa production in Ghana: A case study in Upper Denkyira West District. MSc thesis, Kwame Nkrumah University of Science and Technology, Ghana. Barham BL, Weber JG The economic sustainability of certified coffee: recent evidence from Mexico and Peru. World Development 4: Bennett M, Francesconi GN, Giovannucci D, Daitchman J Côte d Ivoire cocoa: COSA survey of Rainforest Alliance Certified farms. Committee on Sustainability Assessment. Borg J, Selmer JK From Ghana to Magnum ice cream: Tracking down the organisation of sustainable cocoa product chains. MSc thesis, Chalmers University of Technology, Gothenburg, Sweden. Deppeler A, Fromm I, Aidoo R The unmaking of the cocoa farmer: Analysis of benefits and challenges of third-party audited certification schemes for cocoa producers and laborers in Ghana. Available from fileadmin/data/publikationen/214/3_deppeler_the_unmaking_of_the_cocoal_farmer_ifama.pdf (accessed October 215). Haggar J, Cuadra L, Alvarado U, Soto G Environmental and economic costs and benefits from sustainable certification of coffee in Nicaragua. Food Chain 2: Hardt E, Borgomeo E, dos Santos RF, Pinto LF, Metzger JP, Sparovek G Does certification improve biodiversity conservation in Brazilian coffee farms? Forest Ecology and Management 357: Hughell D, Newsom D Impacts of Rainforest Alliance certification on coffee farms in Colombia. Rainforest Alliance, New York. IPCC [Intergovernmental Panel on Climate Change] Summary for policymakers. In Edenhofer O, et al., editors. Climate change 214: mitigation of climate change. Working Group III Contribution to the Fifth Assessment Report of the Intergovernmental Panel on Climate Change. Cambridge University Press, Cambridge, UK and New York. Jaramillo J, Setamou M, Muchugu E, Chabi-Olaye A, Jaramillo A, Mukabana J, Maina J, Gathara S, Borgemeister C Climate change or urbanization? Impacts on a traditional coffee production system in East Africa over the last 8 tears. PLoS ONE 8(1): e Jha S, Bacon CM, Philpott SM, Méndez VE, Läderach P, Rice RA Shade coffee: update on a disappearing refuge for biodiversity. BioScience 64: Karp DS, Mendenhall CD, Sandí RF, Chaumont N, Ehrlich PR, Hadly E, Daily GC Forest bolsters bird abundance, pest control and coffee yield. Ecology Letters 16: Komar O Are Rainforest Alliance Certified coffee plantations bird-friendly? Final technical report for UNDP/RA/GEF Biodiversity Conservation in Coffee Project. Available from komar-bird-study (accessed September 215). SAN/Rainforest Alliance Impacts Report 119
120 Annex D cont d Krain E, Millard E, Konan E, Servat E Trade and pro-poor growth: Introducing Rainforest Alliance Certification to cocoa production in Côte d Ivoire. GIZ, Eschborn, Germany. Lalitha N, Nelson V, Martin A, Posthumus H Assessing the poverty impact of sustainability standards: Indian tea. Natural Resources Institute, University of Greenwich, London. Magrach A, Ghazoul J Climate and pest-driven geographic shifts in global coffee production: implications for forest cover, biodiversity and carbon storage. PLoS ONE 1(7): e Melo CJ, Wolf S. 25. Empirical assessment of eco-certification: the case of Ecuadorian bananas. Organization & Environment 18: Melo CJ, Wolf S. 27. Ecocertification of Ecuadorian bananas: Prospects for progressive north south linkages. Studies in Comparative International Development 42: Ochieng BO, Hughey KFD, Bigsby H Rainforest Alliance Certification of Kenyan tea farms: A contribution to sustainability or tokenism? Journal of Cleaner Production 39: Oseni JO, Adams AQ Cost benefit analysis of certified cocoa production in Ondo State, Nigeria. Invited paper, 4th International Conference of the African Association of Agricultural Economists, Hammamet, Tunisia. Potts J, Lynch M, Wilkings A, Huppe G, Cunningham M, Voora V The state of sustainability initiatives review 214. International Institute for Sustainable Development, Winnipeg, Manitoba, Canada and International Institute for Environment and Development, London. Rueda X, Lambin EF Responding to globalization: impacts of certification on Colombian small-scale coffee growers. Ecology and Society 18(3):21. Rueda X, Thomas NE, Lambin EF Eco-certification and coffee cultivation enhance tree cover and forest connectivity in the Colombian coffee landscapes. Regional Environmental Change 15: Stathers T, Gathuthi C, et al Poverty impact of social and environmental voluntary standards systems in Kenyan tea. Natural Resources Institute, University of Greenwich, London. Takahashi R, Todo Y The impact of a shade coffee certification program on forest conservation: A case study from a wild coffee forest in Ethiopia. Journal of Environmental Management 13: Whelan T, Newsom D Sustainable coffee farming: improving income and social conditions, protecting water, soil and forests. Rainforest Alliance, New York. Waarts Y, Ge L, Ton G, Jansen D Sustainable tea production in Kenya: Impact assessment of Rainforest Alliance and Farmer Field School training. LEI report The Hague, Netherlands. 12 Annexes

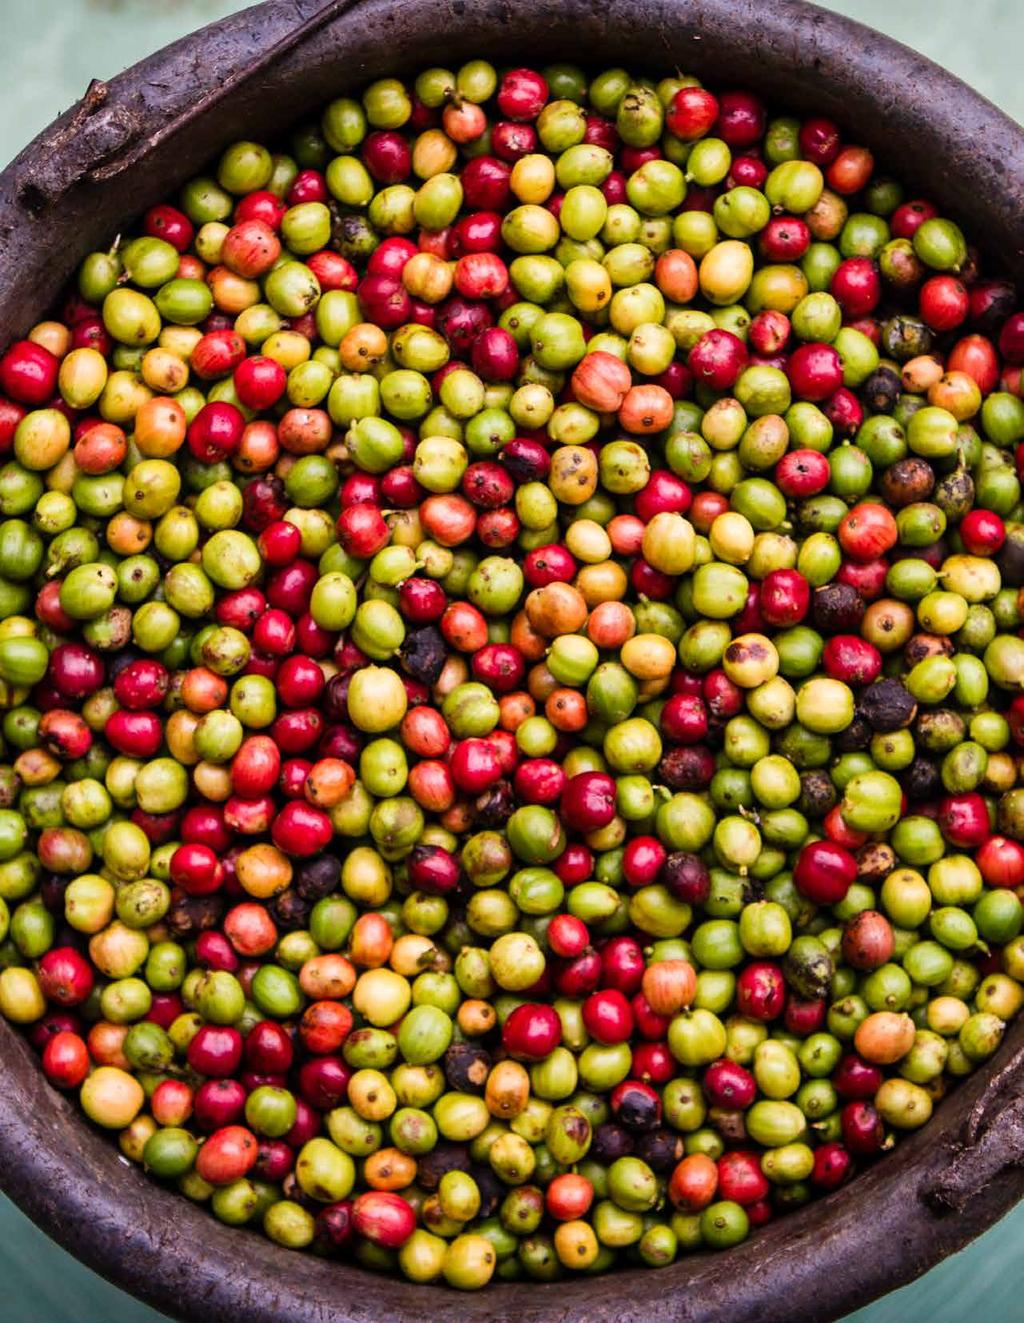


121
2015 SAN/Rainforest Alliance Impacts Report
 2015 SAN/Rainforest Alliance Impacts Report Evaluating the Effects of the SAN/Rainforest Alliance Certification System on Farms, People, and the Environment Executive Summary 2015 SAN/Rainforest Alliance
2018 Rainforest Alliance Impacts Report. Partnership, Learning, and Change. Deanna Newsom and Jeffrey C. Milder
 2018 Rainforest Alliance Impacts Report Partnership, Learning, and Change Deanna Newsom and Jeffrey C. Milder 2018 RAINFOREST ALLIANCE IMPACTS REPORT Foreword 4 Executive Summary 6 CHAPTER 1 An Introduction
CLIMATE SMART AGRICULTURE
 2017 CLIMATE SMART AGRICULTURE in the 2017 SAN Sustainable Agriculture Standard SAN Sustainable Agriculture Network Introduction Climate change fundamentally and increasingly affects agriculture. Warming,
MEASURABLE IMPACTS OF VOLUNTARY STANDARDS: THE ENVIRONMENT
 MEASURABLE IMPACTS OF VOLUNTARY STANDARDS: THE ENVIRONMENT A PRESENTATION AT THE IPECA BIOFUEL WORKSHOP 18-19 SEPT 2009 Rainforest Alliance 2009 Rainforest Alliance 54 2009 Rainforest Alliance 55 IN KEY
CHAIN OF CUSTODY STANDARD
 CHAIN OF CUSTODY STANDARD March 2014 Sustainable Agriculture Network and Rainforest Alliance, 2012-2014. Sustainable Agriculture Network (SAN): Conservación y Desarrollo, Ecuador Fundación Interamericana
Improving Practices, Changing Lives. An analysis of tea certification audit reports from Malawi, Rwanda and Tanzania
 Improving Practices, Changing Lives An analysis of tea certification audit reports from and Deanna Newsom, Jeffrey C. Milder AND Paula Bartemucci INTRODUCTION In 2007, a farm in Kenya became the first
Agricultural Production Standard (APS) At a Glance
 At a Glance") Agricultural Production Standard (APS) At a Glance Fair Trade USA Version 1.0.0 June 2017 Introduction to Fair Trade USA and the APS What is Fair Trade USA? Fair Trade USA is a nonprofit organization and
Agricultural Production Standard (APS) At a Glance Fair Trade USA Version 1.0.0 June 2017 Introduction to Fair Trade USA and the APS What is Fair Trade USA? Fair Trade USA is a nonprofit organization and
Module 1: EFFECTIVE PLANNING AND MANAGEMENT SYSTEM
 Technical Modules Module 1: EFFECTIVE PLANNING AND MANAGEMENT SYSTEM Sustainable Agriculture Standard July, 2017 Version 1 D.R. 2017 Red de Agricultura Sostenible, A.C. This document is provided by Red
Forest- and Climate-Smart Cocoa in Côte d Ivoire and Ghana
 Forest- and Climate-Smart Cocoa in Côte d Ivoire and Ghana Aligning Stakeholders to Support Smallholders in Deforestation-Free Cocoa EXECUTIVE SUMMARY Forest- and Climate-Smart Cocoa in Côte d Ivoire and
FSC Principles and Criteria for Forest Stewardship
 Country/ Organization Initiative Membership Governing bodies Type and implementation approach Feedstock(s) covered Type(s) of biofuels covered Link Overview. FSC Principles and Criteria for Forest Stewardship
NATURAL RESOURCES SUSTAINBALE INVESTING GUIDELINES
 NATURAL RESOURCES SUSTAINBALE INVESTING GUIDELINES Harvard Management Company (HMC) is committed to sustainable ownership of our natural resource investments. To accomplish this goal, HMC adopted five
NATURAL RESOURCES SUSTAINABLE INVESTING GUIDELINES
 NATURAL RESOURCES SUSTAINABLE INVESTING GUIDELINES Harvard Management Company (HMC) is committed to sustainable ownership of our natural resource investments. To accomplish this goal, HMC adopted five
Sustainable Agriculture Guidance Document
 Sustainable Agriculture Guidance Document March 2018 2 Kerry Group plc Sustainable Agriculture Guidance Document Kerry Group plc Sustainable Agriculture Guidance Document 3 A rising global population and
Coffee Sustainability Catalogue 2016
 Coffee Sustainability Catalogue 2016 Appendix A: current initiatives framework: overview of current sector strategies Coffee Sustainability Catalogue 2016 1 Table of contents Appendix A: current initiatives
Joint Framework for Action Ghana
 Joint Framework for Action Ghana 1. Preamble Recognizing the vital role of the cocoa sector in Ghana in bringing jobs and wealth to local communities, while at the same time seeking to be environmentally
Collective Action to Address Climate Change in the Cocoa Sector
 Collective Action to Address Climate Change in the Cocoa Sector AC&SD 2016 Why is collective action needed? The Challenge Unproductive farms with aging, vulnerable trees; Pests and diseases; lack of access
CocoaAction. Frequently Asked Questions
 CocoaAction Frequently Asked Questions Last Updated April 2016 IN BRIEF The World Cocoa Foundation s CocoaAction strategy brings the world s leading cocoa and chocolate companies together to accelerate
Berlin Declaration Fourth World Cocoa Conference
 Berlin Declaration Fourth World Cocoa Conference We, the delegates of the fourth World Cocoa Conference, held in Berlin in April of 2018, constituting almost 1,500 participants, from more than 65 countries,
Ecoagriculture: sustainable food production through ecosystem management
 Ecoagriculture: sustainable food production through ecosystem management Jeffrey Milder, EcoAgriculture Partners & Cornell University Sara J. Scherr, EcoAgriculture Partners National Academies Workshop:
Blommer chocolate company
 Blommer chocolate company Sustainable origins Campbellford, ON Canada CHICAGO, IL EAST GREENVILLE, PA UNION CITY, CA Blommer chocolate company Sustainability Programs Blommer Chocolate Company, a third-generation,
Ecoagriculture: Agricultural landscapes for people, food and nature
 Ecoagriculture: Agricultural landscapes for people, food and nature Abigail Hart, EcoAgriculture Partners 23-26 September 2011 Inception Workshop for the Project Community Development and Knowledge Management
Building a Sustainable Cocoa Economy
 Building a Sustainable Cocoa Economy The Role of Private Voluntary Sustainability Initiatives By Jason Potts, International Institute for Sustainable Development May, 2010 The global cocoa economy faces
COMMODITIES & FORESTS AGENDA 10 PRIORITIES TO REMOVE TROPICAL DEFORESTATION FROM COMMODITY SUPPLY CHAINS
 COMMODITIES & FORESTS AGENDA 10 PRIORITIES TO REMOVE TROPICAL DEFORESTATION FROM COMMODITY SUPPLY CHAINS 1 CLICK ICON TO GO TO PRIORITY To avoid the worst effects of global climate change, it is imperative
A Review of the Draft Standard for Trial Use
 A Review of the Draft Standard for Trial Use Linda G. Brown and Michael R. Keyes Scientific Certification Systems Emeryville, CA Establishing a National Sustainable Agriculture Standard Opening Stakeholder
Moving From Niche to Mainstream Sustainability: Lessons Learned from Transforming the Fresh Fruits & Vegetables Market
 Moving From Niche to Mainstream Sustainability: Lessons Learned from Transforming the Fresh Fruits & Vegetables Market Dave Boselie and Kebba Colley 1. Introduction IDH the Sustainable Trade Initiative
COMMODITY IMPACT INDICATORS FOR BIODIVERSITY: LEARNING FROM RECENT EXPERIENCE WITH STANDARDS & CERTIFICATION SYSTEMS
 COMMODITY IMPACT INDICATORS FOR BIODIVERSITY: LEARNING FROM RECENT EXPERIENCE WITH STANDARDS & CERTIFICATION SYSTEMS Jeffrey Milder, Rainforest Alliance CBD CoP 12, Business & Biodiversity Forum October
The Nedspice- Farmers Partnership Programme
 The Nedspice- Farmers Partnership Programme 1 Sustainable Spice Farming 2 Nedspice believes that sustainability is one of the main challenges for the food industry in the years ahead. Pulled by global
PROMESA. Economic Improvement and Food Security in Coffee, Cocoa and other Crop
 PROMESA Economic Improvement and Food Security in Coffee, Cocoa and other Crop Commodities PROGRAM PACHA PROMESA INTRODUCTION This briefing note presents an integrated rural livelihoods program that will
Key Principles Covered by Our Updated Sustainability Policy:
 Key Principles Covered by Our Updated Sustainability Policy: ENVIRONMENTAL SUSTAINABILITY: PROTECTING THE DIVERSITY OF LIFE ON EARTH 1. No Development on High Carbon Stock (HCS) Forests 2. No Development
The Gold Standard A/R Smallholder & Microscale Guidelines
 The Gold Standard A/R Smallholder & Microscale Guidelines Applicable for A/R Requirements Valid since November 2014 Version 1.0 Author The Gold Standard With the support of: Table of content Background
PROCOSTA SUSTAINABLE MANAGEMENT OF COASTAL AND MANGROVE ECOSYSTEMS PROGRAM
 PROCOSTA SUSTAINABLE MANAGEMENT OF COASTAL AND MANGROVE ECOSYSTEMS PROGRAM 2014-2024 PACHA PROCOSTA INTRODUCTION Along certain pacific coastal shores in Latin America, dramatic changes are underway. Mangroves,
JOURNEYS TO CHANGE. Fairtrade Theory of Change
 JOURNEYS TO CHANGE Fairtrade Theory of Change Contents 2 1. Introduction 2 1.1 Rationale 4 1.2 Principles and assumptions 4 1.3 Use of the Theory of Change 4 1.4 Process for developing the Theory of Change
Partnership for Impact in Haiti
 Partnership for Impact in Haiti Elcio Guimaraes, Regional Director LAC André Zandstra, Head Partnerships & Donor Relations October 2013 A strategy to improve livelihoods and restore degraded land. Since
Ethical and Honest Practices
 Ethical and Honest Practices The practices socially responsible procurement in an effort to secure sustainable procurement into the future. As an essential part of its business activities, the Group aims
Madagascar: Makira REDD+
 Madagascar: Makira REDD+ Madagascar is considered to be one of the top five biodiversity hotspots in the world. More than 80% of its animal and plant species are not found anywhere else on earth, but historically
SCALING SUSTAINABLE FINANCE PRODUCTION, MARKETS AND. Workshop on Finance Mechanisms for Biodiversity MARCH 12, 2012
 SCALING SUSTAINABLE PRODUCTION, MARKETS AND FINANCE ANA PAULA TAVARES EXECUTIVE VICE PRESIDENT Workshop on Finance Mechanisms for Biodiversity MARCH 12, 2012 2009 Rainforest Alliance The Mission of Rainforest
National Ecosystems and Landscapes Restoration Program of El Salvador
 National Ecosystems and Landscapes Restoration Program of El Salvador Rationale/Background Ecosystem restoration and degraded lands rehabilitation are necessary measures to reverse the high degree of environmental
SUSTAINABILITY MATERIAL TOPICS
 SUSTAINABILITY MATERIAL TOPICS Monsanto worked with Business for Social Responsibility (BSR) to identify the sustainability topics that matter most to the success of our company and to our many stakeholders.
Sustainable Cocoa Economy
 Sustainable Cocoa Economy WCF Perspective Presentation Title Lorem Ipsum June 1, 2012 WorldCocoa.org World Cocoa Foundation World Cocoa Foundation (WCF) is an international membership organization representing
securing freshwater ecosystems
 Water is vital for human survival, yet 1.6 billion people lack access to clean drinking water and 2.6 billion people lack adequate water sanitation. We rely on fresh water not just for drinking and washing,
Nestlé General Responsible Sourcing Guidelines for Materials of Agriculture, Forestry, Fishery and Aquaculture Origin
 Nestlé General Responsible Sourcing Guidelines for Materials of Agriculture, Forestry, Fishery and Aquaculture Origin A Framework for Continuous Improvement Version 1.0 February 2013 Table of contents
Organic by Design TEXTILE EXCHANGE
 Organic by Design TEXTILE EXCHANGE We work closely with organic cotton producer groups to help build supply and closer value chain relations. Five years of production growth Fiber (mt) Over the past five
Unilever Tea Procurement Sustainable Agriculture
 Unilever Tea Procurement Sustainable Agriculture WORKING WITH DIFFERENT STAKEHOLDERS TO ACHIEVE SUSTAINABILITY 11 TH JULY 2011 ZAKARIA MITEI SA/GMP MANAGER - AFRICA Why Sustainable Agriculture? Agriculture
UNDP Submission of Inputs on the Contribution of Forests to Agenda 2030
 UNDP Submission of Inputs on the Contribution of Forests to Agenda 2030 6 December 2017 In response to the invitation contained in UNFF Resolution 12/1, UNDP is pleased to submit, as a United Nations system
Submission of a Project idea Note
 Submission of a Project idea Note Version 2.0(March 2014) 1. Introduction 2. Project investment phases 3. General conditions of eligibility 4. Livelihoods selection processus 5. Submission of a PIN 1.
Organic coffee, biodiversity, and agrochemicals: use of shade trees for low-input coffee production in Central America
 Organic coffee, biodiversity, and agrochemicals: use of shade trees for low-input coffee production in Central America Reinhold G. Muschler Center for Research and Higher Education in Tropical Agriculture
Unilever Sustainable Palm Oil Sourcing Policy 2016
 Unilever Sustainable Palm Oil Sourcing Policy 2016 Unilever uses palm oil in food products as well as in a range of home and personal care products. Palm oil is a nutritious, versatile raw material, and
Fairtrade Living Income Strategy
 Fairtrade Living Income Strategy Living Income goes back to Fairtrade s roots Fairtrade envisions a world in which all producers can enjoy secure and sustainable livelihoods, fulfil their potential and
FSC S CONTRIBUTION TO FOREST RESTORATION. Forest Restoration FSC is on board!
 Forest Stewardship Council FSC International December 2017 FSC S CONTRIBUTION TO FOREST RESTORATION Forest Restoration FSC is on board! Although the Forest Stewardship Council (FSC) is well known for promoting
Standard bearers, standard sharers What private standards reveal about opportunities for sustainable agriculture
 Standard bearers, standard sharers What private standards reveal about opportunities for sustainable agriculture Pictures 1. Veg 2. Contrails 3. Farm workers 4. UK consumers James MacGregor, Steve Homer,
Charting Transitions to Conservation-Friendly Agriculture
 Charting Transitions to Conservation-Friendly Agriculture The Rainforest Alliance s approach to monitoring and assessing results for biodiversity, ecosystems and the environment December 2013 Report by
IDH landscape program:
 IDH landscape program IDH landscape program: An integrated approach to Production, Protection and Inclusion 1 The IDH landscape program uses an innovative, integrated approach to sustainable natural management.
COSTS AND MANAGERIAL SKILLS IN ORGANIC CERTIFIED PRODUCTS 1. Pilar Santacoloma
 COSTS AND MANAGERIAL SKILLS IN ORGANIC CERTIFIED PRODUCTS 1 Pilar Santacoloma (pilar.santacoloma@fao.org) INTRODUCTION Certification is critical in organic markets because it gives buyers the confidence
Baseline Study on Newly Fairtrade Certified Cocoa Producer Organizations in Côte d Ivoire and Ghana. Terms of Reference - May 2013
 Baseline Study on Newly Fairtrade Certified Cocoa Producer Organizations in Côte d Ivoire and Ghana Terms of Reference - May 2013 Fairtrade Africa and Fairtrade International are currently seeking a research
Delivering company commitments to zero deforestation commodity supply chains
 Proforest Responsible Sourcing and Production Briefings 10 Delivering company commitments to zero deforestation commodity supply chains Deforestation associated with production of commodities including
Financing Landscape Programs Integrating Different Financing Sources
 International Workshop on Jurisdictional Landscape Programs Financing Landscape Programs Integrating Different Financing Sources Tim Brown, Environmental Economist Environment & Natural Resources Global
Starbucks Coffee Company. COCOA Practices. Scorecard. October Version 3.3
 Starbucks Coffee Company COCOA Practices Scorecard October 2018 Version 3.3 General Information GENERAL QUESTIONS - Producer Entity code Entity Name Name of owner Gender of owner GPS longitude GPS latitude
WHAT MATTERS TO OUR STAKEHOLDERS
 WHAT MATTERS TO OUR STAKEHOLDERS Responsible and sustainable business involves engaging with our stakeholders to refine our strategy. This year, we have renewed our materiality matrix, a key tool to define
Global Paper Vision. Priorities for transforming paper production, trade and use
 ENVIRONMENTAL PAPER NETWORK, MARCH 2014 OUR VISION We share a common vision of a forest, pulp and paper industry that contributes to a clean, healthy, just and sustainable future for all life on earth.
Agroecology & Markets
 Agroecology & Markets What have we learned? How can we move forward? Isablle Vagneron, CIRAD Pierre Ferrand, GRET Lao Uplands Initiative Luang Prabang 12-14 March 2018 WHAT ARE WE TALKING ABOUT? What is
Forest & Trees Strengthening policy & practice to meet the needs of forest & tree dependent people, & sustain a healthy environment for all
 Forest & Trees Strengthening policy & practice to meet the needs of forest & tree dependent people, & sustain a healthy environment for all Andrew Taber, Robert Nasi, Tony Simons, Laura Snook, Meine &
Shrimp Aquaculture Dialogue Presentation of the proposed standards
 Shrimp Aquaculture Dialogue Presentation of the proposed standards Understanding the Draft Standards Document Introduction, history, and scope Draft standards text (criteria; indicators; performance metric)
ADM Commitment to No Deforestation
 ADM Commitment to No Deforestation Policy Implementation H2 2017 Palm Progress Report In Partnership with The Forest Trust Introduction ADM committed to No Deforestation, No Peat, and No Exploitation (No
Chain of Custody Standard. July, 2015
 July, 2015 Copies of this document are available for free in electronic format at the following website: www.rainforest-alliance.org Please send your comments or suggestions concerning this document to
New Business Models for Sustainable Trade. Don Seville
 New Business Models for Sustainable Trade Don Seville (donseville@gmail.com) Agriculture: the largest industry on the planet. 1.3 billion people. $1.3 trillion in farm revenue. Half the habitable Half
GREEN DEVELOPMENT POLICY
 GREEN DEVELOPMENT POLICY 1. A NEED AND JUSTIFICATION FOR THE TRANSITION TO GREEN DEVELOPMENT 1.1. Global Perspective Climate change, rapid economic and population growth, the sharp increase in consumption
USGBC FOREST CERTIFICATION BENCHMARKS: AN OPPORTUNITY FOR DEVELOPMENT OF CERTIFICATION STANDARDS
 USGBC FOREST CERTIFICATION BENCHMARKS: AN OPPORTUNITY FOR DEVELOPMENT OF CERTIFICATION STANDARDS FOR ALL BUILDING MATERIALS DR. JIM BOWYER DR. JEFF HOWE ALISON LINDBURG KATHRYN FERNHOLZ DR. STEVE BRATKOVICH
Sustainable. for people and nature. Sustainable futures for people and nature:
 Sustainable futures for people and nature Sustainable futures for people and nature: WWF s PPA PPA Programmes AROUND THE WORLD 8 Nepal 6 brazil 7 colombia 1 china and africa 4 kenya 5 tanzania 3 tanzania
LATIN AMERICAN CACAO INITIATIVE
 LATIN AMERICAN CACAO INITIATIVE 01. Background The market for cocoa has been dynamic and growing in recent years. World production of conventional cocoa was 4.192 million tons on average between 2014 and
The Accountability Framework
 Operational Guidance on Environmental Restoration and Compensation DRAFT FOR WORKSHOPPING December 2018 DECEMBER 2018 DRAFT FOR WORKSHOPPING WITH STAKEHOLDERS initiative (AFi) is developing a common framework
Specific text recommendations and definitions can be found in the Annex documents.
 ILRF July 23rd, 2014 Ms. Indra Nooyi Chairman and Chief Executive Officer PepsiCo 700 Anderson Hill Road Purchase, NY 10577 Dear Ms. Nooyi: On behalf of Rainforest Action Network, Greenpeace, International
Nestlé Action Plan on the Responsible Sourcing of Cocoa from Côte d Ivoire 29 th June, 2012
 Nestlé Action Plan on the Responsible Sourcing of Cocoa from Côte d Ivoire 29 th June, 2012 Background: On February 29, 2012, Nestlé became the first company in the food industry to partner with the Fair
background info: organic agriculture
 natural/organic food background info: organic agriculture organic farming in Africa There are two levels of organic farming in Africa, certified organic production and non-certified or agro-ecological
Paul Polman Opening Keynote Speech Global Landscapes Forum, COP20, Lima 7 December 2014
 Updated 08/12/2014 10:34 Paul Polman Opening Keynote Speech Global Landscapes Forum, COP20, Lima 7 December 2014 Ladies and Gentlemen, It s a pleasure to be in Lima, to see this fantastic country playing
Fund Council. April 25-26, 2013
 Fund Council 9 th Meeting (FC9) New Delhi, India April 25-26, 2013 Addressing Food Security and Climate Change Through Climate-Smart Agriculture (Working Document - For Discussion Only) Document presented
RSB MONITORING & EVALUATION SYSTEM. Outcome Evaluation Report
 RSB MONITORING & EVALUATION SYSTEM Outcome Evaluation Report 2015 2016 INTRODUCTION The Roundtable on Sustainable Biomaterials (RSB) is a global, multi-stakeholder independent organisation that drives
gebana AG Manual Short Version
 gebana AG Manual Short Version 2 Content, scope and objectives of this Document This is the gebana manual, a guidance document intended to define requirements and processes within the gebana group. This
CHAIN OF CUSTODY GLOSSARY OF TERMS AND DEFINITIONS
 CHAIN OF CUSTODY GLOSSARY OF TERMS AND DEFINITIONS March 2014 Sustainable Agriculture Network and Rainforest Alliance, 2012-2014. This document is available at the following websites: www.sanstandards.org
Forestry and Climate Change Fund
 Forestry and Climate Change Fund Forestry and Climate Change Fund Our founding shareholders: In partnership with: forestry and land use Value Creation From the Ground up Tropical forests are vitally important
the challenge we face
 BioCarbon Fund the challenge we face Rural communities in the developing world depend heavily on productive land and the resources it provides to sustain their livelihoods. With upward population trends
Managing the Root of the Problem
 Managing the Root of the Problem A Discussion Note on Sustainable Agricultural Commodities Andrew Bovarnick and Anna Bexell Green Commodities Facility United Nations Development Programme February 2013
COMMITTEE ON AGRICULTURE
 July 2016 COAG/2016/4 E COMMITTEE ON AGRICULTURE Twenty-fifth Session Rome, 26-30 September 2016 Agriculture and the 2030 Agenda for Sustainable Development Executive Summary The 2030 Agenda for Sustainable
RSPO RSPO NOTIFICATION OF NEW SEEDING PROPOSAL
 RSPO RSPO NOTIFICATION OF NEW SEEDING PROPOSAL Check one as appropriate This is a completely new development and the interested parties may submit their feedback. X This is part of a seeding in progress
The natural source of knowledge Advice, Research & Development in the field of organic and sustainable agriculture, nutrition and health care
 The natural source of knowledge Advice, Research & Development in the field of organic and sustainable agriculture, nutrition and health care The Agro Eco-Louis Bolk Institute is a private organization
Finance for Forests. Progress on the New York Declaration on Forests. Executive Summary - Goals 8 and 9 Assessment Report
 Progress on the New York Declaration on Forests Finance for Forests Executive Summary - Goals 8 and 9 Assessment Report October 2017 forestdeclaration.org Executive Summary In September 2014, the New York
Fairtrade International Monitoring Evaluation and Learning Programme ISEAL Impacts Code Public System Report January Executive Summary 2
 Fairtrade International Monitoring Evaluation and Learning Programme ISEAL Impacts Code Public System Report January 2017 Contents 1. Executive Summary 2 2. Scope and Boundaries of the Fairtrade MEL System
Selva Shrimp A Sustainable Aquaculture Program by Blueyou Consulting. Selva. Shrimp. The Sustainable. Shrimp. Premium Black Tiger Prawns. Choice!
 Selva Shrimp A Sustainable Aquaculture Program by Blueyou Consulting Selva Shrimp Premium Black Tiger Prawns The Sustainable Shrimp Choice! The Sustainable Shrimp Choice Selva Shrimp are premium-quality
Interpretations for the SFI Standards and Rules. April 2018
 Interpretations for the SFI 2015-2019 Standards and Rules April 2018 Official SFI Standard Interpretations contained in this document are auditable requirements 1 Table of Contents Table of Contents...
safa Nadia El-Hage Scialabba Food and Agriculture Organization of the United Nations, Rome, Italy
 Towards Sustainable Food Systems Multi-stakeholder Engagement for Action FAO, Rome, 18 October 2013 Nadia El-Hage Scialabba Food and Agriculture Organization of the United Nations, Rome, Italy ABOUT SUSTAINABILITY
Reforestation and Improved Forest Management in Uganda
 Reforestation and Improved Forest Management in Uganda Beyond Carbon, Uganda 2014 Project summary This community led initiative promotes sustainable management of forestry resources encouraging smallscale
safa Nadia El-Hage Scialabba Food and Agriculture Organization of the United Nations, Rome, Italy
 Towards Sustainable Food Systems Multi-stakeholder Engagement for Action FAO, Rome, 18 October 2013 Nadia El-Hage Scialabba Food and Agriculture Organization of the United Nations, Rome, Italy ABOUT SUSTAINABILITY
Disaster Risk Programme to strengthen resilience in the Dry Corridor in Central America
 Disaster Risk Programme to strengthen resilience in the Dry Corridor in Central America El Salvador-Guatemala Honduras-Nicaragua 2015-2018 FAO/Orlando Sierra CONTEXT Central America is one of the regions
Cotton made in Africa
 Cotton made in Africa Aggregated Verification Report 2016 Content 1. Introduction...2 2. Performance Results...3 2.1 Exclusion Criteria...3 2.2 Farm Level Development Criteria...3 2.2.1 Continuous Improvement
Carbon Neutral Platforms
 Carbon Neutral Platforms Carbon friendly to carbon neutral. This is the Supply Change. The opportunity: Doing the right thing for the environment often runs counter to doing the right thing for your business.
SOMMAIRE CORPORATE SOCIAL RESPONSIBILITY SECTOR POLICY PALM OIL. Preamble... 2
 CORPORATE SOCIAL RESPONSIBILITY SECTOR POLICY PALM OIL SOMMAIRE Preamble... 2 1. Sector Policy... 3 a) Objective...3 b) Scope...3 c) Context and limits of the policy...3 d) Group-level implementation mechanisms...4
Global Food Security Initiative Africa Regional Forum March 2013 Dakar, Senegal FINAL REPORT
 Global Food Security Initiative Africa Regional Forum 11-12 March 2013 Dakar, Senegal FINAL REPORT 4 RAPPORT FINAL On March 11-12, the Global Food Security Initiative (GFSI) held its first Africa Regional
Regione Marche. Development Programme Non techincal summary. Roma, June 2015
 Regione Marche Environmental COMMITTENTE Report of the Rural Development Programme 2014-2020 Roma, June 2015 Non techincal summary INDICE 1 NON TECHNICAL SUMMARY... 3 1.1 Programme description... 3 1.1.1
Guide for designing and documenting a social and environmental management system. Sustainable Agriculture Standards, Sustainable Agricultural Network
 Guide for designing and documenting a social and environmental management system Sustainable Agriculture Standards, Sustainable Agricultural Network This material is a production of the regional project
A Comparison of the American Forest & Paper Association s Sustainable Forestry Initiative and the Forest Stewardship Council s Certification System
 A Comparison of the American Forest & Paper Association s Sustainable Forestry Initiative and the Forest Stewardship Council s Certification System June 2001 National Wildlife Federation Natural Resources