Agriculture Commodity Markets & Trends
|
|
|
- Oswin Jonathan Mason
- 6 years ago
- Views:
Transcription

1 Agriculture Commodity Markets & Trends
2 Agenda Short History of Agriculture Commodities US & World Supply and Demand Commodity Prices Continuous Charts What is Contango and Backwardation Barge, Truck and Rail movements Alternative Storage possibilities Importance of US flows to Mexico Price outlook 2


3 Short History of Wheat, Corn, Rice and Beans Wheat Is a grass grown on more land area than any other food crop. World production in reached 753 mio tons. Production has grown due higher yields in past years. Used mostly for Bread, Pasta, Cuscus but also used as a Feed Grain. Main producers: EU , China 130, India 96, Russian Federation 81.0 USA 47.3, Canada 26.5, Pakistan, 26.2, Australia 22.5, Ukraine 25.5, Turkey 18.0 Argentina 17.5 Main exporters: EU-28.5, Russian Federation 32.5, USA 26.5, Canada 20.5, Australia 18.5 Ukraine 16.5 and Argentina 11.5 Main importing countries: Egypt 11.8, Indonesia 8.5, Algeria 8.2, EU 6.5, Brazil 6.2, Japan 5.8, Republic of Korea 5.0, Morocco, 5.0, Philippines 5.0, Turkey 5.0, Bangladesh, 4.7, Mexico 4.6, Nigeria 4.4, Thailand 3.6, Saudi Arabia, China 3.5 and US 3.4 (from Canada). Corn History of corn began around BC in southern Mexico with a domestic wild form of Maize. Main usage is for Feed, Starch, Corn Flour used in Tortillas or Arepas, Corn oil for human consumption and Ethanol.. US production is roughly used as follows: Ethanol 37% Food, Seed and Industrial 48% (of which 10% food+seed) Exports 15% 85% of US market is domestically and only 15% depend on export mainly to neighboring Mexico, 7.5 mio tons, Japan 7.2 mio, Colombia 3.4, South Kora 3.1, Taiwan 2.0, Peru 1.8, Saudi Arabia 1.6, Dominica Republic 0.5, Morocco 0.5 and Guatemala 0.5. Main producers: US 360.3, China 215.0, Brazil 95.0, EU 60.0, Argentina 42.0, Ukraine 27.5, India 25.0 Mexico 26.0 and Russian Federation 47.7 Main exporters: US 47.6, Brazil 34.0, Argentina 28.5, Ukraine 22.0 Russian Federation

4 Rice Rice as a Cereal Grain is most widely consumed as a staple food for a large part of the world, especially in Asia. Rice can be grown in a wide areas and practically anywhere but does need lots of rainfall and very labor-intensive. Reason why most of the production if seen in Asia and certain parts of Africa. Rice is a seed of grass and is the third highest worldwide production after sugarcane and maize. History of it goes as far back as 2,500 BC beginning in China and surrounding areas as well as India and Sri Lanka. Main Rice producers: China mio tons, India 110, Indonesia 37.0, Bangladesh 33.5, Vietnam 28.45, Thailand 20.4, Myanmar 12.5, Philippines 11.2, Brazil 8.0, Japan 7.7, US Exporters: India 11.8 mio tons, Thailand 10.0, Vietnam 6.0, Pakistan 4.1, US 3.5, Myanmar 1.5, and Cambodia 1.0 Imports: China 5.0, Nigeria 2.1, Philippines 1.8, Saudi Arabia 1.4 and Senegal 1.0. Soybean History of Soybean goes as far back as eleventh century BC in China. Main usage has been to process for Oil and Protein for the animal feed industry. Smaller amount is being used for soy milks flour and Tofu. Main producers: USA 120.5mio tons, Brazil 107, Argentina 57.0, China 14.0 and Paraguay 9.40 Exporters: USA 61.2, Brazil 64.0, Argentina 8.0 and Paraguay 5.5 Imports: China 95.0, EU 14.5, Japan 3.3 and Mexico 4.3, EU 1.8, Mexico 0.8, Japan 0.69 and Colombia
5 World Production Wheat India 96 mio, Russia 77.5K, Ukraine 26.5, US 47.3, Australia 23.5 Canada 26.5 and Argentina 17.5 Corn US mio tons, China 215, Brazil 95, Argentina 40, Ukraine 28, Mexico25, India 25, Canada 13.9, Russia 16.5 and South Africa

6 World Production Rice Asia being biggest market China 145 mio tons, India 108, Indonesia 37, Brazil 8 mio and US only 5.92 Soybean Mayor production in US and South America with latter having grown in past years.(brazil 107, Argentina 57, Paraguay 9.4, Bolivia 3.0). 6
7 Situation of US planted area in Grains US Planted Acres in Agriculture Commodities Commodity June 30/17 previous Year ago Diff./ last year Percentage Corn (3.12) -3.32% Sorghum (0.70) % Soybeans % All Wheat (5.14) % Winter Wheat (3.66) % HRW (2.70) % SRW (0.97) % WW % Durum (0.49) % Other Spring (0.71) -6.08% PS: Lowest all wheat planted area on record since 1919! 7
8 US Acres planted / harvested Wheat Corn 8
9 Spring and Durum Acres Other Spring Wheat Durum 9
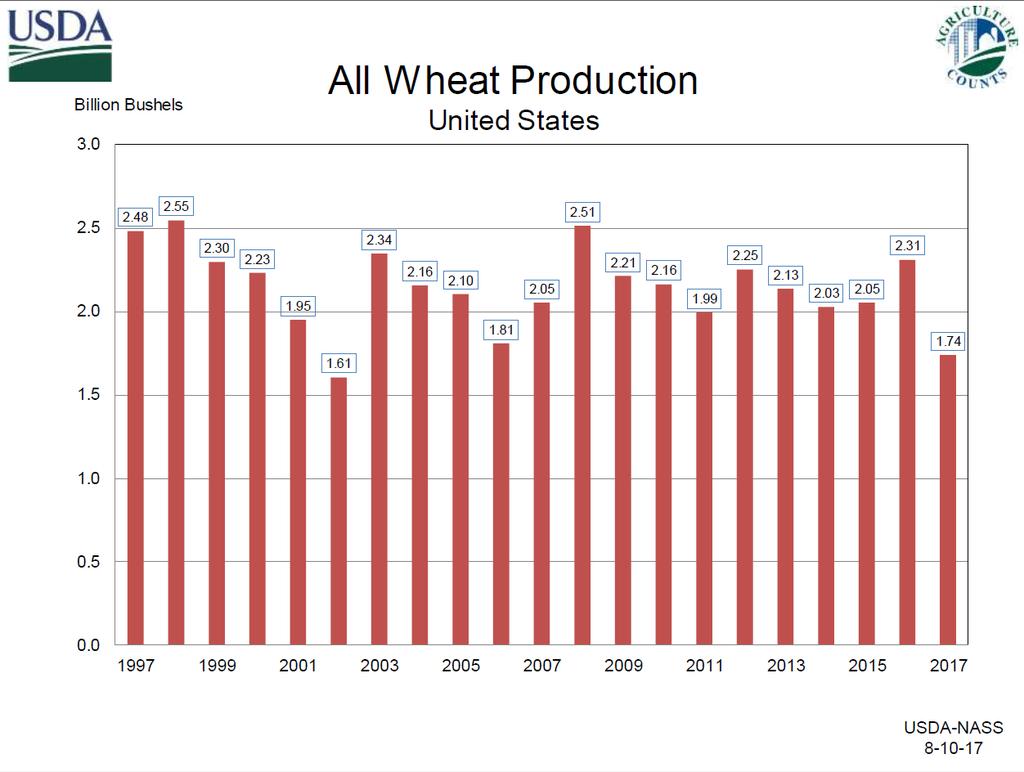
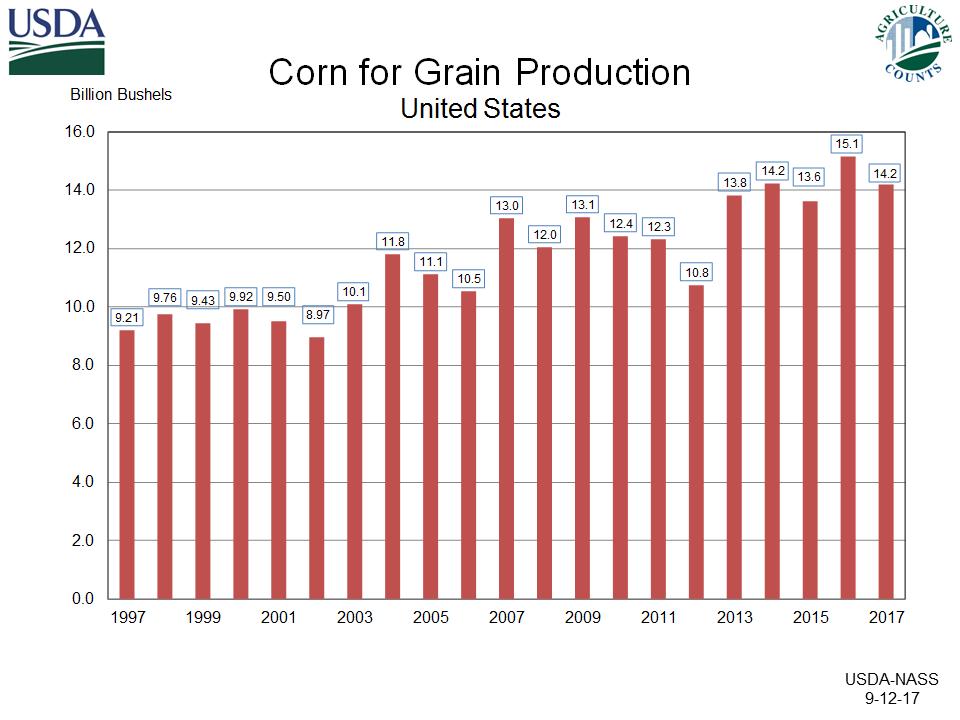
10 US Production Wheat Corn 10
11 US Acres planted / harvested Rice Soybean 11

12 US Production Rice Soybean 12

13 Commodity Prices 13
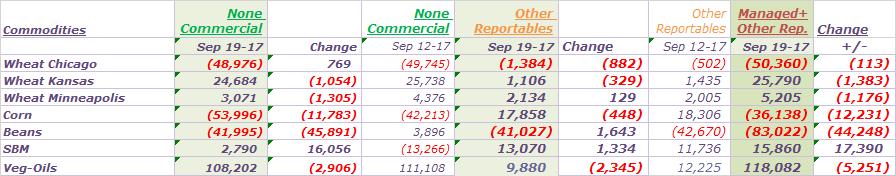
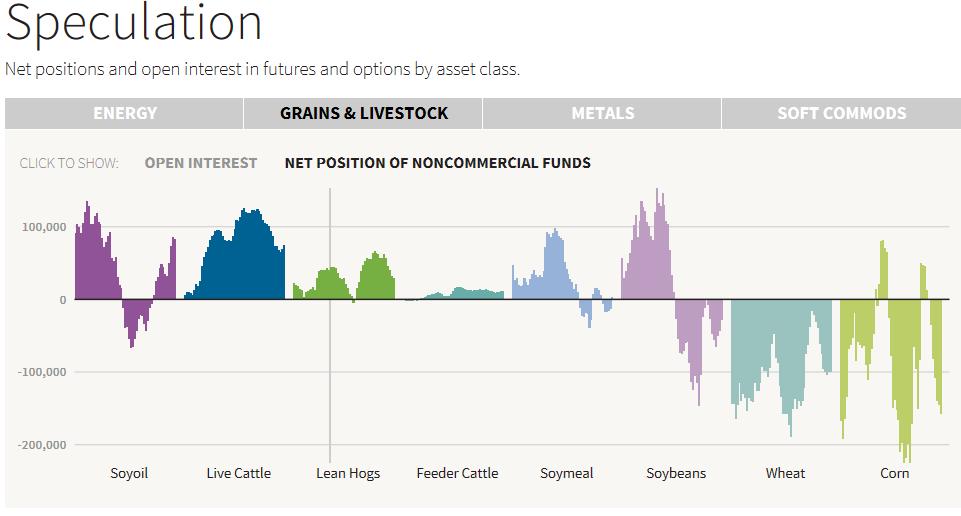
14 Commitments of Traders Report (CFTC) 14
15 Carry versus Inverted Market - Carry futures Market Cost of carrying the grain (storage + Interest) reflected in price. Nearby price is cheapest compared the deferred months. Jan Mch May July Sep Dec Inverted futures Market Nearby prices are at a premium the deferred. More demand / squeeze from prompt shipment. Ample supply or new crop on deferred positions. Jan Mch May July Sep Dec


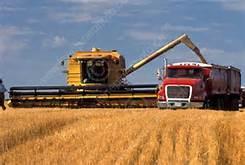
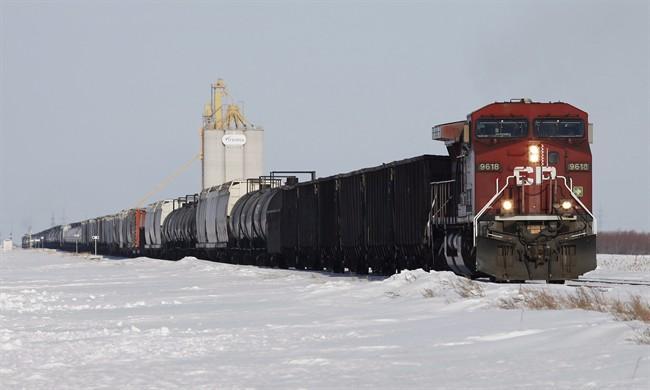
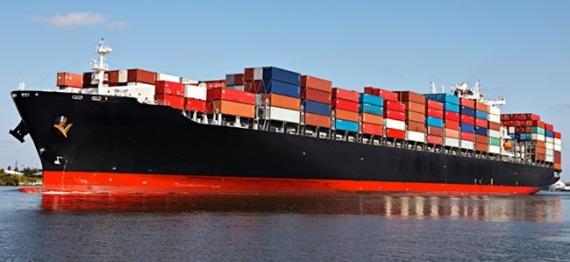

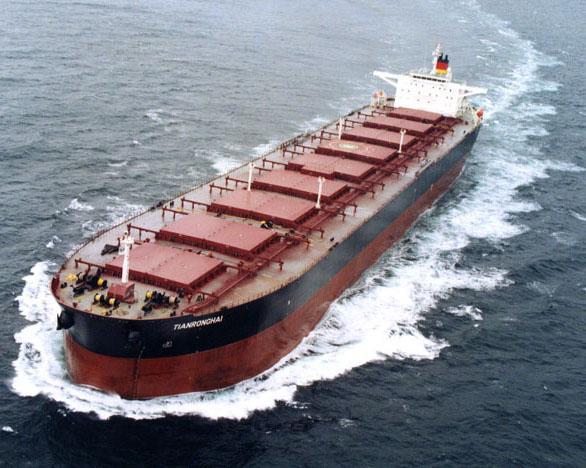
16 Movements by Barge, Truck and Rail, Container, Ocean-Freight 16


17 Cheap Storage Alternative Silo Bag loading and field storage Silo Bag loading operation 17


18 Barge and Rail Network 18

19 NAFTA with Mexico Agricultural imports to Mexico depend heavily on US commodities Total Imports from US Corn Sorghum Wheat DDGS Rice Beans Soybean Meal Veg-Oil


20 Overall Trade Stats with US Biggest Trade Partners with US US Agriculture Exports to Mexico 20
21 Continuous Chicago Wheat Chart 21

22 Continuous Corn Chart 22

23 Continuous Soybean Chart 23
24 Continuous Rice Chart 24

25 Baltic Dry Index 25

26 Price Outlook in Agriculture Commodities Strong US Dollar has had a negative impact on Commodity prices in the past years but things are changing. US lost ground against the major currencies in value since the April this year. Increased overall yields due more use of fertilizer and improvement in seeds as been another bearish factor. Increased South American participation in Soybeans and Corn and Wheat from the Black Sea region have helped to increase World Production whereas demand remained stagnant. Weather has been rough in Southern Europe (extremely hot temperature) and similar situation in Northern US impacting mainly the Spring Wheat. Farmers shift crops less Wheat more Oilseeds (Beans) + Corn. (This especially from South America. We are at historically low prices but longer term trend in Wheat looks as though has been broken to the upside. Rice has recuperated quite a bit from lows a trend has been friendly. Corn + Beans remain bearish. Expected Price Range in coming 6-8months Wheat WH Consider lows are in present prices and $ drawing last Fibonacci from recent highs. Corn CH Should get some South American Weather $ impact sooner or later. Lows consider are in present price levels. Beans SH Might see some more US harvest pressure. $ Then possible South American Weather impact like on Corn. Rice RRH Short term over-bought but all depends on $ New Crop Asia. Demand keeps rising. 26

27 For any further information and in case you would like a copy of the presentation please let me know by . Christoph Bigler Trading Grains Director Bunge Mexico Christoph.Bigler@Bunge.com =
INTERNATIONAL GRAINS COUNCIL
 INTERNATIONAL GRAINS COUNCIL GRAIN MARKET REPORT www.igc.int GMR No. 420 2 April 2012 WORLD ESTIMATES million tons 08/09 09/10 10/11 11/12 12/13 est forecast proj 23.02 02.04 02.04 WHEAT Production 685
U.S. Rice Growers Face Higher Prices and Tighter Supplies in 2017/18
 U.S. Rice Growers Face Higher Prices and Tighter Supplies in 217/18 217 Rice Outlook Conference December 12, 217 Nathan Childs Economic Research Service USDA Approved by the World Agricultural Outlook
U.S. Rice Market Faces Tighter Supplies and Higher Prices in 2017/18
 U.S. Rice Market Faces Tighter Supplies and Higher Prices in 217/18 University of Arkansas Webinar Series October 26, 217 Nathan Childs Economic Research Service USDA Approved by the World Agricultural
Friday Aug 10, 2012 World Ag Supply & Demand Report
 Friday Aug 10, 2012 World Ag Supply & Demand Report U.S. 2011/12 Old Crop Corn is Supportive Global Old Crop Corn is Slightly Bearish USDA estimates the 2011/12 U.S. corn carryout at 1,021 million bushels,
August 10, USDA World Supply and Demand Estimates
 August 10, 2017 - USDA World Supply and Demand Estimates Corn Market Reaction: September 2017 corn futures closed down 15 cents at $3.57 ¼ with a trading range for the day of $3.56 ½ to $3.75 ½. December
June 12, USDA World Supply and Demand Estimates
 June 12, 2018 - USDA World Supply and Demand Estimates Corn Market Reaction: July 2018 corn futures closed up 10 ¼ cents at $3.77 ½ with a trading range for the day of $3.67 ¼ to $3.79 ½. December 2018
Sugar: World Markets and Trade
 United States Department of Agriculture Foreign Agricultural Service Sugar: World Markets and Trade May 218 Elevated in 218/19 Keeps Stocks High, Pressuring Prices Ending Stocks 2 18 16 14 12 1 8 6 4 Other
Global Agricultural Supply and Demand: Factors contributing to recent increases in food commodity prices
 Global Agricultural Supply and Demand: Factors contributing to recent increases in food commodity prices Ron Trostle Economic Research Service U.S. Department of Agriculture Agricultural Markets and Food
September 12, USDA World Supply and Demand Estimates
 September 12, 2018 - USDA World Supply and Demand Estimates Corn Market Reaction: December 2018 corn futures closed down 14 ¼ cents at $3.52 ½ with a trading range for the day of $3.50 ¾ to $3.66 ¼. December
MARKET OUTLOOK REPORT Volume 2 Number 1
 MARKET OUTLOOK REPORT Volume 2 Number 1 WHEAT: SITUATION AND OUTLOOK April 1, 2010 Prepared by: Market Analysis Group Grains and Oilseeds Division Food Value Chain Bureau Market and Industry Services Branch
Factors Affecting Global Agricultural Markets. Fred Giles Director, Agricultural Trade Office USDA / SP
 Factors Affecting Global Agricultural Markets Fred Giles Director, Agricultural Trade Office USDA / SP Factors Impacting Global Agricultural Markets Commodity Prices Energy Prices Value of the U.S. Dollar
May 12, Dear Subscriber: We will be adding material to this shell letter after todays reports are released at 11:00 a.m.
 May 12, 2015 Dear Subscriber: We will be adding material to this shell letter after todays reports are released at 11:00 a.m. Be sure to click back on the link often for the latest information. Whle today
Cereals market situation. Committee for the Common Organisation of Agricultural Markets. 30 th August 2018
 Cereals market situation Committee for the Common Organisation of Agricultural Markets 30 th August 2018 Exchange Rates 2 Euro US Dollar exchange rate 3 Euro Argentine Peso and Brazilian Real exchange
U.S. Rice Market Faces Larger Supplies and Lower Prices in 2018/19; Global Trade Projected Another Record High
 U.S. Rice Market Faces Larger Supplies and Lower Prices in 218/19; Global Trade Projected Another Record High 218 Rice Outlook Conference December 5-7, 218 Nathan Childs Economic Research Service USDA
May 10, USDA World Supply and Demand Estimates
 May 10, 2018 - USDA World Supply and Demand Estimates Corn Market Reaction: July 2018 corn futures closed down ¾ cent at $4.02 with a trading range for the day of $4.00 to $4.07. December 2018 corn futures
Wednesday July 11, 2012 World Ag Supply & Demand Report
 World Ag Supply & Demand Report U.S. 2011/12 Old Crop Corn is neutral Global Old Crop Corn is neutral USDA estimates the 2011/12 U.S. corn carryout at 903 million bushels, up from 851 million bushels from
World Agricultural Outlook Board Interagency Commodity Estimates Committee Forecasts. Lockup Briefing April 9, 2014
 World Agricultural Outlook Board Interagency Commodity Estimates Committee Forecasts Lockup Briefing World Wheat Production Country or Region Million Tons World 656.5 712.5 8.5 United States 61.7 58.0-6.0
August 16 th, DDGS/cash corn value stands at 106 percent of its two-year average. INSIDE THIS ISSUE. General Comments:
 INSIDE THIS ISSUE 1. General Comments 2. DDGS Reference Prices 3. Ocean Freight Markets 3. Latest Export Figures (Calendar and Crop Year) 6. FOB US Gulf DDGS & Corn Prices 7. Council News DDGS/cash corn
Global market trends and grain flows
 Global market trends and grain flows GTA Advisory & Compliance Workshop Melbourne 28/7/14 A global perspective Prices driven offshore price discovery starts offshore Understanding broad trends critical
January 12, USDA World Supply and Demand Estimates
 January 12, 2018 - USDA World Supply and Demand Estimates Corn Market Reaction: March 2018 corn futures closed down 2 ½ cents at $3.46 ¼ with a trading range for the day of $3.45 ½ to $3.50. December 2018
Developments and challenges in commodity markets: current situation and outlook- Agricultural Commodities
 Multi-year Expert Meeting on COMMODITIES AND DEVELOPMENT 23-25 March 211, Geneva Developments and challenges in commodity markets: current situation and outlook- Agricultural Commodities by Mr. Etsuo Kitahara,
Sugar: World Markets and Trade
 United States Department of Agriculture Foreign Agricultural Service November 2018 Sugar: World Markets and Trade Record Stocks and Consumption Despite Lower Production 205 185 Production Consumption Stocks
2016 Risk and Profit Conference General Session Speakers. GENERAL SESSION IV Grain Market Situation and Outlook
 2016 Risk and Profit Conference General Session Speakers GENERAL SESSION IV Grain Market Situation and Outlook Dan O Brien, Kansas State University Daniel O Brien was raised on a grain and livestock farm
2/19/2014. Bunge North America. Highlights of the Past 12 Months. US Weather
 Bunge North America Flat Price Risk Virginia State Feed Association Conference And Nutritional Management Cow College February 2014 Foreign Currency Commercials/Funds (Boards of Trade) Freight Weather
Rice Outlook and Baseline Projections. University of Arkansas Webinar Series February 13, 2015 Nathan Childs, Economic Research Service, USDA
 Rice Outlook and Baseline Projections University of Arkansas Webinar Series February 13, 2015 Nathan Childs, Economic Research Service, USDA THE GLOBAL RICE MARKET PART 1 The 2014/15 Global Rice Market:
December 12, USDA World Supply and Demand Estimates
 December 12, 2017 - USDA World Supply and Demand Estimates Corn Market Reaction: March 2018 corn futures closed down 1 ¼ cents at $3.47 ¾ with a trading range for the day of $3.47 ½ to $3.53. December
WORLD AGRICULTURAL SUPPLY AND DEMAND ESTIMATES
 WORLD AGRICULTURAL SUPPLY AND DEMAND ESTIMATES United States Department of Agriculture Washington, D.C. Approved by the World Agricultural Outlook Board WASDE-339 - June 12, 1998 NOTE Because planting
World Agricultural Outlook Board Interagency Commodity Estimates Committee Forecasts. Lockup Briefing July 11, 2014
 World Agricultural Outlook Board Interagency Commodity Estimates Committee Forecasts Lockup Briefing World Wheat Production Country or Region estimate 2014/15 forecast June 11 Million Tons Percent Percent
MARKET OUTLOOK REPORT Volume 1 Number 1
 MARKET OUTLOOK REPORT Volume 1 Number 1 WHEAT: SITUATION AND OUTLOOK April 17, 2009 Prepared by: Market Analysis Group Grains and Oilseeds Division Food Value Chain Bureau Market and Industry Services
Food Markets Wheat & Maize Outlook 2018/19
 Food Markets Wheat & Maize Outlook THIRTEENTH SESSION OF THE AMIS GLOBAL FOOD MARKET INFORMATION GROUP FAO Headquarters, Rome 3-4 May 2018 Presentation Outline I. Macro conditions & food markets II. Market
World Agricultural Outlook Board Interagency Commodity Estimates Committee Forecasts. Lockup Briefing June 11, 2014
 World Agricultural Outlook Board Interagency Commodity Estimates Committee Forecasts Lockup Briefing World Wheat Production Country or Region 2014/15 Million Tons World 714.0 701.6 0.7-1.7 United States
World Grains and Oilseeds: Recent Trends and Perspectives. Agribusiness in Argentina A seminar on Investment Opportunities London 14 December 2011
 www. IGC 2011 World Grains and Oilseeds: Recent Trends and Perspectives Agribusiness in Argentina A seminar on Investment Opportunities London 14 December 2011 Darren Cooper Senior Economist International
Improvement in global production and a gradual recovery in ending stocks over the past three years have allowed the global wheat market to balance at
 Wheat Improvement in global production and a gradual recovery in ending stocks over the past three years have allowed the global wheat market to balance at much lower prices than in the 2007/08 to 2012/13
Market situation Cereals. AGRI C 5 Advisory Group on Cereals, Oilseeds and Proteins 30 March 2012
 Market situation Cereals AGRI C 5 Advisory Group on Cereals, Oilseeds and Proteins 30 March 2012 World cereal balance : IGC 1000 900 World Ending Stocks of which 8 major exporters World Production World
Contact: Dante Manocchio Richardson International
 The following information was presented at the 2015 Cereals & Oilseeds Workshop on Feb 25, 2015 and should not be copied or reproduced without permission from the author. Contact: Dante Manocchio Richardson
Fresh Deciduous Fruit (Apples, Pears, and Grapes): World Markets and Trade
: World Markets and Trade") Fresh Deciduous Fruit (Apples, Pears, and Grapes): World Markets and Trade June 9 SUMMARY Global apple production is expected to expand percent and trade is expected to surge 5 percent in 8/9 due to strong
Fresh Deciduous Fruit (Apples, Pears, and Grapes): World Markets and Trade June 9 SUMMARY Global apple production is expected to expand percent and trade is expected to surge 5 percent in 8/9 due to strong
Wheat Outlook. Economic Research Service September 16, Approved by the World Agricultural Outlook Board
 Wheat Outlook Economic Research Service September 16, 008 U.S. Department of Agriculture WHS-08ht text and tables Approved by the World Agricultural Outlook Board Larger Production and Beginning Stocks
World Agricultural Supply and Demand Estimates
 World Agricultural Supply and Demand Estimates Report of Interagency Commodity Estimates Committee Forecasts World Agricultural Outlook Board, Chairing Agency Economic Research Service Foreign Agricultural
Low prices last year induced a decline in global wheat area, and as a result production increased less than 1%, helping to support an expected price i
 Wheat Low prices last year induced a decline in global wheat area, and as a result production increased less than 1%, helping to support an expected price increase in 2017/18. It is expected that prices
Interpreting Maps, Charts, and Graphs
 Interpreting Maps, Charts, and Graphs Crop Hearths (pg. 348) # s 1-5 1. The map of crop hearths indicates that a. coconuts, pigeonpeas, maize, and tomatoes were first domesticated in Southeast Asia. b.
Global Sugar Consumption Expands While Production Stagnates
 United States Department of Agriculture Foreign Agricultural Service Sugar: World Markets and Trade Global Sugar Consumption Expands While Production Stagnates 180 Million Metric Tons, Raw Value 170 160
World Agricultural Outlook Board Interagency Commodity Estimates Committee Forecasts. Lockup Briefing March 10, 2014
 World Agricultural Outlook Board Interagency Commodity Estimates Committee Forecasts Lockup Briefing World Wheat Production Country or Region 2013/14 Million Tons World 656.4 712.7 0.1 8.6 United States
World Agricultural Supply And Demand Estimates
 World Agricultural Supply And Demand Estimates United States Department of Agriculture Office of the Chief Economist Agricultural Marketing Service Economic Research Service Farm Service Agency Foreign
Global and U.S. Rice Markets Face Tighter Supplies in 2015/16
 Global and U.S. Rice Markets Face Tighter Supplies in 2015/16 University of Arkansas Webinar Series November 19, 2015 Nathan Childs, Economic Research Service, USDA 11.20.15 PART 1 THE 2015/16 GLOBAL RICE
January 12, USDA World Supply and Demand Estimates
 January 12, 2017 - USDA World Supply and Demand Estimates Corn This month s U.S. corn outlook is for lower production, reduced feed and residual use, increased corn used to produce ethanol, and smaller
Market Overview. AAAC Outlook Day. Matt Rutter PREPARED FOR:
 Market Overview AAAC Outlook Day PREPARED FOR: Matt Rutter Gavilon Grain Australia Gavilon is a leading commodity management firm, connecting producers and consumers of feed, food and fuel in the U.S.
World Agricultural Supply And Demand Estimates
 United States Department of Agriculture Office of the Chief Economist World Agricultural Supply And Demand Estimates Agricultural Marketing Service Economic Research Service Farm Service Agency Foreign
Total Net Exports 105, , , , , , , , , , ,153
 Wheat Trade Net Exporters Argentina 7,495 6,454 7,206 6,988 7,144 7,205 7,343 7,492 7,737 7,766 7,711 Australia 18,900 20,066 20,021 20,047 20,254 20,486 20,827 21,027 21,262 21,494 21,619 Canada 17,600
Grain: World Markets and Trade
 e 218 Department of Agriculture Foreign Agricultural Service Grain: World Markets and Trade 3 28 26 24 Southeast Asia and Sub-Saharan Africa Now Top Wheat Importers MMT 22 2 18 16 14 12 1 Southeast Asia
June 9, USDA World Supply and Demand Estimates
 June 9, 2017 - USDA World Supply and Demand Estimates Corn Market Reaction: July 2017 corn futures closed up 2 cents at $3.87 ¾ with a trading range for the day of $3.80 ¾ to $3.89 ½. December 2017 corn
January 9, 2014 WE WILL BE UPDATING AND ADDING MATERIAL THROUGHOUT THE DAY ON JANUARY 10 TO THIS LETTER BEGINNING AT 11:00 AM CST.
 January 9, 2014 WE WILL BE UPDATING AND ADDING MATERIAL THROUGHOUT THE DAY ON JANUARY 10 TO THIS LETTER BEGINNING AT 11:00 AM CST. PLEASE CHECK BACK OFTEN THROUGHOUT THE DAY FOR THE LATEST INFORMATION!
World Wheat Supply and Demand. Crop Quality Seminars 2013 Ian Flagg
 World Wheat Supply and Demand Crop Quality Seminars 2013 Ian Flagg Beginning Stocks 250 200 Exporter beginning stocks down 35% from 5-year average 199 199 174 150 125 100 83 122 50 0 27 14 14 32 48 38
U.S. Agricultural Trade: Trends, Composition, Direction, and Policy
 U.S. Agricultural Trade: Trends, Composition, Direction, and Policy Charles E. Hanrahan Senior Specialist in Agricultural Policy Carol Canada Information Research Specialist Beverly A. Banks Acquisitions
April 9, Dear Subscriber: We will be adding material to this shell letter after todays reports are released at 11:00 a.m.
 April 9, 2015 Dear Subscriber: We will be adding material to this shell letter after todays reports are released at 11:00 a.m. Be sure to click back on the link often for the latest information. While
World Sorghum Grain Producers
 World Sorghum Grain Producers Million Metric Tons 18 16 14 12 12 10 8 6 7 7 6 6 4 4 4 3 2 2 2 2 0 14 MY 2014/15 MY 2015/16 MY 2016/17 Grain Sorghum Exporters Million Metric Tons 10 9 8 7 6 5 4 3 2 1 0
World Agricultural Supply And Demand Estimates
 World Agricultural Supply And Demand Estimates United States Department of Agriculture Office of the Chief Economist Agricultural Marketing Service Economic Research Service Farm Service Agency Foreign
World Agricultural Supply And Demand Estimates
 United States Department of Agriculture Office of the Chief Economist World Agricultural Supply And Demand Estimates Agricultural Marketing Service Economic Research Service Farm Service Agency Foreign
World Agricultural Supply And Demand Estimates
 World Agricultural Supply And Demand Estimates United States Department of Agriculture Office of the Chief Economist Agricultural Marketing Service Economic Research Service Farm Service Agency Foreign
Monitoring production of main producing countries
 Monitoring production of main producing countries Bruno Buffaria HoU Arable Crops European Commission Directorate General for Agriculture and Rural Development AGRISAT workshop, 13/10/2010 13-14 Oct 2010
April 9, Dear Subscriber:
 April 9, 2014 Dear Subscriber: We will be adding material to this shell letter after the report is released on April 9, 2014 at 11:00 a.m CST. Be sure to click back on the link often for the latest information.
Market situation. Projection highlights CEREALS
 3. COMMODITY SNAPSHOTS Market situation CEREALS Global supplies of major cereals continued to exceed overall demand, leading to a significant build-up of inventories and much lower prices on international
Wheat Outlook. Economic Research Service August 14, Approved by the World Agricultural Outlook Board
 Wheat Outlook Economic Research Service August 14, 008 U.S. Department of Agriculture WHS-08gt text and tables Approved by the World Agricultural Outlook Board U.S. Wheat Production Nearly Unchanged From
Implications for commodity prices and farm income
 Implications for commodity prices and farm income Mike Dwyer Director, Global Policy Analysis Office of Global Analysis Foreign Agricultural Service US Department of Agriculture Mike.Dwyer@fas.usda.gov
Vietnam. Grain and Feed Update. October 2012
 THIS REPORT CONTAINS ASSESSMENTS OF COMMODITY AND TRADE ISSUES MADE BY USDA STAFF AND NOT NECESSARILY STATEMENTS OF OFFICIAL U.S. GOVERNMENT POLICY Required Report - public distribution Vietnam Grain and
World Agricultural Supply And Demand Estimates
 United States Department of Agriculture Office of the Chief Economist World Agricultural Supply And Demand Estimates Agricultural Marketing Service Economic Research Service Farm Service Agency Foreign
KC FED Agriculture Infrastructure Investor Perspective. Chris Erickson Managing Director HighQuest Partners, LLC July 2013
 KC FED Agriculture Infrastructure Investor Perspective Chris Erickson Managing Director HighQuest Partners, LLC July 2013 Global Supply and Demand 1 Global Soybean Supply and Demand 1,000 MT 350,000 300,000
World Agricultural Outlook Board Interagency Commodity Estimates Committee Forecasts. May 9, 2014
 World Agricultural Outlook Board Interagency Commodity Estimates Committee Forecasts World Wheat Production Country or Region Million Tons 2014/15 World 714.0 697.0-2.4 United States 58.0 53.4-7.8 Foreign
USDA WASDE Report. Friday April 9 th 2010 World AG Supply & Demand Estimates. Office Friday April 09, 2010
 Friday April 9 th 2010 World AG Supply & Demand Estimates The trade was expecting the new carry out to incorporate additional stocks resulting from the March 31 grain stocks report which was not reflected
Summary of WASDE and Production USDA
 Summary of WASDE and Production USDA The following information are summary and extracts from the latest, AUG 2016, WASDE and World Agricultural Production reports provided by the United States Department
United Nations Conference on Trade and Development
 United Nations Conference on Trade and Development 1th MULTI-YEAR EXPERT MEETING ON COMMODITIES AND DEVELOPMENT 25-26 April 218, Geneva Assessing the recent past and prospects for grains and oilseeds markets
World Agricultural Supply And Demand Estimates
 United States Department of Agriculture Office of the Chief Economist World Agricultural Supply And Demand Estimates Agricultural Marketing Service Economic Research Service Farm Service Agency Foreign
2019 Grain Market Outlook
 2019 Grain Market Outlook 2018 Ag Lenders Conferences Garden City & Manhattan, Kansas October 9-10, 2018 DANIEL O BRIEN EXTENSION AGRICULTURAL ECONOMIST Topics to be discussed.. 1) U.S. Foreign Trade Uncertainty
Market Monitor Number 9 June 2013
 Market Monitor Number 9 June 2013 AMIS Crops: World Supply-Demand Outlook First forecasts for 2013/14 marketing seasons Early indications for world wheat, maize and rice production in 2013 point to record
Office: (701) Cell: (701)
 Cell: (701)") ALLISON THOMPSON Commodity Broker/Market Analyst allison@themoneyfarm.com Office: (701) 347-5985 Cell: (701) 520-4791 1 2 AGENDA What s in the market? Shut down, China, USDA, Exports, Implications, Weather
ALLISON THOMPSON Commodity Broker/Market Analyst allison@themoneyfarm.com Office: (701) 347-5985 Cell: (701) 520-4791 1 2 AGENDA What s in the market? Shut down, China, USDA, Exports, Implications, Weather
Grain: World Markets and Trade
 y 218 Department of Agriculture Foreign Agricultural Service Grain: World Markets and Trade Near-Record U.S. Corn Exports in 217/18 Monthly Exports Annual Exports (Oct-Sep) 8 7 MMT 7 6 4 3 2 1 3yr average
2019 Grain Market Outlook
 2019 Grain Market Outlook Ness City, Kansas January 7, 2019 DANIEL O BRIEN EXTENSION AGRICULTURAL ECONOMIST Topics to be discussed.. 1) Macroconomic forces at work in the U.S. & where they are taking U.S.
Growers who hedge now should cover the upside with call options, say selling a December SRW $6.20 call to pay for a $5.20.
 Wheat market tries to get its mojo back Tighter global supplies should boost U.S. export hopes By Bryce Knorr, Senior Grain Market Analyst In a world without noise, the wheat market would be ready to rally.
[Деловое общение] Grain and SBM Market Research Daniel Trading SA
![[Деловое общение] Grain and SBM Market Research Daniel Trading SA](/thumbs/82/86580339.jpg "[Деловое общение] Grain and SBM Market Research Daniel Trading SA") [Деловое общение] Grain and SBM Market Research [Название April организации] 27 Daniel Trading SA Global positioning of Ukrainian agricultural market Production 7% 6% 7% #4 #6 #8 3% 2% 3% 3% 4% 4% 4/5
[Деловое общение] Grain and SBM Market Research [Название April организации] 27 Daniel Trading SA Global positioning of Ukrainian agricultural market Production 7% 6% 7% #4 #6 #8 3% 2% 3% 3% 4% 4% 4/5
Rice: Global Competitiveness of the U.S. Rice Industry
 Rice: Global Competitiveness of the U.S. Rice Industry October 7, 2015 Disclaimer: The views expressed here are those of the presenters, and do not necessarily represent those of any individual Commissioner
Idaho Wheat Commission Cereal Schools. January 28, 2016
 Idaho Wheat Commission Cereal Schools January 28, 2016 About the Wheat Commission 2016 Supply Picture Segregating for Premium Price Protecting our Dams Maintaining Soft White Quality About the Idaho Wheat
Grain: World Markets and Trade
 Department of Agriculture Foreign Agricultural Service tember 218 Grain: World Markets and Trade EU Corn Imports to Rise Even Higher Million Metric Tons 2 18 16 14 12 1 8 6 4 2 Corn Imports (Oct-) USD/ton
2012 Farm Outlook. Highlights
 2012 Farm Outlook Office of the Chief Economist USDA Highlights A promising spring planting was followed by historic drought. Record high commodity prices followed. Farm incomes are expected to be near
Wheat Market Outlook for
 Wheat Market Outlook for 2018-2019 2018 KSU Wheat Schools Ness City & Lenora, Kansas DANIEL O BRIEN EXTENSION AGRICULTURAL ECONOMIST Topics to be discussed.. 1) U.S.-China Trade & Other Key Grain Market
Africa focus grains and oilseeds prospects into 2019
 000 tonnes 10 December 2018 Wandile Sihlobo, wandile@agbiz.co.za Africa focus grains and oilseeds prospects into 2019 It is year-end and therefore an appropriate time to reflect on the African continent
Crop Outlook: Now What?!
 Crop Outlook: Now What?! Frayne Olson, PhD Crop Economist/Marketing Specialist frayne.olson@ndsu.edu 701-231-7377 NDSU Extension Service ND Agricultural Experiment Station Dept. of Agribusiness & Applied
Grain Market Outlook for
 Grain Market Outlook for 2017-2018 KSU Ag Econ 520 Fall 2017 Manhattan, Kansas DANIEL O BRIEN EXTENSION AGRICULTURAL ECONOMIST Topics to be discussed.. 1) Grain Market Analysis & Outlook Corn & Grain Sorghum
2019 Grain Market Outlook
 2019 Grain Market Outlook Sumner County Ag Day Wellington, Kansas January 17, 2019 DANIEL O BRIEN EXTENSION AGRICULTURAL ECONOMIST 1) U.S. Economy 2019 Grain Market Drivers A relatively strong U.S. GDP,
World Agricultural Supply And Demand Estimates
 United States Department of Agriculture Office of the Chief Economist World Agricultural Supply And Demand Estimates Agricultural Marketing Service Economic Research Service Farm Service Agency Foreign
Grain Market Outlook for
 Grain Market Outlook for 2018-2019 2018 KSU Risk & Profit Conference Manhattan, Kansas DANIEL O BRIEN EXTENSION AGRICULTURAL ECONOMIST Topics to be discussed.. 1) U.S.-China Trade & Other Key Grain Market
December 2 nd in Lafayette Indiana and Monticello Illinois December 3 rd in Jacksonville, Illinois
 November 8, 2013 WE WILL BE UPDATING AND ADDING MATERIAL THROUGHOUT THE DAY ON NOVEMBER 8 TO THIS LETTER BEGINNING AT 11:00 AM CST. PLEASE CHECK BACK OFTEN FOR THE LATEST INFORMATION! This morning (Friday,
USDA lowered the 2010/11 wheat carry out by 5 million and decreased 2010/11 Yield by.3 bushels/acre.
 Tuesday November 9 th 2010 World Ag Supply & Demand Estimates Slightly Bullish for Corn More Bullish for Soybeans Friendly U.S. Wheat USDA lowered the 2010/11 corn carry out by 75 million and decreased
Grain: World Markets and Trade
 MMT 1, 975 95 925 9 875 85 825 8 Department of Agriculture Foreign Agricultural Service Grain: World Markets and Trade Near-Record Grain Supplies Support Growing Global Consumption Global Corn Production
FACTORS CREATING RISK IN U.S. GRAIN MARKETS
 FACTORS CREATING RISK IN U.S. GRAIN MARKETS WAY TOO EARLY GRAIN MARKET OUTLOOK TO 2050 22 ND NATIONAL WORKSHOP FOR DAIRY ECONOMISTS & POLICY ANALYSTS APRIL 30, 2015 JOHN NEWTON UNIV. OF ILLINOIS JCNEWT@ILLINOIS.EDU
World Agricultural Supply and Demand Estimates
 World Agricultural Supply and Demand Estimates Report of Interagency Commodity Estimates Committee Forecasts World Agricultural Outlook Board, Chairing Agency Economic Research Service Foreign Agricultural
February 10, Dear Subscriber: We will be adding material to this shell letter after todays reports are released at 11:00 a.m.
 February 10, 2015 Dear Subscriber: We will be adding material to this shell letter after todays reports are released at 11:00 a.m. Be sure to click back on the link often for the latest information. Before
2014 Wheat Situation. Crop Outlook & Durum Forum November 2014
 2014 Wheat Situation Crop Outlook & Durum Forum November 2014 World Wheat 2014 Impact Issues RECORD CROP BUT SHORTAGE OF QUALITY BIG U.S. CORN CROP No shortage of sellers on world wheat market Inland rail
USDA lowered the 2010/11 wheat carry out by 49 million and decreased 2010/11 Yield by.2 bushels/acre.
 Friday October 8 th 2010 World Ag Supply & Demand Estimates Very Bullish for Corn Bullish for Soybeans Friendly U.S. Wheat USDA lowered the 2010/11 corn carry out by 214 million and decreased 2010/11 Yield
2017/18 Crop Market Outlook & Strategies
 2017/18 Crop Market Outlook & Strategies Frayne Olson, PhD Crop Economist/Marketing Specialist Director Burdick Center for Cooperatives frayne.olson@ndsu.edu 701-231-7377 (o) 701-715-3673 (c) NDSU Extension
Commodity Outlook: September 2017 West Central Illinois: July 2017
 Commodity Outlook: September 2017 West Central Illinois: July 2017 William George Senior Agriculture Economist U.S. Department of Agriculture Foreign Agriculture Service Office of Global Analysis Commodity
Food Prices January February 2012 update Little movement in cereals spot & futures prices Maize stocks a concern
 Feb 29th 12 Food Prices January February 12 update Little movement in cereals spot & futures prices Maize stocks a concern KEY POINTS International spot prices of maize, rice, and wheat are little changed