January 9, 2014 WE WILL BE UPDATING AND ADDING MATERIAL THROUGHOUT THE DAY ON JANUARY 10 TO THIS LETTER BEGINNING AT 11:00 AM CST.
|
|
|
- Miranda Nicholson
- 5 years ago
- Views:
Transcription


1 January 9, 2014 WE WILL BE UPDATING AND ADDING MATERIAL THROUGHOUT THE DAY ON JANUARY 10 TO THIS LETTER BEGINNING AT 11:00 AM CST. PLEASE CHECK BACK OFTEN THROUGHOUT THE DAY FOR THE LATEST INFORMATION! On Friday morning USDA will release four huge reports that will set the tone for trading in the days ahead the Crop Production Annual Summary report, a WASDE report, a Quarterly Grain Stocks report, and a Winter Wheat Seeds report. On Thursday Dave spoke with Dan Zwicker of CGB Enterprises in Mandeville, Louisiana about what the reports might convey: 1
2 Pre-report projections with Dan Zwicker of CGB Enterprises. THIS LINK IS NOW LIVE. Broadband MP3: Our coverage of the reports post-release begins BELOW: This morning (Friday, January 10) USDA released four key reports. Don t forget we will have on air coverage of the report TODAY (Jan 10) at 12:39 p.m. Central Time with Mike Zuzolo of Global Commodity Analytics in Atchison, Kansas. We will post that audio to this letter shortly after air. Here are some of the key numbers we begin with USDA s Crop Production Annual Summary report: USDA January 2014 Annual Crop Production Summary in billions of bushels and millions of acres (released January 10, 2014) Crop USDA January Average Guess Range USDA 2012 Final Corn: Production Yield Harvested Acres Soybeans: Production Yield Harvested Acres
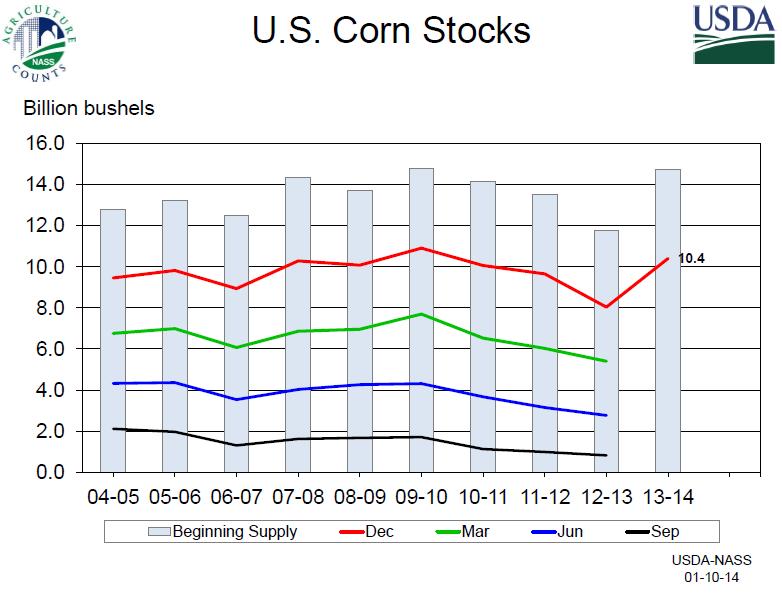
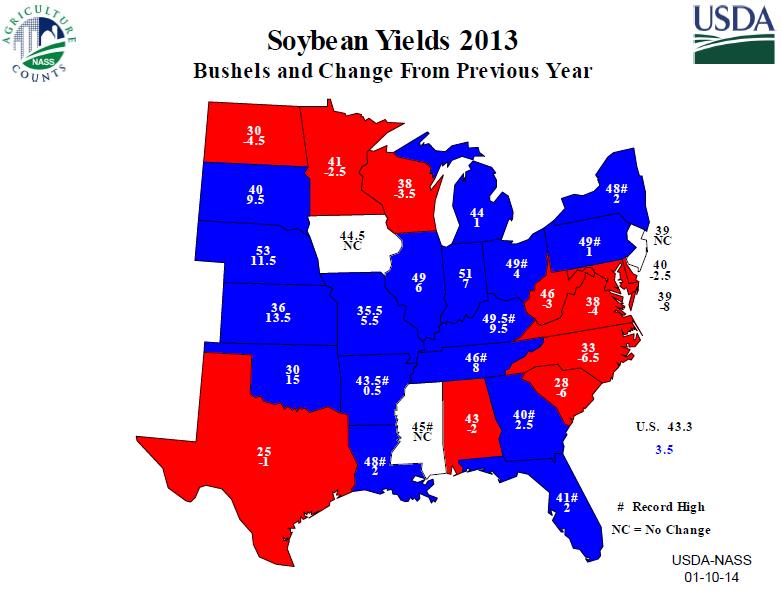
3 From the report: CORN: Corn for grain production is estimated at a record 13.9 billion bushels, down slightly from the November 1 forecast but 29 percent above The average yield in the United States is estimated at bushels per acre. This is down 1.6 bushels from the November forecast but 35.4 bushels above the 2012 average yield of Area harvested for grain is estimated at 87.7 million acres, up slightly from both the November forecast and SOYBEANS: Soybean production in 2013 totaled 3.29 billion bushels, up 1 percent from the November 1 forecast and up 8 percent from United States production is the third largest on record. The average yield per acre is estimated at 43.3 bushels, 0.3 bushel above the November 1 forecast and 3.5 bushels above last year's yield. Harvested area is down slightly from 2012 to 75.9 million acres and is the fourth highest on record. To view the full USDA Crop Production Annual Summary report go to: documentid=1047 Here are the key numbers for USDA s January 2014 Quarterly Grain Stocks report: USDA January 2014 Quarterly Grain Stocks Report in billions of bushels (released January 10, 2014) Crop USDA January Average Guess Range USDA December 2012 Corn Soybeans Wheat , From the USDA January 2014 Quarterly Grain Stocks report: CORN: Corn stored in all positions on December 1, 2013 totaled 10.4 billion bushels, up 30 percent from December 1, Of the total stocks, 6.38 billion bushels are stored on farms, up 39 percent from a year earlier. 3
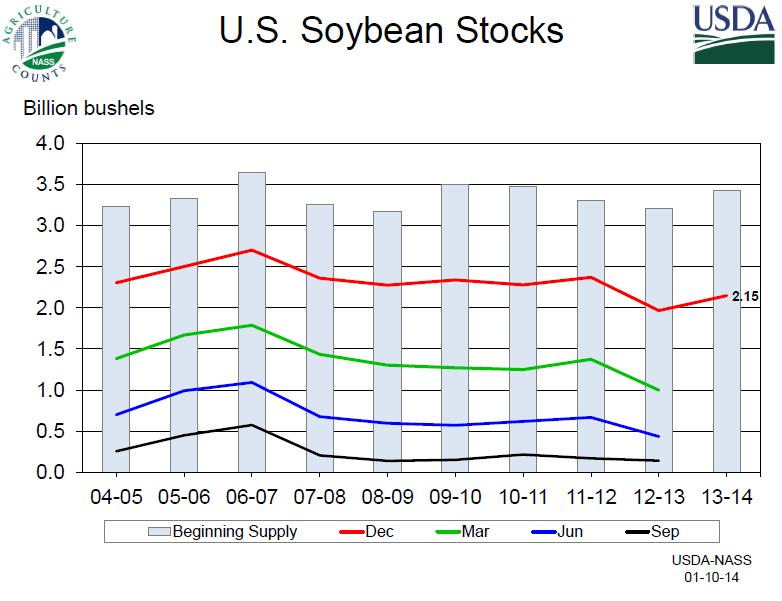
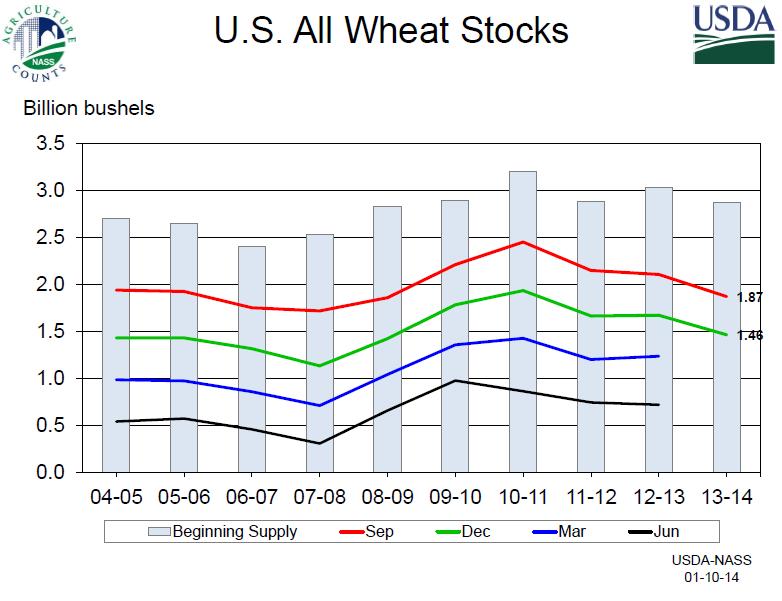
4 Off-farm stocks, at 4.05 billion bushels, are up 17 percent from a year ago. The September - November 2013 indicated disappearance is 4.32 billion bushels, compared with 3.74 billion bushels during the same period last year. SOYBEANS: Soybeans stored in all positions on December 1, 2013 totaled 2.15 billion bushels, up 9 percent from December 1, Soybean stocks stored on farms totaled 955 million bushels, up 5 percent from a year ago. Off-farm stocks, at 1.19 billion bushels, are up 13 percent from last December. Indicated disappearance for September - November 2013 totaled 1.28 billion bushels, up 4 percent from the same period a year earlier. WHEAT: All wheat stored in all positions on December 1, 2013 totaled 1.46 billion bushels, down 12 percent from a year ago. On-farm stocks are estimated at 399 million bushels, down slightly from last December. Offfarm stocks, at 1.06 billion bushels, are down 16 percent from a year ago. The September - November 2013 indicated disappearance is 407 million bushels, down 6 percent from the same period a year earlier. Durum wheat stored in all positions on December 1, 2013 totaled 54.2 million bushels, down 11 percent from a year ago. On-farm stocks, at 32.8 million bushels, are down 11 percent from December 1, Off-farm stocks totaled 21.4 million bushels, down 12 percent from a year ago. The September - November 2013 indicated disappearance of 12.2 million bushels is up 64 percent from the same period a year earlier. To view the full USDA January 2014 Quarterly Grain Stocks report go to: documentid=1079 4
5 Here are the key numbers for USDA s January 2014 WASDE report: USDA January 2914 U-S Ending Stocks for in billions of bushels (released January 10, 2014) Crop USDA January Average Guess Range USDA December Corn Soybeans Wheat From the January 2014 WASDE report: CORN: U.S. feed grain supplies for 2013/14 are projected lower with reduced production estimated for corn and sorghum. Harvested area for corn is raised 436,000 acres, but the estimated yield is lowered 1.6 bushels per acre to 158.8, reducing production 64 million bushels to 13.9 billion. Sorghum harvested area is lowered 148,000 acres and the yield is lowered 2.6 bushels per acre, reducing production 27 million bushels. Projected corn use for 2013/14 is raised with feed and residual use projected up 100 million bushels based on September-November disappearance as indicated by the December 1 stocks estimate. Corn used to produce ethanol is raised 50 million bushels reflecting continued strong weekly ethanol production, a reduction in expected sorghum use for ethanol, and higher forecast 2014 gasoline consumption in the latest projections from the Energy Information Administration. A 50-million-bushel reduction in other food, seed, and industrial use offsets the increase in use for ethanol. Corn ending stocks for 2013/14 are projected 161 million bushels lower at 1.6 billion. The projected 2013/14 season-average farm price for corn is unchanged at the midpoint with the range narrowed to $4.10 to $4.70 per bushel. SOYBEANS: U.S. oilseed production for 2013/14 is estimated at 97.3 million tons, up 0.9 million tons from last month. Larger crops for soybeans, cottonseed, and peanuts are partly offset by reductions for sunflowerseed and canola. Soybean production is estimated at billion bushels, up 31 million bushels based on increased yields and harvested area. The soybean yield is estimated at 43.3 bushels per acre, up 0.3 bushels from the previous estimate. Soybean crush is raised 10 million bushels to billion 5
6 reflecting higher projected soybean meal exports, which partly offsets a reduction for Argentina. Soybean exports are increased 20 million bushels to billion reflecting record shipments during the first quarter of the marketing year and strong sales through December. Soybean ending stocks for 2013/14 are projected at 150 million bushels, unchanged for last month. Soybean oil balance sheet changes include increased production on a higher crush and extraction rate, reduced imports, increased projected exports, and increased ending stocks. The 2013/14 U.S. season-average farm price forecast for soybeans is narrowed 25 cents on both ends of the range to $11.75 to $13.25 per bushel based on prices reported to date. The soybean oil price is forecast at 35.5 to 39.5 cents per pound, down 2.5 cents on both ends. The soybean meal price is projected at $415 to $455 per short ton, up 15 dollars on both ends of the range. WHEAT: U.S. wheat supplies for 2013/14 are unchanged this month, but lower expected use raises projected ending stocks 33 million bushels. Feed and residual use is lowered 60 million bushels reflecting disappearance for June-November as indicated by the December 1 stocks released in the Grain Stocks report. Feed and residual use is lowered for Hard Red Winter (HRW) and Hard Red Spring, and Soft Red Winter wheat. Seed use is raised 1 million bushels based on the winter wheat planted area reported today in the Winter Wheat Seedings report. Wheat exports are projected 25 million bushels higher, with an increase for HRW, on the strong pace of sales and shipments and lower expected competition from Argentina, particularly in Brazil s milling wheat market. The 2013/14 season-average farm price is projected 10 cents lower at the midpoint with the range narrowed to $6.60 to $7.00 per bushel. USDA January 2014 World Ending Stocks for in millions of metric tons (released January 10, 2014) Crop USDA January Average Guess Range USDA December Corn Soybeans Wheat
7 USDA January 2014 WASDE Production in millions of metric tons (released January 10, 2014) Crop Argentina Wheat Australia Wheat China Wheat India Wheat FSU-12 Wheat USDA January USDA December USDA January USDA December EU Wheat Argentina Corn Brazil Corn China Corn South Africa Corn Argentina Soybeans Brazil Soybeans From the January 2014 WASDE report: CORN: Global coarse grain supplies for 2013/14 are projected 1.2 million tons higher despite this month s reduction in U.S. production and a 1.9- million-ton decrease in global beginning stocks. Higher 2012/13 corn exports for Brazil reduce beginning stocks for 2013/14. Global barley production for 2013/14 is raised 1.6 million tons with increases for the European Union, Argentina, and Russia. Foreign corn production is raised 7
8 4.3 million tons with higher China production. China corn production is raised 6.0 million tons reflecting the latest upward revision by the China National Grain and Oil Information Center, indications from the National Bureau of Statistics for total 2013/14 grain production, and review of growing-season weather. Favorable weather suggests year-to-year yield increases in most of China s major corn producing areas. In the northeastern region, above normal rainfall and favorable temperatures were experienced in nearly all of the corn areas. Harvested area is also raised for China. SOYBEANS: Global oilseed production for 2013/14 is projected at a record million tons, up 3.6 million. Global soybean production is projected at million tons, up 1.9 million on gains for the United States and Brazil. The Brazil soybean crop projection is raised 1.0 million tons to a record 89.0 million. The increase is due to higher projected area reflecting recent survey data from the Brazilian government. Global sunflowerseed production is raised 1.3 million tons to 43.7 million on record forecasts for Ukraine, Russia, and the European Union. The Ukraine crop is raised 1.0 million tons to 12.5 million on higher yields. Other changes include increased cottonseed production for China and Argentina, lower cottonseed production for Pakistan, and increased rapeseed production for Russia. Global oilseed trade for 2013/14 is projected at million tons, up slightly from last month. Increased soybean exports for the United States are partly offset by reduced rapeseed export prospects for Australia and Canada. Lower soybean meal exports for Argentina resulting from lower soybean crush are offset by gains for the United States, Brazil, and Russia. Increased global soybean oil trade mainly reflects a higher projection for the United States. Global oilseed ending stocks are projected at 85.1 million tons, up 2.3 million from last month on increased soybean stocks in Argentina and Brazil, increased canola stocks in Canada, and higher sunflowerseed stocks in Russia and Ukraine. WHEAT: Global 2013/14 wheat supplies are raised 1.5 million tons to million with production increases for China and the FSU-12 more than offsetting reductions for Argentina and the European Union. Production is raised 1.0 million tons for China reflecting the latest estimate by the China National Grain and Oil Information Center and indications from the National Bureau of Statistics for total 2013/14 grain production. Production is raised 0.6 million tons for Russia and 0.3 million tons for Tajikistan, both based on the latest official indications. Production is reduced 0.5 million tons for Argentina with harvested area expected lower. Production for the European Union is lowered 0.2 million tons with small downward revisions for the United Kingdom, Finland, and Denmark. 8
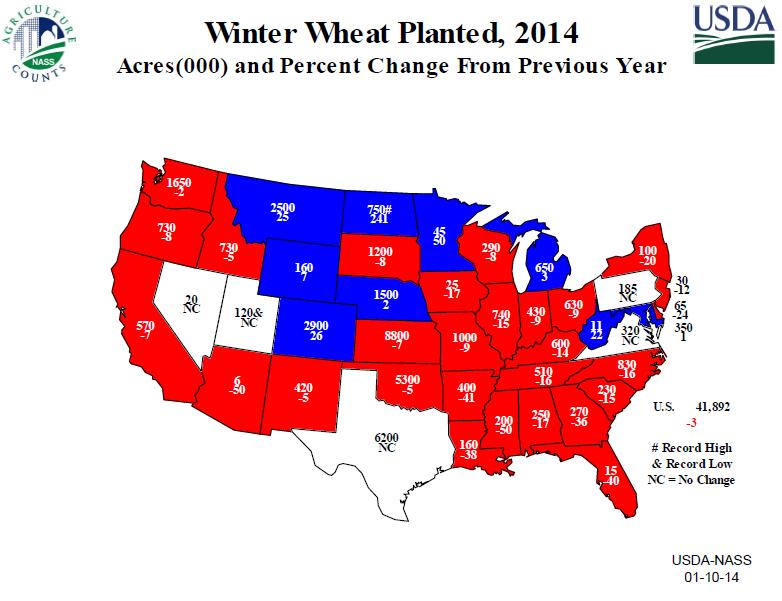
9 Global wheat trade for 2013/14 is raised with higher imports projected for Egypt, Japan, and Syria more than offsetting reductions for the Philippines and Tajikistan. Exports are raised for the European Union and Russia. Stronger North Africa and Middle East demand drives increases for the European Union and Russia, whereas reductions in Argentina supplies and exports indicate a shift to U.S. supplies for Brazil. Foreign wheat feeding is lower mostly reflecting a 1.0-million-ton reduction for the European Union where increased exports reduce supplies available to the domestic market. Larger barley supplies in the European Union this month support a shift to barley feeding. Global wheat ending stocks are projected 2.6 million tons higher mostly on increases for China and the United States. To see the full January 2014 WASDE report go to: Here are the key numbers from USDA s Winter Wheat Seedings report: USDA January 2014 U-S Winter Seedings in millions of acres (released January 10, 2014, 11:00 a.m. CST) Crop USDA January Average Guess Range USDA 2013 Seedings Total Winter Hard Red Winter Soft Red Winter White Winter From the USDA 2014 U-S Winter Wheat Seedings report: Winter wheat: Planted area for harvest in 2014 is estimated at 41.9 million acres, down 3 percent from 2013 but 2 percent above Seeding began in August but by the end of September was slightly behind the 5-year average pace. However, by the end of October, seeding had progressed slightly ahead of the 5-year average pace. 9


10 Hard Red Winter (HRW) wheat seeded area is expected to be 30.1 million acres, up 2 percent from Acreage changes from last year are mixed across the growing region. Growers in Colorado, Montana, and North Dakota planted significantly more acres this year while large acreage decreases occurred in Kansas, Oklahoma, and South Dakota. Record low acreage was seeded in Utah. In contrast, North Dakota growers seeded record high area. By November 24, Hard Red Winter wheat conditions were improved from last year with most acreage rated in good to excellent condition. Soft Red Winter (SRW) wheat seeded area is about 8.44 million acres, down 16 percent from last year. Acreage decreases from last year are expected in 10
11 most SRW growing States with significant acreage decreases estimated in Arkansas and Mississippi. White Winter wheat seeded area totals nearly 3.39 million acres, down 3 percent from Planted acreage in the Pacific Northwest (Idaho, Oregon, and Washington) is down from last year. Planting got off to a normal start but by the middle of October progress was behind the 5-year average pace in Idaho and Washington. By November 10, seeding was virtually complete in the region. Durum wheat: Seedings in Arizona and California for 2014 harvest are estimated at 145,000 acres, down 6 percent from 2013 and 41 percent below Planting has progressed well in both the San Joaquin Valley and Imperial Valley. No major problems with the crop have been reported. To view the full USDA 2014 U-S Winter Wheat Seedings report go to: documentid=1188 After the reports were released Dave spoke with Mike Zuzolo of Global Commodity Analytics in Atchison, Kansas. THIS LINK IS NOW LIVE. Broadband MP3: Here are some of the key slides from the USDA Secretary lock-up briefing this morning (January 10) in Washington, D.C.: 11
12 12
13 13
14 14
15 15
16 16
17 17
December 2 nd in Lafayette Indiana and Monticello Illinois December 3 rd in Jacksonville, Illinois
 November 8, 2013 WE WILL BE UPDATING AND ADDING MATERIAL THROUGHOUT THE DAY ON NOVEMBER 8 TO THIS LETTER BEGINNING AT 11:00 AM CST. PLEASE CHECK BACK OFTEN FOR THE LATEST INFORMATION! This morning (Friday,
June 12, USDA June 2013 Wheat Production for 2013 in billions of bushels - released June 12, USDA June 2013 Estimate.
 June 12, 2013 WE WILL BE UPDATING AND ADDING MATERIAL THROUGHOUT THE DAY ON JUNE 12 TO THIS LETTER BEGINNING AT 11:00 AM CST. PLEASE CHECK BACK OFTEN FOR THE LATEST INFORMATION! This morning (Wednesday,
April 9, Dear Subscriber:
 April 9, 2014 Dear Subscriber: We will be adding material to this shell letter after the report is released on April 9, 2014 at 11:00 a.m CST. Be sure to click back on the link often for the latest information.
February 10, Dear Subscriber: We will be adding material to this shell letter after todays reports are released at 11:00 a.m.
 February 10, 2015 Dear Subscriber: We will be adding material to this shell letter after todays reports are released at 11:00 a.m. Be sure to click back on the link often for the latest information. Before
April 9, Dear Subscriber: We will be adding material to this shell letter after todays reports are released at 11:00 a.m.
 April 9, 2015 Dear Subscriber: We will be adding material to this shell letter after todays reports are released at 11:00 a.m. Be sure to click back on the link often for the latest information. While
March 10, Dear Subscriber:
 March 10, 2014 Dear Subscriber: We will be adding material to this shell letter after the report is released on March 10 at 11:00 a.m CST. Be sure to click back on the link often for the latest information.
USDA lowered the 2010/11 wheat carry out by 49 million and decreased 2010/11 Yield by.2 bushels/acre.
 Friday October 8 th 2010 World Ag Supply & Demand Estimates Very Bullish for Corn Bullish for Soybeans Friendly U.S. Wheat USDA lowered the 2010/11 corn carry out by 214 million and decreased 2010/11 Yield
May 12, Dear Subscriber: We will be adding material to this shell letter after todays reports are released at 11:00 a.m.
 May 12, 2015 Dear Subscriber: We will be adding material to this shell letter after todays reports are released at 11:00 a.m. Be sure to click back on the link often for the latest information. Whle today
This morning (Monday, March 31, 2014) USDA released its annual Prospective Plantings Report. Here are the national numbers:
 USDA released its annual Prospective Plantings Report. Here are the national numbers:") March 31, 2014 WE WILL BE UPDATING AND ADDING MATERIAL THROUGHOUT THE DAY ON MARCH 31 TO THIS LETTER BEGINNING AT 11:00 AM CST. PLEASE CHECK BACK OFTEN FOR THE LATEST INFORMATION! This morning (Monday,
March 31, 2014 WE WILL BE UPDATING AND ADDING MATERIAL THROUGHOUT THE DAY ON MARCH 31 TO THIS LETTER BEGINNING AT 11:00 AM CST. PLEASE CHECK BACK OFTEN FOR THE LATEST INFORMATION! This morning (Monday,
USDA WASDE Report. Friday April 9 th 2010 World AG Supply & Demand Estimates. Office Friday April 09, 2010
 Friday April 9 th 2010 World AG Supply & Demand Estimates The trade was expecting the new carry out to incorporate additional stocks resulting from the March 31 grain stocks report which was not reflected
USDA lowered the 2010/11 wheat carry out by 5 million and decreased 2010/11 Yield by.3 bushels/acre.
 Tuesday November 9 th 2010 World Ag Supply & Demand Estimates Slightly Bullish for Corn More Bullish for Soybeans Friendly U.S. Wheat USDA lowered the 2010/11 corn carry out by 75 million and decreased
Friday Aug 10, 2012 World Ag Supply & Demand Report
 Friday Aug 10, 2012 World Ag Supply & Demand Report U.S. 2011/12 Old Crop Corn is Supportive Global Old Crop Corn is Slightly Bearish USDA estimates the 2011/12 U.S. corn carryout at 1,021 million bushels,
Wednesday July 11, 2012 World Ag Supply & Demand Report
 World Ag Supply & Demand Report U.S. 2011/12 Old Crop Corn is neutral Global Old Crop Corn is neutral USDA estimates the 2011/12 U.S. corn carryout at 903 million bushels, up from 851 million bushels from
Summary of WASDE and Production USDA
 Summary of WASDE and Production USDA The following information are summary and extracts from the latest, AUG 2016, WASDE and World Agricultural Production reports provided by the United States Department
February 10, Tickets are 30 dollars and include a continential breakfast, Beef House lunch, and 25th anniversery hat.
 February 10, 2014 WE WILL BE UPDATING AND ADDING MATERIAL THROUGHOUT THE DAY ON FEBRUARY 10 TO THIS LETTER BEGINNING AT 11:00 AM CST. PLEASE CHECK BACK OFTEN FOR THE LATEST INFORMATION! Tickets for the
January 12, USDA World Supply and Demand Estimates
 January 12, 2017 - USDA World Supply and Demand Estimates Corn This month s U.S. corn outlook is for lower production, reduced feed and residual use, increased corn used to produce ethanol, and smaller
January 12, USDA World Supply and Demand Estimates
 January 12, 2018 - USDA World Supply and Demand Estimates Corn Market Reaction: March 2018 corn futures closed down 2 ½ cents at $3.46 ¼ with a trading range for the day of $3.45 ½ to $3.50. December 2018
August 10, USDA World Supply and Demand Estimates
 August 10, 2017 - USDA World Supply and Demand Estimates Corn Market Reaction: September 2017 corn futures closed down 15 cents at $3.57 ¼ with a trading range for the day of $3.56 ½ to $3.75 ½. December
June 9, USDA World Supply and Demand Estimates
 June 9, 2017 - USDA World Supply and Demand Estimates Corn Market Reaction: July 2017 corn futures closed up 2 cents at $3.87 ¾ with a trading range for the day of $3.80 ¾ to $3.89 ½. December 2017 corn
June 12, USDA World Supply and Demand Estimates
 June 12, 2018 - USDA World Supply and Demand Estimates Corn Market Reaction: July 2018 corn futures closed up 10 ¼ cents at $3.77 ½ with a trading range for the day of $3.67 ¼ to $3.79 ½. December 2018
May 10, USDA World Supply and Demand Estimates
 May 10, 2018 - USDA World Supply and Demand Estimates Corn Market Reaction: July 2018 corn futures closed down ¾ cent at $4.02 with a trading range for the day of $4.00 to $4.07. December 2018 corn futures
December 12, USDA World Supply and Demand Estimates
 December 12, 2017 - USDA World Supply and Demand Estimates Corn Market Reaction: March 2018 corn futures closed down 1 ¼ cents at $3.47 ¾ with a trading range for the day of $3.47 ½ to $3.53. December
September 12, USDA World Supply and Demand Estimates
 September 12, 2018 - USDA World Supply and Demand Estimates Corn Market Reaction: December 2018 corn futures closed down 14 ¼ cents at $3.52 ½ with a trading range for the day of $3.50 ¾ to $3.66 ¼. December
SOYBEANS: SURPLUS GROWS, ACREAGE TO DECLINE
 SOYBEANS: SURPLUS GROWS, ACREAGE TO DECLINE JANUARY 2007 Darrel Good 2007 NO. 2 Summary The 2006 U.S. soybean crop was a record 3.188 billion bushels, but was 16 million smaller than the November 2006
Grains & Oilseeds Outlook. USDA's Interagency Commodity Estimates Grains and Oilseeds Committees
 Agricultural Outlook Forum Presented: February 23-24, 2012 U.S. Department of Agriculture Grains & Oilseeds Outlook USDA's Interagency Commodity Estimates Grains and Oilseeds Committees United States Department
SOYBEANS: LARGE U.S. CROP, WHAT ABOUT SOUTH AMERICA?
 SOYBEANS: LARGE U.S. CROP, WHAT ABOUT SOUTH AMERICA? OCTOBER 2004 Darrel Good 2004 B NO. 8 Summary The USDA now forecasts the 2004 U.S. soybean crop at 3.107 billion bushels, 271 million larger than the
Wheat Outlook. Economic Research Service August 14, Approved by the World Agricultural Outlook Board
 Wheat Outlook Economic Research Service August 14, 008 U.S. Department of Agriculture WHS-08gt text and tables Approved by the World Agricultural Outlook Board U.S. Wheat Production Nearly Unchanged From
Wheat Outlook. Economic Research Service September 16, Approved by the World Agricultural Outlook Board
 Wheat Outlook Economic Research Service September 16, 008 U.S. Department of Agriculture WHS-08ht text and tables Approved by the World Agricultural Outlook Board Larger Production and Beginning Stocks
Wheat Outlook. Economic Research Service May 13, Approved by the World Agricultural Outlook Board
 Wheat Outlook Economic Research Service May 13, 008 U.S. Department of Agriculture WHS-08dt text and tables Approved by the World Agricultural Outlook Board Continued High Farm Prices Projected for 008/09
Winter Wheat Seedings
 Winter Wheat Seedings ISSN: 1949-1980 Released January 11, 2013, by the National Agricultural Statistics Service (NASS), Agricultural Statistics Board, United States Department of Agriculture (USDA). Planted
CORN: DECLINING WORLD GRAIN STOCKS OFFERS POTENTIAL FOR HIGHER PRICES
 CORN: DECLINING WORLD GRAIN STOCKS OFFERS POTENTIAL FOR HIGHER PRICES OCTOBER 2000 Darrel Good Summary The 2000 U.S. corn crop is now estimated at 10.192 billion bushels, 755 million (8 percent) larger
Winter Wheat Seedings
 Winter Wheat Seedings ISSN: 1949-1980 Released January 10, 2014, by the National Agricultural Statistics Service (NASS), Agricultural Statistics Board, United States Department of Agriculture (USDA). Planted
World Agricultural Supply And Demand Estimates
 United States Department of Agriculture Office of the Chief Economist World Agricultural Supply And Demand Estimates Agricultural Marketing Service Economic Research Service Farm Service Agency Foreign
SOYBEANS: LOW PRICES TO PERSIST
 SOYBEANS: LOW PRICES TO PERSIST JANUARY 2002 Darrel Good 2002 - NO. 2 Summary Soybean prices received some support from the USDA s January 11 final U.S. production estimate for the 2001 crop. At 2.891
Winter Wheat Seedings
 Winter Wheat Seedings ISSN: 1949-1980 Released January 12, 2011, by the National Agricultural Statistics Service (NASS), Agricultural Statistics Board, United States Department of Agriculture (USDA). Planted
WORLD AGRICULTURAL SUPPLY AND DEMAND ESTIMATES
 WORLD AGRICULTURAL SUPPLY AND DEMAND ESTIMATES United States Department of Agriculture Washington, D.C. Approved by the World Agricultural Outlook Board WASDE-339 - June 12, 1998 NOTE Because planting
World Agricultural Supply and Demand Estimates
 World Agricultural Supply and Demand Estimates Report of Interagency Commodity Estimates Committee Forecasts World Agricultural Outlook Board, Chairing Agency Economic Research Service Foreign Agricultural
Analysis of the October 2010 USDA Crop Production & WASDE Reports
 Analysis of the October 2010 USDA Crop Production & WASDE Reports Daniel O Brien Extension Agricultural Economist, K State Research and Extension October 11, 2010 Summary of October 8 th 2010 Crop Production
SOYBEANS: LARGE SUPPLIES CONFIRMED, BUT WHAT ABOUT 2005 PRODUCTION?
 SOYBEANS: LARGE SUPPLIES CONFIRMED, BUT WHAT ABOUT 2005 PRODUCTION? JANUARY 2005 Darrel Good 2005 NO. 2 Summary USDA s January reports confirmed a record large 2004 U.S. crop, prospects for large year-ending
World Agricultural Supply And Demand Estimates
 United States Department of Agriculture Office of the Chief Economist World Agricultural Supply And Demand Estimates Agricultural Marketing Service Economic Research Service Farm Service Agency Foreign
Grain Price SOYBEANS: SMALLER U.S. CROP, WILL SOUTH AMERICA FILL THE GAP? OCTOBER 2002 Darrel Good 2002 NO. 8. Summary
 UNIVERSITY OF ILLINOIS EXTENSION Grain Price OUTLOOK A joint publication of the Department of Agricultural Economics, College of Agriculture, Purdue University, West Lafayette, Indiana, and the Department
SOYBEANS: DECLINING EXPORTS, LARGE STOCKS
 SOYBEANS: DECLINING EXPORTS, LARGE STOCKS JANUARY 2006 Darrel Good 2006 NO. 2 Summary At 3.086 billion bushels, the 2005 U.S. soybean crop was 43 million larger than the November forecast and only 38 million
May 17, 1996 Ames, Iowa Econ. Info PLANTINGS LAG IN EASTERN CORN BELT & SPRING WHEAT AREAS
 May 17, 1996 Ames, Iowa Econ. Info. 1694 PLANTINGS LAG IN EASTERN CORN BELT & SPRING WHEAT AREAS Planting progress will be one of several factors influencing prices in the next several weeks. In contrast
SOYBEANS: LARGE U.S. CROP, WHAT ABOUT SOUTH AMERICA? October 2005 Darrel Good 2005 No. 8
 SOYBEANS: LARGE U.S. CROP, WHAT ABOUT SOUTH AMERICA? October 2005 Darrel Good 2005 No. 8 Summary USDA reports provided two fundamental surprises for the market over the past three weeks. First, the September
SOYBEANS: AN EARLY WEATHER MARKET
 SOYBEANS: AN EARLY WEATHER MARKET January 2000 Darrel Good Summary 1999 U.S. Crop Estimate Revised Lower Soybean prices have made a modest rally from the mid-december lows, fueled by areas of dry weather
CORN: USDA REPORTS FAIL TO CONFIRM SMALLER SUPPLIES
 CORN: USDA REPORTS FAIL TO CONFIRM SMALLER SUPPLIES JANUARY 2001 Darrel Good No. 1 Summary Corn prices managed a significant rally from late September to late December 2000, partially on anticipation of
World Agricultural Supply And Demand Estimates
 World Agricultural Supply And Demand Estimates United States Department of Agriculture Office of the Chief Economist Agricultural Marketing Service Economic Research Service Farm Service Agency Foreign
NOVEMBER 2017 USDA SUPPLY/DEMAND ESTIMATES. Overview
 NOVEMBER 2017 USDA SUPPLY/DEMAND ESTIMATES Overview Corn: This month s 2017/18 U.S. corn outlook included larger production, increased feed use and exports, and higher ending stocks. Corn production is
Economic Research Service Situation and Outlook Report. WHS-18i September 14, 2018
 Economic Research Service Situation and Outlook Report WHS-18i September 14, 2018 Next release is October 15, 2018 Wheat Outlook Jennifer K. Bond Olga Liefert In this report: - Domestic Outlook - Domestic
World Agricultural Supply And Demand Estimates
 United States Department of Agriculture Office of the Chief Economist World Agricultural Supply And Demand Estimates Agricultural Marketing Service Economic Research Service Farm Service Agency Foreign
SOYBEANS: HIGHEST PRICES IN OVER SEVEN YEARS. January 2004 Darrel Good 2004 NO. 2
 SOYBEANS: HIGHEST PRICES IN OVER SEVEN YEARS January 2004 Darrel Good 2004 NO. 2 Summary At 2.418 billion bushels, the 2003 U.S. soybean crop was 34 million bushels smaller than the USDA s November forecast
Reaction to USDA Reports
 August 10, 2012 Reaction to USDA Reports CROP PRODUCTION CORN: 10.779 billion bu.; trade expected 10.971 billion bu. -- compares to 12.358 billion bu. in 2011 BEANS: 2.692 billion bu., trade expected 2.786
World Agricultural Supply And Demand Estimates
 United States Department of Agriculture Office of the Chief Economist World Agricultural Supply And Demand Estimates Agricultural Marketing Service Economic Research Service Farm Service Agency Foreign
SOYBEANS: FOCUS ON SOUTH AMERICAN AND U.S. SUPPLY AND CHINESE DEMAND
 SOYBEANS: FOCUS ON SOUTH AMERICAN AND U.S. SUPPLY AND CHINESE DEMAND APRIL 2002 Darrel Good 2002-NO.4 Summary Soybean prices during the first half of the 2001-02 marketing year were well below the prices
SOYBEANS: SMALLER STOCKS, MORE ACRES, AND EARLY WEATHER WORRIES
 SOYBEANS: SMALLER STOCKS, MORE ACRES, AND EARLY WEATHER WORRIES APRIL 2000 Darrel Good Summary March 1, 2000 stocks of soybeans were estimated at 1.397 billion bushels, 60 million less than on the same
CORN: MARKET TO REFLECT U.S. AND CHINESE CROP PROSPECTS
 CORN: MARKET TO REFLECT U.S. AND CHINESE CROP PROSPECTS JULY 2001 Darrel Good 2001 - No. 6 Summary The USDA s June Acreage and Grain Stocks reports provided some modest fundamental support for the corn
Grain Stocks. Corn Stocks Up Slightly from September 2015 Soybean Stocks Up 3 Percent All Wheat Stocks Up 21 Percent
 Grain Stocks ISSN: 949-095 Released September 30, 06, by the National Agricultural Statistics Service (NASS), Agricultural Statistics Board, United s Department of Agriculture (USDA). Corn Stocks Up Slightly
CORN: FIVE CONSECUTIVE LARGE CROPS?
 CORN: FIVE CONSECUTIVE LARGE CROPS? JULY 2000 Darrel Good Summary The USDA s June Acreage Report revealed that U.S. producers had planted nearly 79.6 million acres of corn in 2000, up from 77.4 million
Economic Research Service Situation and Outlook Report. Lagging U.S. Exports To Exacerbate Soybean Surplus
 Economic Research Service Situation and Outlook Report OCS-18k November 13, 2018 Next release is December 13, 2018 Oil Crops Outlook Mark Ash Mariana Matias Lagging U.S. Exports To Exacerbate Soybean Surplus
World Agricultural Supply And Demand Estimates
 United States Department of Agriculture Office of the Chief Economist World Agricultural Supply And Demand Estimates Agricultural Marketing Service Economic Research Service Farm Service Agency Foreign
Grain Stocks. Corn Stocks Down 7 Percent from September 2017 Soybean Stocks Up 45 Percent All Wheat Stocks Up 5 Percent
 Grain Stocks ISSN: 949-095 Released September 8, 08, by the National Agricultural Statistics Service (NASS), Agricultural Statistics Board, United s Department of Agriculture (USDA). Corn Stocks Down 7
USDA Acreage & Stocks Report
 Wednesday June 30 th 2010 Acreage & Grain Stocks Estimates Bullish for Corn Mildly Friendly Old Soybeans, Bearish New Soybeans Bearish Wheat Corn stock reported 288 million less than average trade estimates.
Grain Stocks. Corn Stocks Up 32 Percent from September 2016 Soybean Stocks Up 53 Percent All Wheat Stocks Down 11 Percent
 Grain Stocks ISSN: 949-095 Released September 9, 07, by the National Agricultural Statistics Service (NASS), Agricultural Statistics Board, United s Department of Agriculture (USDA). Corn Stocks Up 3 Percent
World Agricultural Outlook Board Interagency Commodity Estimates Committee Forecasts. Lockup Briefing April 9, 2014
 World Agricultural Outlook Board Interagency Commodity Estimates Committee Forecasts Lockup Briefing World Wheat Production Country or Region Million Tons World 656.5 712.5 8.5 United States 61.7 58.0-6.0
2016 Risk and Profit Conference General Session Speakers. GENERAL SESSION IV Grain Market Situation and Outlook
 2016 Risk and Profit Conference General Session Speakers GENERAL SESSION IV Grain Market Situation and Outlook Dan O Brien, Kansas State University Daniel O Brien was raised on a grain and livestock farm
SOYBEANS: WORLD PRODUCTION CONTINUES TO EXPAND
 SOYBEANS: WORLD PRODUCTION CONTINUES TO EXPAND OCTOBER 2001 Darrel Good 2001-No. 7 Summary The USDA s October Crop Production report forecast the 2001 U.S. soybean crop at 2.907 billion bushels. That forecast
CORN: ATTENTION NOW TURNS TO THE NEW CROP
 CORN: ATTENTION NOW TURNS TO THE NEW CROP APRIL 2002 Darrel Good 2002-No. 3 Summary The USDA s March Grain Stocks report revealed larger corn inventories than the market expected, but recent export activity
World Agricultural Outlook Board Interagency Commodity Estimates Committee Forecasts. Lockup Briefing June 11, 2014
 World Agricultural Outlook Board Interagency Commodity Estimates Committee Forecasts Lockup Briefing World Wheat Production Country or Region 2014/15 Million Tons World 714.0 701.6 0.7-1.7 United States
March 2018 USDA SUPPLY/DEMAND ESTIMATES. Overview
 March 2018 USDA SUPPLY/DEMAND ESTIMATES Overview Corn: This month s 2017/18 U.S. corn outlook is for larger exports and increased corn used to produce ethanol. Corn used to produce ethanol was raised 50
MARKET OUTLOOK REPORT Volume 1 Number 1
 MARKET OUTLOOK REPORT Volume 1 Number 1 WHEAT: SITUATION AND OUTLOOK April 17, 2009 Prepared by: Market Analysis Group Grains and Oilseeds Division Food Value Chain Bureau Market and Industry Services
Corn & Soybeans. Corn (source WASDE) Soybean (source WASDE)
 Soybean (source WASDE)") Corn & Soybeans Corn (source WASDE) Estimate for the 2016-17 Season Global and US outlook Soybean (source WASDE) Estimate for the 2016-17 Season Global and US outlook Corn and Soybeans prices (Source CME)
Corn & Soybeans Corn (source WASDE) Estimate for the 2016-17 Season Global and US outlook Soybean (source WASDE) Estimate for the 2016-17 Season Global and US outlook Corn and Soybeans prices (Source CME)
CORN: WILL ACREAGE REBOUND IN 2002
 CORN: WILL ACREAGE REBOUND IN 2002 JANUARY 2002 Darrel Good 2002 - NO.1 Summary The USDA s Crop Production and Grain Stocks reports released on January 11 reflected a smaller domestic supply of corn and
2012 Farm Outlook. Highlights
 2012 Farm Outlook Office of the Chief Economist USDA Highlights A promising spring planting was followed by historic drought. Record high commodity prices followed. Farm incomes are expected to be near
Ending stocks can adjust due to a variety of factors from changes in production as well as adjustments to beginning stocks and demand.
 1 2 3 Wire services such as Reuters and Bloomberg offer a survey of analysts expectations for high-profile USDA reports. These surveys hold interest because they help clarify what constitutes a shock or
CORN: CROP PROSPECTS TO DOMINATE PRICES
 CORN: CROP PROSPECTS TO DOMINATE PRICES JULY 2002 Darrel Good 2002 NO. 5 Summary The USDA s June Grain Stocks report confirmed a rapid rate of domestic corn consumption during the third quarter of the
Crop Production ISSN:
 Crop Production ISSN: 1936-3737 Released August 12, 2014, by the National Agricultural Statistics Service (NASS), Agricultural Statistics Board, United States Department of Agriculture (USDA). Corn Production
Economic Research Service Situation and Outlook Report. Lagging U.S. Exports To Exacerbate Soybean Surplus
 Economic Research Service Situation and Outlook Report OCS-18k November 13, 2018 Next release is December 13, 2018 Oil Crops Outlook Mark Ash Mariana Matias Lagging U.S. Exports To Exacerbate Soybean Surplus
U.S. Wheat Crop and Market Update
 U.S. Wheat Crop and Market Update IAOM Central and Wheat State District Meeting Justin Gilpin KS Wheat Commission Manhattan, KS jgilpin@kswheat.com Overview US growing areas and trade flows US Wheat Crop
World Agricultural Supply And Demand Estimates
 World Agricultural Supply And Demand Estimates United States Department of Agriculture Office of the Chief Economist Agricultural Marketing Service Economic Research Service Farm Service Agency Foreign
CORN: PRODUCTION EXCEEDS EXPECTATIONS
 CORN: PRODUCTION EXCEEDS EXPECTATIONS OCTOBER 2001 Darrel Good 2001 NO. 7 Summary The USDA's October Crop Production report forecast the 2001 U.S. corn crop at 9.43 billion bushels. The crop is about 540
Crop Outlook: Now What?!
 Crop Outlook: Now What?! Frayne Olson, PhD Crop Economist/Marketing Specialist frayne.olson@ndsu.edu 701-231-7377 NDSU Extension Service ND Agricultural Experiment Station Dept. of Agribusiness & Applied
Economic Research Service Situation and Outlook Report. First-Quarter Soybean Stocks Are Up Sharply
 Economic Research Service Situation and Outlook Report OCS-19b February 12, 2019 Next release is March 12, 2019 Oil Crops Outlook Mark Ash Mariana Matias First-Quarter Soybean Stocks Are Up Sharply In
Rain and grain Best hope for rally could be January USDA report. By Bryce Knorr, Senior Grain Market Analyst
 Rain and grain Best hope for rally could be January USDA report By Bryce Knorr, Senior Grain Market Analyst Corn and soybeans aren t the only numbers in play when USDA releases its Jan. 11 reports. Weather
US Crops and Where They re Grown. Introduction. Corn, Soybeans, Barley, and Oats
 US Crops and Where They re Grown Introduction The United States is a market leader in many of the world's major crops. Understanding where and when major US crops are grown can help Canadian farmers market
2014 Wheat Situation. Crop Outlook & Durum Forum November 2014
 2014 Wheat Situation Crop Outlook & Durum Forum November 2014 World Wheat 2014 Impact Issues RECORD CROP BUT SHORTAGE OF QUALITY BIG U.S. CORN CROP No shortage of sellers on world wheat market Inland rail
Global Agricultural Supply and Demand: Factors contributing to recent increases in food commodity prices
 Global Agricultural Supply and Demand: Factors contributing to recent increases in food commodity prices Ron Trostle Economic Research Service U.S. Department of Agriculture Agricultural Markets and Food
Wheat Outlook. U.S. 2017/18 all-wheat area planted projected to be smallest on record. Figure 1: U.S. wheat planted area by class
 Economic Research Service Situation and Outlook WHS-17d April 13, 2017 Wheat Chart Gallery will be updated on April 13, 2017. The next release is May 12, 2017. -------------- Approved by the World Agricultural
What are the risks? Crop Market Outlook
 What are the risks? 2012-13 Crop Market Outlook Frayne Olson, PhD Crop Economist/Marketing Specialist NDSU Extension Service ND Agricultural Experiment Station Dept. of Agribusiness & Applied Economics
February 28, Dear Subscriber:
 February 28, 2014 Dear Subscriber: This has been a week when the bears have gained control of the soybean market, unwinding bull spreads (selling May and buying back November 2014 soybeans). Our analysts
Corn & Soybeans. Corn (source WASDE) Soybean (source WASDE)
 Soybean (source WASDE)") Corn & Soybeans Corn (source WASDE) Estimate for the 2015-16 Season Global and US outlook Soybean (source WASDE) Estimate for the 2015-16 Season Global and US outlook Global ending stocks Corn and Soybeans
Corn & Soybeans Corn (source WASDE) Estimate for the 2015-16 Season Global and US outlook Soybean (source WASDE) Estimate for the 2015-16 Season Global and US outlook Global ending stocks Corn and Soybeans
Small Grains 2014 Summary
 United s Department of Agriculture National Agricultural Statistics Service Small Grains 4 Summary September 4 ISSN: 94962X All wheat production totaled 2.04 billion bushels in 4, down 5 percent from
Corn & Soybeans. Corn (source WASDE) Soybeans (source WASDE)
 Soybeans (source WASDE)") Corn & Soybeans Corn (source WASDE) Estimate for the 2014-15 Season Global and US outlook Production, utilization and stocks Soybeans (source WASDE) Estimate for the 2014-15 Season Global and US outlook
Corn & Soybeans Corn (source WASDE) Estimate for the 2014-15 Season Global and US outlook Production, utilization and stocks Soybeans (source WASDE) Estimate for the 2014-15 Season Global and US outlook
World Agricultural Supply And Demand Estimates
 World Agricultural Supply And Demand Estimates United States Department of Agriculture Office of the Chief Economist Agricultural Marketing Service Economic Research Service Farm Service Agency Foreign
World Agricultural Supply and Demand Estimates United States Department of Agriculture
 ISSN1554-9089 Office of the Chief Economist World Agricultural Supply and Demand Estimates United States Department of Agriculture Agricultural Marketing Service Farm Service Agency Economic Research Service
U.S. Rice Market Faces Tighter Supplies and Higher Prices in 2017/18
 U.S. Rice Market Faces Tighter Supplies and Higher Prices in 217/18 University of Arkansas Webinar Series October 26, 217 Nathan Childs Economic Research Service USDA Approved by the World Agricultural
All Approved Insurance Providers All Risk Management Agency Field Offices All Other Interested Parties
 United States Department of Agriculture Farm Production and Conservation Risk Management Agency 1, 2017 INFORMATIONAL MEMORANDUM: PM-17-051 TO: All Approved Insurance Providers All Risk Management Agency
2019 Grain Market Outlook
 2019 Grain Market Outlook Ness City, Kansas January 7, 2019 DANIEL O BRIEN EXTENSION AGRICULTURAL ECONOMIST Topics to be discussed.. 1) Macroconomic forces at work in the U.S. & where they are taking U.S.
Grain Market Outlook for
 Grain Market Outlook for 2017-2018 KSU Ag Econ 520 Fall 2017 Manhattan, Kansas DANIEL O BRIEN EXTENSION AGRICULTURAL ECONOMIST Topics to be discussed.. 1) Grain Market Analysis & Outlook Corn & Grain Sorghum
Iowa Farm Outlook. December 15, 2004 Ames, Iowa Econ. Info. 1900
 Iowa Farm Outlook December 15, 24 Ames, Iowa Econ. Info. 19 Beef and Pork Price Relationships Historically, beef and pork prices have moved somewhat together. They are substitutes in the consumer s shopping
World Agricultural Outlook Board Interagency Commodity Estimates Committee Forecasts. Lockup Briefing July 11, 2014
 World Agricultural Outlook Board Interagency Commodity Estimates Committee Forecasts Lockup Briefing World Wheat Production Country or Region estimate 2014/15 forecast June 11 Million Tons Percent Percent