SINGLE SUPER PHOSPHATE
|
|
|
- Osborn Robbins
- 5 years ago
- Views:
Transcription
1 PROJECT REPORT FOR MANUFACTURE OF SINGLE SUPER PHOSPHATE 350 TPD PSSP WITH 300 TPD GSSP ON THE BASIS OF 300 WORKING DAYS AT VILLAGE: DHORIA TEHSIL : NIMBAHEDA DIST. CHITTOR GARH BY `ANAPOORANA FERTILIZER & PESTICIDES PVT. LTD NIMBAHEDA NPN 1
2 Demand for Fertilizer in India Introduction Chemical fertilizers are key element of modern technology and have played an important role in agricultural productivity growth in India. However, the demandsupply gap of fertilizers in India has increased in recent times, thereby leading to increased dependency on imports. Indian imports, which were about 2 million tones in early part of 2000, increased to 10.2 million tones of fertilizers in In view of importance of fertilizers in agricultural growth and the possibility of an emerging demand-supply gap, there is need to forecast future demand. The report begins with an overview of fertilizer consumption trends and then identifies important determinants of fertilizer demand and develops projects demand scenarios for fertilizers in India in India is the second largest consumer of fertilizers in the world after China, consuming about 26.5 million tones. However, average intensity of fertilizer use in India remains much lower than most countries in the world but is highly skewed, with wide inter-regional, inter-state, and inter-district variations. The results show that non-price factors such as irrigation, high yielding varieties, were more important than price factors in influencing demand for fertilizers. Of the two price policy instruments, affordable fertilizer prices and higher agricultural commodity prices, the former is more powerful in influencing fertilizer demand. The report suggests that in order to ensure self-sufficiency in agricultural production in the country, availability of fertilizers at affordable prices should be prioritized over higher output prices. By 2020, fertilizer demand in the country is projected to increase to about 41.6 million tones and is expected to grow at a faster rate in eastern and southern region compared with north and west. To meet the increasing fertilizer requirements of the country, a conducive and stable policy environment, availability of raw materials, capital resources, and price incentives will play a critical role. NPN 2
3 The role of chemical fertilizers for increased agricultural production, in particular in developing countries, is well established Some argue that fertilizer was as important as seed in the Green Revolution (Tomich et. al. 1995), contributing as much as 50 percent of the yield growth in Asia (Hopper 1993 and FAO 1998). Others have found that one-third of the cereal production world-wide is due to the use of fertilizer and related factors of production (Bumb 1995). During the last three decades, India has relied on increasing crop yields to supply an ever increasing demand for food. According to Ministry of Agriculture data, total food grains production in the country rose from million tons in 1980s ( to ) to million tons in 1990s and 212 million tons in 2000s (Figure 1), Meanwhile, total area under food grains, which accounts for nearly two-third of total cropped area, has declined by over 4 percent from its 1980s level and down 7.4 percent from the peak of million hectares in This increase in food grains production was the result of about 46 percent increase in crop yields between 1980s and 2000s. However rate of increase in crop yields has decelerated in the recent decade (12.4 percent in 2000s compared with over 30 percent in 1990s). During last decades, India lost about 2.5 million hectares of net sown area (Figure 1). The options for increasing food production are limited by availability of land as well as water. Increasing population, among other factors, limits any significant expansion of arable land. Fertiliser consumption in India has been increasing over the years and today India is one of the largest producer and consumer of fertilizers in the world. By , total fertilizer consumption in the country was million nutrient tones. Importance of fertilizers in yield improvement, which is essential for achieving increased agricultural production, further increases because there is little scope for bringing more area under cultivation as well as majority of Indian soils are deficient in many macro and micro nutrients. The application of essential plant nutrients, particularly major and micronutrients in optimum quantity and right proportion, through correct method and time of application, is the key to increased NPN 3
4 and sustained crop production. Therefore it is important to understand fertiliser use behavior in the country over time as well as role of factors influencing fertiliser consumption at the national and regional/state level because intensity of fertiliser use varies from state to state and area to area. What explains these variations in fertilizer use across states/regions in the country? Why have some states/regions experienced positive growth in fertilizer consumption while others have seen stagnation/decline? What factors (e.g., agro-climatic characteristics, institutional and infrastructure variables, economic factors) play a significant role in shaping fertilizer consumption patterns (Figure 2)? To address some of these issues, fertilizer demand models can be constructed to link fertilizer consumption with price and non-price factors using national and state-level data. Figure 1. Trends in food grains acreage, production and yield and net sown area in India Foodgrains Area under Foodgrains Million tonnes Million tonnes to to to to to to Foodgrains Yield Net Sown Area Tonnes / ha 1.0 Million ha to to to to to to Source: MoA (2010) NPN 4
5 2. Fertiliser Consumption Trends in India Fertiliser consumption trends expressed in terms of aggregate quantities consumed and intensity of use (i.e., kg per hectare of total cropped area) reflect both demand and supply decisions. Therefore, it is essential to understand fertilizer situation in the country. In this section growth trends in total fertilizer consumption and intensity of use at all-india level as well as regional/state level are discussed. 2.1 Total Fertiliser Consumption: All-India India is the second largest consumer of fertilizers in the world, after China. It accounted for 15.3 per cent of the world's N consumption, 19 per cent of Phosphatic (P) and 14.4 per cent of Potassic (K) nutrients in 2008 (FAI, 2010). Trends in fertilizer consumption in terms of total quantities in the country are presented in Figure 3. Fertiliser consumption was around 78 thousand tones in and it picked up very fast during the late-1960s and 1970s. At the time of onset of green revolution in consumption of fertilizers was about 1 million tones. In , total fertilizer consumption increased to 2.26 million tones, which further increased to million tons in The rapid expansion of irrigation, spread of HYV seeds, introduction of Retention Price Scheme2, distribution of fertilizers to farmers at affordable prices, expansion of dealer's network, improvement in fertilizer availability and virtually no change in farm gate fertilizer prices for 10 years ( ) were major reasons for increase in fertilizer consumption during 1971 to During 1990s, total fertilizer consumption fluctuated between and 16.8 million tones with the exception in , when fertilizer consumption was over 18 million tones. Total fertilizer consumption reached a record level of 26.5 million tons during NPN 5
6 Figure 3: Trends in fertilizer consumption (N, P and K) in India: to Source: Fertiliser Association of India (2010) The fertilizer consumption in India has generally exceeded domestic production in both nitrogenous and Phosphatic fertilizers except for few years. The entire requirement of Potassic fertilizers is met through imports as India does not have commercially viable sources of potash. During 1950s and 1960s, about two-third of domestic requirement of N fertilizers was met through imports. The level of P imports was very low in the fifties, which increased significantly during the sixties and seventies. With the introduction of the high yielding varieties of wheat and rice in mid-1960s, the fertilizer imports increased significantly in and thereafter. The fertilizer imports increased dramatically in and , and again in and However, during the decade of 1990s imports were at low levels except in and Due to low/no addition in domestic capacity coupled with rise in demand for fertilizers during the last two decades, imports have increased significantly in the 2000s. India imported about million tons (about 41% of total consumption) of NPK fertilizer nutrients in as against 1.93 million tons in The growth of imports was rather slow in the eighties and nineties but accelerated in 2000s. The share of imports in NPN 6
7 total consumption (N+P+K) declined from 57 per cent in 1960s to 43 per cent in 1970s, further to about 24.8 per cent in 1980s, 21.3 percent in 1990s but increased to 26.2 per cent in 2000s. Almost similar trend was observed in case of nitrogenous and Phosphatic fertilizers. The share of imports in total consumption was 13.8 percent in case of N and 23.8 percent in P during the 2000s. However, in terms of volume of imports, N fertilizer imports declined during the 1980s compared with 1970s, which marginally increased during the 1990s (1.1 million tons) and further increased (1.79 million tons) in the 2000s, while in case of Phosphatic fertilizers imports have consistently increased over time from thousand tones in 1970s to thousand tones in 1980s, thousand tones in 1990s and 1.25 million tons in 2000s. Rising share of imports is a matter of concern as world fertilizer markets are highly volatile and imperfect. So there is a need to increase domestic production to insulate from international markets. Sixteen plant food nutrients are essential for proper crop development. Each is equally important to the plant, yet each is required in different amounts. These differences have led to the grouping of these essential elements into three categories; primary (macro) nutrients, secondary nutrients, and micronutrients. Primary (macro) nutrients are nitrogen (N), phosphorus (P), and potassium (K). They are the most frequently required in a crop fertilization program and are needed in the larger quantity by plants as fertilizer. The secondary nutrients include calcium, magnesium, and Sulphur. For most crops, these three are needed in lesser amounts than the primary nutrients. The micronutrients such as boron, chlorine, copper, iron, manganese, molybdenum, and zinc are used in small amounts, but they are as important to plant development and profitable crop production as the major nutrients. However, major focus of the Indian fertilizer sector policy has been on primary (macro) nutrients. The changing pattern of three primary nutrients is presented in Figure 4. Nitrogenous fertilizers account for nearly two-third of total nutrient consumption in the country. The share of N was 78,5 per cent in 1950s, which declined to 68,6 per cent in the sixties, 67,9 per cent NPN 7
8 in the seventies and further to 65.7 per cent in the eighties. However, the share of N increased to 67.9 per cent in the 1990s, which fell to 62.9 per cent in the 2000s. Figure 4. Share of primary nutrients (N, P and K) in total consumption of fertilizer Percentage s 1960s 1970s 1980s 1990s 2000s K P N Source: Fertiliser Association of Indict (2010) In case of P fertilizers, the share has increased from 13.5 per cent in 1950s to 21.4 per cent in the 1960s which marginally declined during the 1970s and again picked up during the eighties (24.1%), During the 1990s the share of P in total consumption declined to 23.6 per cent and then increased during the 2000s (25.6%). Likewise the share of K. increased from 8 per cent in 1950s to 11.4 per cent in 1970s, declined to 10.2 per cent in the eighties and further fell to 8.5 per cent in the 1990s. The share of K increased to 11.5 per cent in the 2000s. The rise in share of N and decline in the share of P and K fertilizers during the decade in nineties was mainly because of slow growth in consumption of P and K fertilizers compared with N fertilizers due to decontrol of P and K fertilizers and relatively NPN 8
9 high increase in their prices vis-à-vis N fertilizers, which remained almost stable during the decade. Concerned with the problem of increasing imbalance in use of primary nutrients, government introduced a concession scheme on the sale of decontrolled P and K fertilizers to the farmers in mid-1990s but still prices of these fertilizers were higher than nitrogenous fertilizers. In the late-1990s and early- 2000s government hiked the concession rates for P and K fertilizers, which led to increase in their consumption and higher share in total fertilizer use during the 2000s. 2.3 Growth Rates in Fertiliser Consumption and Food grains Production The growth rates in consumption of fertilizers and food grains during different time periods at all-india level are given in Table 1. The table shows that fertilizer consumption increased by more than 19 per cent in the pre-green revolution period ( to ) while food grains production increased by only 2.56 per cent. The reason for such a high growth in fertilizer consumption was that consumption in the base year ( ) was very low. This significant increase in total fertilizer consumption increased per hectare fertilizer use from less than one kg in to about 7 kg in In the post-green revolution period, fertilizer use increased by 9.9 per cent per year during the first phase of green revolution ( to ) when spread of high yielding varieties was limited to mainly Punjab, Haryana, western part of Uttar Pradesh and some southern states. Per hectare fertilizer consumption increased from 9.4 kg in to 31.9 kg in Increase in fertilizer use along with increase in area under irrigation and high yielding varieties increased food grains production from 95.5 million tons in to about 130 million tons in at an annual compound growth rate of 2.27 per cent. However, food NPN 9
10 grains productivity increased at a faster rate (1.87%) in the first phase of green revolution compared with pre-green revolution period (1.45%). During the second phase of green revolution ( to ), when technology spread to other parts of the country, total fertilizer consumption increased an annual growth rate of 7.39 per cent. Per hectare fertilizer consumption more than doubled from 34.3 kg in to 69.8 kg in Total food grains production increased by about 2.8 per cent. The impressive growth of consumption of fertilizer in India in the post-green revolution period ensured increase in food grains production from 74.3 million tons in to million tons during However, in , certain policy reforms were initiated hi fertilizer sector as part of macro-economic reforms. The Potassic and Phosphatic fertilizers were decontrolled w.e.f. August 25, 1992, the low analysis nitrogenous fertilizers viz. calcium ammonium nitrate, ammonium chloride and ammonium sulphate were decontrolled and brought under control several times in the past. These fertilizers were last decontrolled w.e.f. June 10, These policy interventions led to a serious slowdown in fertilizer consumption in the post-reforms period. Total fertilizer consumption declined from about 12,7 million tones in to 12.1 million tones in Similarly, per hectare fertilizer use also declined from kg in to kg in , This reduction was more pronounced in case of Phosphatic and Potassic fertilizers. Total P consumption fell by about 14 per cent (from thousand tones in to thousand tons in ) and K. by 35 per cent ( thousand tons in to thousand tons in ). Similar trend was observed in case of per hectare fertilizer consumption. Due to introduction of concession scheme on decontrolled Phosphatic and Potassic fertilizers in , fertilizer consumption started picking up and reached a level of 18.1 million tons in , declined to 16.7 million tons in and remained below this level up to Per hectare NPN 10
11 fertilizer consumption reached a level of kg in but remained below this level during the next four years. Last six years viz., to have seen significant recovery in fertilizer use in the country and total consumption reached a record level of 26.5 million tones and per hectare consumption at kg in The impact of slow growth of fertilizer consumption on growth of food grains production and crop output in the post-reforms period is quite evident from growth rates presented in Table 1. In post-reforms period ( to ) growth rate in fertilizer consumption was 3.98 per cent compared with over 8.75 per cent during to Total fertilizer consumption recorded the lowest growth (1.35%) during the 9 th five year plan compared with about 7.57 per cent during 10 th plan. There seems to be a very high positive association between growth rates of fertilizer consumption and food grains production. During 8th plan period fertilizer consumption increased at an annual growth rate of about 4.51 per cent and food grains production increased by 1.26 per cent. Fertiliser consumption growth rate fell to 1.35 per cent during 9th plan and food grains production growth rate also declined to per cent. During 10th five year plan, fertilizer consumption grew by 7,57 per cent and food grains production growth rate increased to about 2.52 per cent. In the post-reforms period ( to ) growth rate in fertilizer consumption turned out to be less than half of what was achieved during the post-green revolution period ( to ). Similar trend was observed in case of food grains production. Growth rate in food grains production declined to about half (1.33%) during to compared with 2.65 per cent during to NPN 11
12 Table 1: Growth rate in fertilizer consumption and food grains production Period Pre-green revolution period ( ) Growth rate in fertilizer consumption (%) Growth rate in Food grains (%) Total Per ha. Production Yield Post-green revolution period Phase I ( ) Phase II ( ) Post-reforms Period ( to ) th Five Year Plan th Five Year Plan th Five Year Plan Source: Fertiliser Association of India (2010) 2.4 Intensity of Fertiliser Use Looking at the total fertilizer consumption is not a good indicator as there are large differences in total cropped area across states. It would be more appropriate to examine trends in fertilizer consumption per hectare of cropped area. On per hectare basis, fertilizer consumption was less than 2 kg during the 1950s and increased to about 5 kg in However, after introduction of green revolution in , per hectare fertilizer consumption more than doubled in the next five years from about 7 kg in to about 16 kg in , which further increased and reached a level of 50 kg in mid-1980s (Figure 6). Average fertilizer consumption on per hectare basis crossed 100 kg in and reached a record level of 135 kg in However, per hectare fertilizer consumption fell during and due to oil shock of 1973 when oil prices quadrupled almost overnight. The next reversal in intensity of fertilizer use came NPN 12
13 in when government decontrolled Phosphatic and Potassic fertilizers and increased fertilizer prices significantly. The decline in use of fertilizers was the highest (36.3%) in case of Potassic and about 16 per cent in Phosphatic fertilizers. The total fertilizer consumption (N+P+K) fell by about 6 per cent from kg per hectare to kg per hectare. Due to severe drought in many parts of the country, per hectare fertilizer consumption declined from kg in to kg per hectare in However, during the last five years, intensity of fertilizer use has increased substantially (53%) from about 88 kg in to 135 kg per hectare in Table 2: Fertiliser use intensity and growth in fertilizer use intensity, by states Intensity of fertilizer use (kg/ha) National Average (40.5%) % growth in fertilizer use intensity < National average National average during TE ( 126.5) <National average during TE (<126.5) Pondicherry (903.2, 80.1%) Andhra Pradesh (217.2, 43.4%) Haryana (199.0, 40.6%) Bihar (166.7,83.4%) Gujarat (143.8, 50.9%) Kamataka (139.2,41) Maharashtra (117.2, 46.2%) Jammu & Kashmir (87.7, 46.4%) Madhya Pradesh (72.5, 52.7%) Assam (59.3, 172.0%) Orissa (56.2, 55.9%) Himachal Pradesh (55.7, 45.2%) Mizoram(47.4,341.6%) Tripura(45.8, 110.3%) Punjab (223.9, 27.9%) Tamil Nadu (200.6, 31.3%) Uttar Pradesh (160.8, 34.3%) West Bengal (156.2, 29.6%) Kerala (86.7, 28.2%) Manipur (72.3, -12.2%) Rajasthan (47.1,26.2%) Meghalaya (13.9, -10.9%) Arunachal Pradesh (2.9, 20.8%) Nagaland (2.3,-24.2%) Note: Growth in fertilizer use is defined as the per cent increase in mean fertilizer use intensity between the TE and the TE Numbers in parentheses are the mean fertilizer use intensity for TE , and the per cent increase in fertilizer use intensity as defined above. NPN 13
14 Source: Fertiliser Association of India (2010) 4.2 Fertiliser Demand Projections Based on the estimated regression results and the projected values of the explanatory variables, we forecasted the demand for fertilizer in year and The demand forecasts have been made assuming the growth in explanatory factors according to the last five year time trend ( to ) and in case of fertilizer prices, we have assumed an increase of about 5 percent per year. A comparison between the actual fertilizer nutrients consumption and model estimated consumption (Figure 10) shows the mode) tracks historical data well. The fertilizer requirement forecasts shown in Table 6 were generated by an estimated model using historical fertilizer consumption data. The total demand for fertilizers (N+P+K) is projected to increase to about 35 million tons by and 41.6 million tons by The demand for N is expected to increase to about 19.9 million tones and 23 million tones during the corresponding period. In case of P fertilizers demand is projected at 9.6 in and 11.5 million tons in For K fertilizers the demand is projected to reach about 5.5 million tones and 7.1 million tons by and , respectively. Figure 10. Trends in actual and estimated consumption of fertilizer nutrients in India: to NPN 14
15 Table 6. Annual fertilizer nutrient projections for and N P K N+P+K Total , , , , Projections for total nutrients demand is based on regression equation estimated for total fertilizer nutrient consumption while demand forecasts for N+P+K are sum of demand for N, P and K estimated by regression equations for N. P and K separately. Therefore there is a marginal difference between two estimates. NPN 15
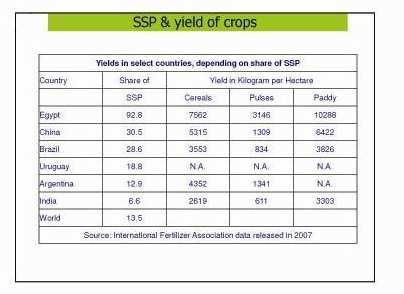
16 The demand for fertilizer products such as urea, DAP, SSP, MOP and complex fertilizers was estimated by using averages of their percentage shares in N, P and K consumption, respectively, using data over the period to (Table 7). Taking into account the average consumption level of 80.9 per cent of N through urea, 63 per cent of P through DAP, 29.3 per cent through complex fertilizers, 7.2 per cent P through SSP and 70.1 per cent K through MOP during and , the product-wise demand for fertilizer products for the period and were worked out and the figure are presented in Table 8. The demand for urea is projected to be around 34.8 million tons by and reach a level of 40.3 million tons by The demand for DAP, complex fertilizers (excluding DAP) and SSP would be nearly 13.1, 4.3 and 11.4 million tons in and 15.8, 5.2 and 13.6 million tons by The demand for MOP would be around 6.4 million tons by and 8.3 million tons in These projections of demand for fertilizer products are based on existing product nutrient ratio. However, with introduction of nutrient-based pricing scheme and programs like national project on Management of Soil and Fertiliser Health to promote balanced use of fertilizer nutrients, the demand for SSP and complex fertilizer might increase at a faster rate in the coming years. Table 7. Share of major fertilizers products in total consumption of N, P and K nutrients: to Year Share of Share of Share of SSP Urea in Total DAP in in Total P Share of MOP in Total Share of Complex , NPN 16
17 Average Source: FA1 (2010) Table 8: Fertiliser product demand forecasts for and Urea DAP SSP MOP Complex fertilizers , NPN 17
18 NPN 18
19 NPN 19
20 NPN 20
21 NPN 21

22 NPN 22
23 NPN 23
24 NPN 24
25 NPN 25
26 NPN 26
27 NPN 27
28 NPN 28
29 NPN 29
30 NPN 30
31 NPN 31
32 NPN 32
Demand for Fertilisers in India: Determinants and Outlook for 2020
 Ind. Jn. of Agri. Econ. Vol.66, No.4, Oct.-Dec. 2011 Demand for Fertilisers in India: Determinants and Outlook for 2020 Vijay Paul Sharma and Hrima Thaker* I INTRODUCTION The role of chemical fertilisers
An overview of production and consumption of major chemical fertilizers in India
 2017; 6(6): 2353-2358 E-ISSN: 2278-4136 P-ISSN: 2349-8234 JPP 2017; 6(6): 2353-2358 Received: 09-09-2017 Accepted: 10-10-2017 Praveen Desai Research Scholar, Department of of Agriculture [UAS-D], Dharwad,
Rice Production and Nutrient Management in India
 I n d i a Rice Production and Nutrient Management in India By K.N. Tiwari The demand for rice in India is projected at 28 million tonnes (M t) for the year 202 and will require a production level of 3,000
Soil Health Management in India
 Soil Health Management in India Soil Health Management in India Soil Health Management In order to improve the soil health of the Indian soils, gov- The nature and extent of deficiencies of nutrients in
Fertiliser Growth, Imbalances and Subsidies : Trends and Implications
 Discussion Paper: NPP 02/2008 Fertiliser Growth, Imbalances and Subsidies : Trends and Implications Ramesh Chand L.M. Pandey National Professor Project National Centre for Agricultural Economics and Policy
Fertiliser Growth, Imbalances and Subsidies: Trends and Implications
 NPP Discussion Paper 02/2008 Fertiliser Growth, Imbalances and Subsidies: Trends and Implications Ramesh Chand and L. M. Pandey April, 2008 National Professor Project National Centre for Agricultural Economics
India s Positioning in the Global Fertilizer Industry
 Market Update Kg/Hectare Arable Land India s Positioning in the Global Fertilizer Industry Country-Wise Consumption of Fertilizers 8,000 7,000 6,000 5,000 4,000 3,000 2,000 1,000-6898.7 2759.6 1750 157.52
FERTILISER INDUSTRY IN INDIA
 Chapter 3 FERTILISER INDUSTRY IN INDIA With over one billion people, India is the second most populous country in the world. During 1999-2000. the food production achieved an all time high record of 208.9
Forest Cover and Forest Area
 Forest Cover and Forest Area Chapter 3 FOREST COVER AND FOREST AREA The term 'Forest Area' (or recorded forest area) generally refers to all the geographic areas recorded as forest in government records.
Progress and Potential of Horticulture in India
 Ind. Jn. of Agri.Econ. Vol.63, No.3, July-Sept. 2008 SUBJECT I TRIGGERING AGRICULTURAL DEVELOPMENT THROUGH HORTICULTURE CROPS Progress and Potential of Horticulture in India Ramesh Chand, S.S. Raju and
FACTORS AFFECTING FERTILIZER CONSUMPTION IN HARYANA R.P.S.MALIK C.S.C.SEKHAR AGRICULTURAL ECONOMICS RESEARCH CENTRE UNIVERSITY OF DELHI DELHI
 1 Research Study No 2007/4 FACTORS AFFECTING FERTILIZER CONSUMPTION IN HARYANA R.P.S.MALIK C.S.C.SEKHAR AGRICULTURAL ECONOMICS RESEARCH CENTRE UNIVERSITY OF DELHI DELHI 110007 JULY 2007 2 ACKNOWLEDGMENTS
IMPACT OF GLOBALIZATION ON THE AREA, PRODUCTION AND YIELD OF THE FOODGRAINS IN INDIA
 IMPACT OF GLOBALIZATION ON THE AREA, PRODUCTION AND YIELD OF THE FOODGRAINS IN INDIA Vivek Kumar Mishra Junior Research Fellow, Department of Economics, University of Allahabad, Allahabad (India) ABSTRACT
REGIONAL CONVERGENCE IN AGRICULTURE GROWTH IN INDIA: A STATE LEVEL ANALYSIS
 REGIONAL CONVERGENCE IN AGRICULTURE GROWTH IN INDIA: A STATE LEVEL ANALYSIS Anju Rani Research Scholar, Dept. of economics, Central University of Haryana Dr. Ranjan Aneja Head, Assistant Professor, Dept.
A COMPARATIVE STUDY OF MARGINAL FARMS IN INDIA VIS-A-VIS WEST BENGAL DURING LAST DECADE
 Journal of Economic & Social Development, Vol. - XIII, No. 2, Dec. 2017 A COMPARATIVE STUDY OF MARGINAL FARMS IN INDIA VIS-A-VIS WEST BENGAL DURING LAST DECADE Amit Mandal* ISSN 0973-886X Agriculture is
Inter-Linkages Among Agricultural Research Investment, Agricultural Productivity and Rural Poverty in India
 Inter-Linkages Among Agricultural Research Investment, Agricultural Productivity and Rural Poverty in India Kiresur V.R and Melinamani V.P. Paper prepared for presentation at the 12 th EAAE Congress People,
Determinants of Demand for Fertilizer: A Case for India
 Determinants of Demand for Fertilizer: A Case for India Kalyan Chakraborty School of Business, Emporia State University, USA Email: kchakrab@emporia.edu ABSTRACT In India agriculture contributes 14 percent
PRODUCTIVITY STATUS OF RICE DURING NINTH PLAN
 1 PRODUCTIVITY STATUS OF RICE DURING NINTH PLAN Prepared and Edited by Dr. M.C. Diwakar, Director DIRECTORATE OF RICE DEVELOPMENT GOVERNMENT OF INDIA MINISTRY OF AGRICULTURE (DEPTT. OF AGRI. & CO-OPERATION)
FUTURE PROSPECTUS OF INDIAN FERTILIZERS - A REVIEW
 FUTURE PROSPECTUS OF INDIAN FERTILIZERS - A REVIEW Dr. M. RAJARAJAN Assistant Professor, Commerce Wing, DDE, Annamalai University, Annamalainagar - 608 002 Dr. T. SIVAKUMAR Assistant Professor, Department
Fertilizer Sector Subsidy in India. Vijay Laxmi Pandey Suresh Babu
 Fertilizer Sector Subsidy in India Vijay Laxmi Pandey Suresh Babu Indian Agriculture Net area sown : 141 Mha Cropping intensity : 139.5 Smallholders - 67% holdings < 1ha Number of operational holding 138
Comparative Study of Marginal Farms in India vis-a-vis West Bengal; Evidences from Last Decade
 Economic Affairs, Vol. 61, No. 4, pp. 589-598, December 2016 DOI: 10.5958/0976-4666.2016.00073.5 2016 New Delhi Publishers. All rights reserved Comparative Study of Marginal Farms in India vis-a-vis West
Economic implications of land degradation on sustainability and food security in India
 Agropedology 23, 13(2), 19-27 Economic implications of land degradation on sustainability and food security in India A. K. VASISHT, R. P. SINGH AND V. C. MATHUR Division of Agricultural Economics, Indian
SUBJECT: MINUTES OF THE MEETING OF THE CROP WEATHER WATCH GROUP HELD ON
 F. No. 31/ 201819CFCCES GOVERNMENT OF INDIA MINISTRY OF AGRICULTURE AND FARMERS WELFARE DEPARTMENT OF AGRICULTURE, COOPERATION AND FARMERS WELFARE (CROP FORECAST COORDINATION CENTRE) Room No. 344A Krishi
Fertilizer subsidies in India: an insight to distribution and equity issues
 Journal of Crop and Weed, 13(3) : 24-31 (2017) Fertilizer subsidies in India: an insight to distribution and equity issues K.V. PRAVEEN, K.S. ADITYA, M. L. NITHYASHREE AND A. SHARMA Division of Agricultural
Dynamics of Land Use Competition in India: Perceptions and Realities. Vijay Paul Sharma
 INDIAN INSTITUTE OF MANAGEMENT AHMEDABAD INDIA Dynamics of Land Use Competition in India: Perceptions and Realities Vijay Paul Sharma W.P. No. 2015-06-02 June 2015 The main objective of the working paper
Indian Pulses Market.
 Indian Pulses Market Indian Pulses Market India is the largest producer, importer and consumer of pulses, accounting for 25% of global production from 35% of global area under pulses. However, the productivity
AGRICULTURE SHORT ANSWER TYPE QUESTIONS [3 MARKS]
![AGRICULTURE SHORT ANSWER TYPE QUESTIONS [3 MARKS]](/thumbs/79/79737240.jpg "AGRICULTURE SHORT ANSWER TYPE QUESTIONS [3 MARKS]") AGRICULTURE SHORT ANSWER TYPE QUESTIONS [3 MARKS] 1. Distinguish between primitive subsistence farming and intensive subsistence farming. The following are the differences between primitive subsistence
AGRICULTURE SHORT ANSWER TYPE QUESTIONS [3 MARKS] 1. Distinguish between primitive subsistence farming and intensive subsistence farming. The following are the differences between primitive subsistence
DEMAND FOR FRUITS AND VEGETABLES IN INDIA
 Agric. Econ. Res. Rev., Vol. 8(2), pp. 7-17 (1995) DEMAND FOR FRUITS AND VEGETABLES IN INDIA Praduman Kumar and Mruthyunjaya Division of Agricultural Economics, IARI, New Delhi India is a vast country,
ARE DISPARITIES IN INDIAN AGRICULTURE GROWING?
 ARE DISPARITIES IN INDIAN AGRICULTURE GROWING? Indian agriculture has witnessed tremendous changes during the last 3 decades following the adoption of green revolution technology during late 1960's The
Status of Poverty in India A State wise Analysis
 Status of Poverty in India A State wise Analysis Dr Waheeda Sunny Thomas Faculty Economics, SEMCOM, Gujarat, India ABSTRACT First millennium development goal is to eradicate extreme poverty and hunger.
SUBJECT: MINUTES OF THE MEETING OF THE CROP WEATHER WATCH GROUP HELD ON
 F. No. 31/ 201718CFCCE&S GOVERNMENT OF INDIA MINISTRY OF AGRICULTURE AND FARMERS WELFARE DEPARTMENT OF AGRICULTURE, COOPERATION AND FARMERS WELFARE (CROP FORECAST COORDINATION CENTRE) Room No. 344A, Krishi
Prices and Profitability of Fertilizers
 33 Chapter 5 Prices and Profitability of Fertilizers Prices of fertilizers As fertilizer is an essential input for agricultural production, the Government s objective is to make this critical input available
Growth and Pattern of Fertilizer Consumption in Haryana
 Available online at: http://euroasiapub.org pp. 138~148 Thomson Reuters Researcher ID: L-5236-2015 Growth and Pattern of Fertilizer Consumption in Haryana Dr. Sandeep Kumar 1, Lecturer Economics, dept.
At a Glance. Area under wheat cultivation is on higher side compared to last year.
 At a Glance Area under wheat cultivation is on higher side compared to last year. During October 1 st to December 15 th, area covered under wheat cultivation was 232.59 lakh hectares, up by 10.4% from
1 What are three cropping seasons of India? Explain any one in brief. 2 Discuss three main impacts of globalization on Indian agriculture.
 1 What are three cropping seasons of India? Explain any one in brief. 2 Discuss three main impacts of globalization on Indian agriculture. 3.Distinguish between rabi and kharif season? 4. What is Horticulture?
SUBJECT: MINUTES OF THE MEETING OF THE CROP WEATHER WATCH GROUP HELD ON
 F. No. 31/ 201718CFCCE&S GOVERNMENT OF INDIA MINISTRY OF AGRICULTURE AND FARMERS WELFARE DEPARTMENT OF AGRICULTURE, COOPERATION AND FARMERS WELFARE (CROP FORECAST COORDINATION CENTRE) Room No. 344A, Krishi
22: List of Studies Conducted by Agro-Economic Research Centres
 22: List of Studies Conducted by Agro-Economic Research Centres 2006-07 1 India s Global Tea Trade Reducing Share, Declining Competitiveness. 2 Developing India s Strategic Responses to the Global Debate
PROGRAMMES AND SCHEMES Monsoon and Crop Sowing Situation during Kharif-2012
 PROGRAMMES AND SCHEMES Monsoon and Crop Sowing Situation during Kharif-2012 As per India Meteorological Department (IMD) data SW Monsoon rainfall for the country as a whole during June- September, 2012
Growth and Inclusion: Theoretical and Applied Perspectives
 THE WORLD BANK WORKSHOP Growth and Inclusion: Theoretical and Applied Perspectives Session I Food Inflation: Drivers and Policy Implications Subir Gokarn Reserve Bank of India January 12, 212 The Claridges
has taken place in western and south-western states, whereas crop specialization has occurred
 Trans. Inst. Indian Geographers Joydeep Saha, New Delhi agricultural economy in terms of income, employment and security. Obtaining required secondary data on area under crops, this paper attempts to explore
GENERAL CROP ESTIMATION SURVEY (GCES)
") GENERAL CROP ESTIMATION SURVEY (GCES) R.P. Rathi NSSO (FOD) Agricultural Statistics Wing, CGO Complex, Block-II, NH-IV, Faridabad-121 001 1. INTRODUCTION In the context of primacy of Agriculture, timely
GENERAL CROP ESTIMATION SURVEY (GCES) R.P. Rathi NSSO (FOD) Agricultural Statistics Wing, CGO Complex, Block-II, NH-IV, Faridabad-121 001 1. INTRODUCTION In the context of primacy of Agriculture, timely
Regional Pattern of Agricultural Growth and Rural Employment in India: Have Small Farmers Benefitted?
 Agricultural Economics Research Review Vol. 26 (Conference Number) 2013 pp 1-11 Regional Pattern of Agricultural Growth and Rural Employment in India: Have Small Farmers Benefitted? M.L. Nithyashree* and
Growth and Instability in Foodgrains Production in West Bengal
 International Journal of Social Science : 2(1) 11-18, June, 2013 Growth and Instability in Foodgrains Production in West Bengal S. Maji and B.K. Bera Department of Agricultural Economics, Bidhan Chandra
Pesticide Consumption in Agriculture in India - an Update
 Pesticide Research Journal Vol. I2 (1). 150-155. June. 2000 Pesticide Consumption in Agriculture in India - an Update lndia is the third largest consumer of pesticides in the world and highest among the
SUSTAINABLE AGRICULTURE DEVELOPMENT IN INDIA: A CASE STUDY OF UTTAR PRADESH ABSTRACT
 SUSTAINABLE AGRICULTURE DEVELOPMENT IN INDIA: A CASE STUDY OF UTTAR PRADESH ABSTRACT Agriculture is a critical sector of the Indian economy. It forms the backbone of development in the country. An average
Logistics Management of Fertilisers in North India with special reference to Uttar Pradesh
 Volume.2,Issue.11,November,.2016 Logistics Management of Fertilisers in North India with special reference to Uttar Pradesh 1.Mr. Shanti Swaroop Chauhan, Asst Professor,2. Mr. Shashank Tripathy, Research
Achieving self sufficiency in pulse production in India
 Achieving self sufficiency in pulse production in India Towards self sufficiency in pulse production On average, over the last three years Indian s consumed approximately 22 million tonnes of pulses per
Impact of national food security mission-pulses on legumes production performance in Punjab, India
 Legume Research, 38 (5) 2015: 609-615 Print ISSN:0250-5371 / Online ISSN:0976-0571 AGRICULTURAL RESEARCH COMMUNICATION CENTRE www.arccjournals.com/www.legumeresearch.in Impact of national food security
Trends of Non-Foodgrains Cultivation in India: A State Level Analysis
 Trends of Non-Foodgrains Cultivation in India: A State Level Analysis Samir Show Research Scholar, Department of Economics, Vidyasagar University. Received: June 01, 2018 Accepted: July 26, 2018 ABSTRACT
Guidelines for Implementation of fisheries Scheme under the National Mission for Protein Supplements (NMPS) in States during
 in States during") Annexure-III Guidelines for Implementation of fisheries Scheme under the National Mission for Protein Supplements (NMPS) in States during 2012-13 The Department of Animal Husbandry, Dairying & Fisheries,
Annexure-III Guidelines for Implementation of fisheries Scheme under the National Mission for Protein Supplements (NMPS) in States during 2012-13 The Department of Animal Husbandry, Dairying & Fisheries,
CONTEMPORARY RESEARCH IN INDIA (ISSN ): VOL. 7: ISSUE: 1 (2017) Received: 23/02/2017 Edited: 28/02/2017 Accepted: 04/03/2017
: VOL. 7: ISSUE: 1 (2017) Received: 23/02/2017 Edited: 28/02/2017 Accepted: 04/03/2017") ECONOMICS OF PRODUCTION AND MARKETING OF MAIZE IN WESTERN MAHARASHTRA ShindeV. A. 1, S. V.Satpute 2 and A. B. Bhosale 3 1 and 3 Associate Professors of Agricultural Economics, 2 Junior Research Assistant,
ECONOMICS OF PRODUCTION AND MARKETING OF MAIZE IN WESTERN MAHARASHTRA ShindeV. A. 1, S. V.Satpute 2 and A. B. Bhosale 3 1 and 3 Associate Professors of Agricultural Economics, 2 Junior Research Assistant,
Dismantling Fertilizer Subsidies in India: Some Issues and Concerns for Farm Sector Growth
 INDIAN INSTITUTE OF MANAGEMENT AHMEDABAD INDIA Dismantling Fertilizer Subsidies in India: Some Issues and Concerns for Farm Sector Growth Vijay Paul Sharma September 2012 The main objective of the working
DEVELOPMENT PROGRAMMES ON PULSES: GOVERNMENT EFFORTS
 DEVELOPMENT PROGRAMMES ON PULSES: GOVERNMENT EFFORTS India is a major Pulses growing country in the world. Pulses account for about one-fifth of the total acreage under food grains and about one-fifteenth
Page 1 of 6. Agriculture. I. Answer the Following
 Agriculture Page 1 of 6 I. Answer the Following Q1. What is the importance of agriculture in the Indian economy? Ans. Two-thirds of India s population is engaged in agricultural activities. Agriculture
SECTION-3: AGRICULTURE AND ALLIED ACTIVITIES
 Agriculture and Allied Activities 121 SECTION-3: AGRICULTURE AND ALLIED ACTIVITIES The agriculture situation in India has been presented with the help of a number of Tables highlighting India s share in
Cellulosic Ethanol Emerging Opportunities in India Feb 2015
 Cellulosic Ethanol Emerging Opportunities in India Feb 2015 Safe Harbor Statement This presentation and its related comments contain forwardlooking statements, including financial expectations. Forward-looking
Potential Gains from Regional Cooperation and Trade of Electricity in South Asia
 Potential Gains from Regional Cooperation and Trade of Electricity in South Asia Govinda R. Timilsina and Mike Toman The World Bank, Washington, DC 5 th Asian Conference of IAEE University of Western Australia
India. India Grain Voluntary Update - October 2017
 THIS REPORT CONTAINS ASSESSMENTS OF COMMODITY AND TRADE ISSUES MADE BY USDA STAFF AND NOT NECESSARILY STATEMENTS OF OFFICIAL U.S. GOVERNMENT POLICY Voluntary - Public Date: 10/3/2017 GAIN Report Number:
Agrarian Stagnation in Eastern Gangetic Plains. Avinash Kishore IFPRI, New Delhi
 Agrarian Stagnation in Eastern Gangetic Plains Avinash Kishore IFPRI, New Delhi Agriculture is stagnant across India 17500 AgGDP of India (2011-12 billion rupees) 17000 16500 CAGR = 2.32% 16000 15500 15000
IMPORTANCE OF AGRICULTURE FOR GROWTH OF INDIAN ECONOMY
 IMPORTANCE OF AGRICULTURE FOR GROWTH OF INDIAN ECONOMY Dr. Fulwinder Pal Singh Associate Professor of Economics, Cum Principal SBJS Khalsa College,Satlani Sahib,Amritsar ABSTRACT Agriculture is the backbone
From Rooftops to Farmtops. Augmenting India s Distributed Solar Goals through net-metered solar pumps
 From Rooftops to Farmtops Augmenting India s Distributed Solar Goals through net-metered solar pumps Introduction The Government of India has recently announced a scheme for solar water pumps known as
Growth in area, production and productivity of major crops in Karnataka*
 Karnataka J. Agric. Sci.,25 (4) : (431-436) 2012 Introduction Growth in area, production and productivity of major crops in Karnataka* SARASWATI POUDEL ACHARYA, H. BASAVARAJA, L. B. KUNNAL, S. B. MAHAJANASHETTI
Rice Weekly Research Report 30 th April, 2018
 Rice Weekly Research Report Contents Outlook and Review Weekly Price Change Weekly Rice Export Progressive Procurement FOB-1121 Steam International Rice Market Summary IGC Balance Sheet CBOT Trend Outlook
Indian Fertilizer Market
 Indian Fertilizer Indian Fertilizer The Indian fertilizer industry has played a pivotal support role in the Indian agricultural industry. The growth in the use of chemical fertilizers amongst the farmers
Confederation of Indian Industry. Opportunities in ORGANIC. Food in India. Ministry of Food Processing Industries. Government of India
 Confederation of Indian Industry Opportunities in ORGANIC Food in India Ministry of Food Processing Industries Government of India Advantage India One of the fastest growing economies in the world Largest
INTERNATIONAL FOOD POLICY RESEARCH INSTITUTE. Page 1
 Page 1 Food and Energy Security for Development in India Ashok Gulati & Kavery Ganguly Presentation at Third IBSA Summit Academic Forum IBSA Partnership for Shared Prosperity and Inclusive Globalization
Proceedings of the Annual Conference of NEEA held at Dibrugarh, Assam in February POVERTY AND ENVIRONMENTAL DEGRADATION IN RURAL INDIA: A NEXUS
 POVERTY AND ENVIRONMENTAL DEGRADATION IN RURAL INDIA: A NEUS Purusottam Nayak Abstract Inspired by the worldwide debate on the issue, the present paper is a humble attempt to test the nexus between poverty
Resource Use Efficiency of Major Field Crops in Reasi District of Jammu Region of Jammu and Kashmir State
 Agro Economist - An International Journal Citation: AE: 4(1): 15-19, June 2017 DOI: 10.5958/2394-8159.2017.00004.4 2017 Renu Publishers. All rights reserved Resource Use Efficiency of Major Field Crops
International Journal of Commerce and Business Management. Volume 5 Issue 2 October,
 IJCBM Volume 5 Issue 2 October, 2012 159-163 International Journal of Commerce and Business Management RESEA RCH PAPER Growth trends in area, production and export of onion from India -An economic analysis
FERTILIZERS SUBSIDIES IN INDIA A CASE STUDY OF EAST ZONE
 FERTILIZERS SUBSIDIES IN INDIA A CASE STUDY OF EAST ZONE Dr. Rajwinder Kaur Assistant Professor, Mata Sahib Kaur Girls College, Talwandi Sabo (Punjab), India ABSTRACT There is a need to generate the surplus
Operational Land Holdings in India: Trend and Inequality Analysis ( )
") Learning Community: 6(1): April 2015: 87-100 2015 New Delhi Publishers. All rights reserved DOI Number: 10.5958/2231-458X.2015.00008.1 5 (New 9) (P) Operational Land Holdings in India: Trend and Inequality
Learning Community: 6(1): April 2015: 87-100 2015 New Delhi Publishers. All rights reserved DOI Number: 10.5958/2231-458X.2015.00008.1 5 (New 9) (P) Operational Land Holdings in India: Trend and Inequality
DROUGHT (INDIA) SURINDER KAUR INDIA METEOROLOGICAL DEPARTMENT
 SURINDER KAUR INDIA METEOROLOGICAL DEPARTMENT") DROUGHT (INDIA) SURINDER KAUR INDIA METEOROLOGICAL DEPARTMENT WATER AVAILIBILITY IN INDIA AREA OF THE COUNTRY 32,87,263 SQ. KMs RAINFALL 4000 KM³ SURFACE WATER POTENTIAL 684 KM³ GROUND WATER POTENTIAL
DROUGHT (INDIA) SURINDER KAUR INDIA METEOROLOGICAL DEPARTMENT WATER AVAILIBILITY IN INDIA AREA OF THE COUNTRY 32,87,263 SQ. KMs RAINFALL 4000 KM³ SURFACE WATER POTENTIAL 684 KM³ GROUND WATER POTENTIAL
Dynamics of Labour Demand and its Determinants in Punjab Agriculture
 Agricultural Economics Research Review Vol. 26 (No.2) July-December 2013 pp 267-273 Dynamics of Labour Demand and its Determinants in Punjab Agriculture Y. Latika Devi, Jasdev Singh*, Kamal Vatta and Sanjay
A Balance Sheet of Performance of Large dams in India The case of irrigation and flood control
 1 A Balance Sheet of Performance of Large dams in India The case of irrigation and flood control Over the last 51 years of water resources development in Independent India, the nation has spent over Rs.
Content. Monsoon Report and Sowing Update. Highlights. Southwest Monsoon: A flashback of Southwest Monsoon A slow beginning
 Content Highlights Southwest Monsoon: A flashback of 2011 Southwest Monsoon 2012- A slow beginning Hike in MSP of Kharif crops Sowing Progress of Kharif crops - Cereals - Pulses - Oilseeds - Cotton - Sugarcane
THE IMPACT OF PRIVATIZATION AND DEREGULATION ON NEW TECHNOLOGY DIFFUSION AND AGRICULTURAL GROWTH PERFORMANCE IN BANGLADESH - A MACRO VIEW
 Bangladesh J. Agric. Econs. XXII, 1(1999): 51-62 THE IMPACT OF PRIVATIZATION AND DEREGULATION ON NEW TECHNOLOGY DIFFUSION AND AGRICULTURAL GROWTH PERFORMANCE IN BANGLADESH - A MACRO VIEW M. Akteruzzaman
Page 1 of 26 (www.unapcaem.org)
") Farm Mechanization in Punjab: Social, Economic and Environmental Implications Gurharminder Singh Sr. Scientific Officer, Punjab State Council for Science & Technology, INDIA Page 1 of 26 () Page 2 of 26
Farm Mechanization in Punjab: Social, Economic and Environmental Implications Gurharminder Singh Sr. Scientific Officer, Punjab State Council for Science & Technology, INDIA Page 1 of 26 () Page 2 of 26
Comparative economics of Banana cultivation in Anand district of Gujarat
 Comparative economics of Banana cultivation in Anand district of Gujarat A.K. Dave 1, Y.C. Zala 2 and R.S. Pundir 3 * 1 Department of Agricultural Economics, B.A. College of Agriculture, Anand Agricultural
State wise analysis of RPO Regulation for Captive users
 State Regulation for Captive Users Definition of renewable Energy as per the commission order Remarks Andhra Pradesh Every consumer owning a captive generating plant of installed capacity of one (1) MW
OCCUPATIONAL STRUCTURE OF RURAL FEMALES IN INDIA AFTER GLOBALIZATION. Simta Rani. Abstract
 OCCUPATIONAL STRUCTURE OF RURAL FEMALES IN INDIA AFTER GLOBALIZATION Simta Rani Research Scholar, Babasaheb Bhimrao Ambedkar University, A central University, Lucknow. Department of Economics, School for
Manpower in Mining Some Reflections
 Manpower in Mining Some Reflections Employment has been the biggest challenge for a country as diverse and as vast as India. The rural hinterland is a hub of diverse resources including variety of minerals.
GOVERNMENT OF INDIA MINISTRY OF RURAL DEVELOPMENT DEPARTMENT OF LAND RESOURCES LOK SABHA STARRED QUESTION NO. 70 TO BE ANSWERED ON
 GOVERNMENT OF INDIA MINISTRY OF RURAL DEVELOPMENT DEPARTMENT OF LAND RESOURCES LOK SABHA STARRED QUESTION NO. 70 TO BE ANSWERED ON 20.07.2017 Development of Wasteland *70. SHRI KUNWAR PUSHPENDRA SINGH
IMPO P RT R AN A C N E C E O F G RO R UN U D N W
 Introduction IMPORTANCE OF GROUNDWATER Global Groundwater Situation ACWADAM s database Sources for presentation CGWB, various publications FAO-database Various United Nations publications. UN World Water
Agricultural Credit and Indebtedness in India: Some Issues
 Ind. Jn. of Agri. Econ. Vol. 61, No. 1, Jan.-March 2006 Agricultural Credit and Indebtedness in India: Some Issues R.S. Sidhu and Sucha Singh Gill* In almost all the models of growth and development, capital
First Source. Use First Source to. Expand markets. Search for new poten al customers. Explore/Discover new markets
 Use First Source to Expand markets Search for new poten al customers. Explore/Discover new markets Search for companies from new industries/loca ons. Mi gate business risks Research business associate,
VECTOR BORNE DISEASES AND CLIMATIC CHANGES
 VECTOR BORNE DISEASES AND CLIMATIC CHANGES Dr. Neeraj Dhingra Additional Director National Vector Borne Disease Control Porgramme (NVBDCP Ministry of Health & Family Welfare Government of India PREVENTION
MEMBERS' REFERENCE SERVICE LARRDIS LOK SABHA SECRETARIAT, NEW DELHI REFERENCE NOTE. No.56/RN/Ref./Nov/2017
 MEMBERS' REFERENCE SERVICE LARRDIS LOK SABHA SECRETARIAT, NEW DELHI REFERENCE NOTE No.56/RN/Ref./Nov/2017 For the use of Members of Parliament NOT FOR PUBLICATION 1 DAIRY SECTOR: PRESENT SCENARIO AND NEW
Contemporary Research in India (ISSN ): Vol. 7: Issue: 3 September, 2017
: Vol. 7: Issue: 3 September, 2017") IMPACT OF IMPROVED TECHNOLOGY ADOPTION FOR WHEAT IN MAHARASHTRA Dr. Y. C. Sale 1, Prof. N. K. Kale 2 and Prof. P. N. Shendage 3 College of Agriculture, Pune (Maharashtra) Mahatma Phule Krishi Vidyapeeth,
IMPACT OF IMPROVED TECHNOLOGY ADOPTION FOR WHEAT IN MAHARASHTRA Dr. Y. C. Sale 1, Prof. N. K. Kale 2 and Prof. P. N. Shendage 3 College of Agriculture, Pune (Maharashtra) Mahatma Phule Krishi Vidyapeeth,
R. V. JOSHI, B. J. PATEL AND K. M. PATEL*
 Forage Res., 41 (2) : pp. 104-108 (2015) http://forageresearch.in EFFECT OF NITROGEN LEVELS AND TIME OF APPLICATION ON GROWTH, YIELD, QUALITY, NITROGEN, PHOSPHORUS CONTENT AND UPTAKE FOR SEED PRODUCTION
Volume -1, Issue-4 (October-December), 2013 Available online at popularkheti.info. Organic Farming: Current Status in India
, 2013 Available online at popularkheti.info. Organic Farming: Current Status in India") Popular Kheti Volume -1, Issue-4 (October-December), 2013 Available online at www.popularkheti.info 2013 popularkheti.info Organic Farming: Current Status in India Issue Special on Organic Farming ISSN:2321-0001
Popular Kheti Volume -1, Issue-4 (October-December), 2013 Available online at www.popularkheti.info 2013 popularkheti.info Organic Farming: Current Status in India Issue Special on Organic Farming ISSN:2321-0001
AGRICULTURAL DIVERSIFICATION IN INDIA
 Hrideshwer Gupta* AGRICULTURAL DIVERSIFICATION IN INDIA Abstract: Agriculture has always been the backbone of the Indian Economy and despite concerted industrialization in the last six decades; agriculture
KNOWLEDGE OF IMPROVED RICE PRODUCTION TECHNOLOGY BY THE FARMERS IN DUNGARPUR DISTRICT OF RAJASTHAN
 Raj. J. Extn. Edu. 20 : 97-101, 2012 KNOWLEDGE OF IMPROVED RICE PRODUCTION TECHNOLOGY BY THE FARMERS IN DUNGARPUR DISTRICT OF RAJASTHAN Ram Lal Khatik*, B. Bhimawat** and B. Upadhyay*** ABSTRACT India
INDIAN RICE LANDSCAPE: Trade, Production & Government Intervention in Marketing Shweta Saini and Ashok Gulati
 INDIAN RICE LANDSCAPE: Trade, Production & Government Intervention in Marketing Shweta Saini and Ashok Gulati paper presented at Kyushu University, Fukuoka, Japan Focus of the Presentation Evolution of
EFFECT OF INTEGRATED NUTRIENT MANAGEMENT ON GROWTH CHARACTERISTIC OF KHARIF MAIZE
 EFFECT OF INTEGRATED NUTRIENT MANAGEMENT ON GROWTH CHARACTERISTIC OF KHARIF MAIZE Madane K. T., M. S. Narale and D. M.Sawant Asst. Prof. Department of Agronomy, Shriram College of Agriculture, Paniv Received:
Government of India Ministry of Agriculture & Famers Welfare (Deptt. of Agri., Coopn. & Farmers Welfare) Directorate of Pulses Development Bhopal
 Directorate of Pulses Development Bhopal") Government of India Ministry of Agriculture & Famers Welfare (Deptt. of Agri., Coopn. & Farmers Welfare) Directorate of Pulses Development Bhopal ***** SUB: ALL INDIA PULSES: CURRENT KHARIF PRODUCTION
Government of India Ministry of Agriculture & Famers Welfare (Deptt. of Agri., Coopn. & Farmers Welfare) Directorate of Pulses Development Bhopal ***** SUB: ALL INDIA PULSES: CURRENT KHARIF PRODUCTION
CHAPTER I 1.1 Introduction
 CHAPTER I 1.1 Introduction Pulses in India have long been considered as the poor man s source of protein. Pulses are grown in 22-23 million hectares of area with an annual production of 13-15 million tones
SMALL HYDRO PROGRAMME IN INDIA
 SMALL HYDRO PROGRAMME IN INDIA Bhuwanesh Kumar Bhatt Ministry of New and Renewable Energy Hydropower represents use of water resources towards inflation free energy due to absence of fuel cost with mature
ECONOMIC IMPORTANCE OF PLANTATION SECTOR IN KERALA
 Economic importance of plantation sector in Kerala Contents Chapter 2 ECONOMIC IMPORTANCE OF PLANTATION SECTOR IN KERALA 2.1 Contribution of Agriculture to Kerala State GDP 2.2 Income Share of Main Agriculture
International Journal of Advance ISSN and Applied Research (IJAAR) Impact Factor 0.899
 Impact Factor 0.899") International Journal of Advance ISSN 2347-7075 and Applied Research (IJAAR) Impact Factor 0.899 Peer Reviewed Bi-Monthly Vol.2 No.1 Sept- Oct 2014 INSTALLATION OF OFF-GRID RENEWABLE ENERGY SYSTEMS IN
International Journal of Advance ISSN 2347-7075 and Applied Research (IJAAR) Impact Factor 0.899 Peer Reviewed Bi-Monthly Vol.2 No.1 Sept- Oct 2014 INSTALLATION OF OFF-GRID RENEWABLE ENERGY SYSTEMS IN
Drivers of Agricultural Diversification in India, Haryana, and the Greenbelt Farms of India
 From the SelectedWorks of amarnath tripathi Fall December, 2009 Drivers of Agricultural Diversification in India, Haryana, and the Greenbelt Farms of India amarnath tripathi Brajesh Jha Available at: https://works.bepress.com/amarnath_tripathi/6/
Output and Employment Growth in Registered Manufacturing Industries in India: Testing Kaldor s Hypothesis
 Output and Employment Growth in Registered Manufacturing Industries in India: Testing Kaldor s Hypothesis Dr. Panchanan Das Taki Government College West Bengal This paper carries out GMM estimation in