Low prices last year induced a decline in global wheat area, and as a result production increased less than 1%, helping to support an expected price i
|
|
|
- Candice Garrett
- 5 years ago
- Views:
Transcription
1 Wheat
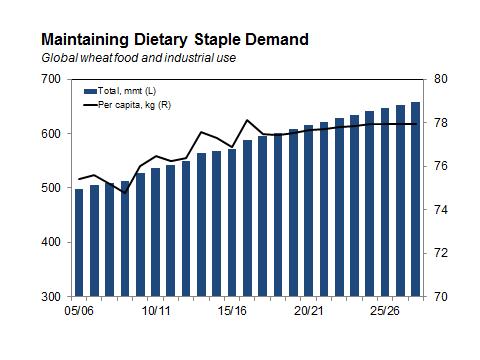
2 Low prices last year induced a decline in global wheat area, and as a result production increased less than 1%, helping to support an expected price increase in 2017/18. It is expected that prices will recover from oversupply and the normal price relationship between wheat and other grains will be re-established in the short to medium term. With the assumption of normal weather and average yields in coming years, production is expected to maintain levels that will balance global supply and demand at more normal, stable prices. These somewhat higher prices than in the recent past will ensure that wheat successfully competes for land against other crops. Despite current moderate prices, the underlying costs of production have risen. Fertilizers and other agricultural chemicals, and other inputs are pricier than just a few years ago, but those prices are not expected to appreciate rapidly. Energy prices are only projected to increase moderately in the next few years. This will help producers meet global wheat demand without large increases in prices. Low prices in 2016/17 resulted in an estimated 1.8 million hectare reduction in wheat area worldwide. The largest reductions were in the U.S., EU, and Kazakhstan more than offsetting gains in Australia and Morocco. Going forward, area is expected to bounce up in 2018/19 in response to this year s price recovery, and then gradually increase over the next ten years. Despite lower area globally, wheat production edged up seven mmt due to an increase in yields. However, this rise in output is insufficient to pressure prices further downward. Inventories are expected to absorb an increasing amount of supply this year, and the increase in food use will more than offset a decline in feed use By the end of the baseline period, wheat area is projected to be around 225 million hectares and production will increase primarily through the expected 1% annual yield growth. Total wheat consumption will increase primarily from population growth, whereas per capita wheat food consumption will be stable throughout the projection period. Nevertheless, income impacts on wheat vary across regions and income levels. Per capita consumption is declining in high-income countries where diets are less based on grains and more on meats and other foods. In many emerging countries, per capita consumption is already high and income growth will contribute little to demand. Health and weight issues also contribute to declining per capita consumption in developed countries. While grains, especially whole grains are important dietary components, the caloric intake of many populations in higher-income countries is well beyond daily nutritional requirements and a growing number of societies are faced with obesity issues. For developing countries, wheat per capita consumption is increasing as incomes above subsistence levels allow the population to diversify diets beyond traditional staples. Globalization also plays a role in changing diets in some nations as foods from other countries become available.

3
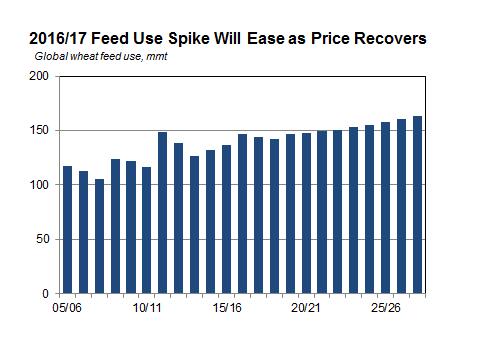
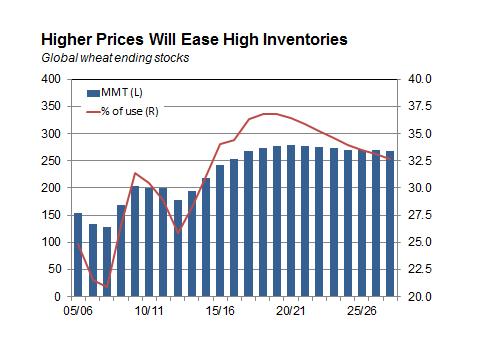
4 Wheat feed use is expected to decline modestly this year and next as higher prices result in switching back to feed grains. Decreased feed use will occur in Australia, Canada, China, and the U.S, but will be maintained or expand in traditional wheat feeding regions such as the former Soviet Union and Europe. Cattle inventory declines have slowed in Russia and Ukraine, and hog and poultry production have turned the corner in these countries, as well as Kazakhstan. During the baseline period, livestock production is expected to increase again in major wheat feeding regions, and accompanying wheat feed use is expected to increase. Wheat feed use tends to increase or decrease in a given year depending on local wheat and competing feedgrains production and prices. When producers enjoy large wheat crops, wheat feeding generally increases in those countries, especially if some of that wheat is of lower quality. Wheat trade is expected to be similar to last year s levels in 2017/18, although the share of specific importers and exporters will shift. Particularly, production changes in exporting countries will result in substantial shifts in trade patterns this year. Argentina, Australia, EU, Ukraine, and the U.S. are seeing lower exportable supplies. Exports are expected to increase relative to last year in Canada and Russia. Similarly some major importers are expected to show changes in 2017/18. Egypt and Indonesia are expected to increase purchases on the international market this year. Egypt will remain the single largest export market throughout the baseline. Algeria, Morocco, Nigeria, and Brazil also rank consistently among the top importers. Rising global excess demand over the projection period will be met primarily by traditional major exporting nations. Trade will cover 19% to 20% of worldwide consumption. Most major import destinations are expected to increase dependency on the world market in coming years. Globally, inventories are expected to increase by the end of 2017/18 by approximately 16 mmt. The extensive buildup from the sharp drawdown of 2012/13 is expected to last another few years, but at a much slower pace, then inventories are projected to stabilize. This year s increase in ending stocks is expected to occur primarily in China and Russia. A sizable reduction is expected for the U.S. China s grain policies result in holding a large proportion of annual needs in reserve to buffer production shortfalls and high prices. In the past five years, China has been building wheat stocks, resulting in a substantial rise in the stocks-to-use ratio, with a full year s consumption requirements expected to be on hand at the end of 2017/18, compared to about 22% for the rest of the world. Because China s grain markets are still relatively insulated from world markets, the inventories held by that country are not available to buffer production shortfalls in other parts of the world. As a result, that country s higher proportion of stocks does not reduce world market volatility.
5
6 World Wheat Supply & Utilization 06/07 07/08 08/09 09/10 10/11 11/12 12/13 13/14 14/15 15/16 16/17 (Million hectares) Area Harvested (Metric tons per hectare) Yield (Million metric tons) Supply , , , , ,139.4 Production Beginning stocks Net imports Utilization Feed and residual Food, seed & industrial Ending stocks Net exports Total Demand , , , , ,139.4
7 World Wheat Supply & Utilization 17/18 18/19 19/20 20/21 21/22 22/23 23/24 24/25 25/26 26/27 27/28 (Million hectares) Area Harvested (Metric tons per hectare) Yield (Million metric tons) Supply 1, , , , , , , , , , ,254.1 Production Beginning stocks Net imports Utilization 1, , , , , , , , , , ,091.0 Feed and residual Food, seed & industrial Ending stocks Net exports Total Demand 1, , , , , , , , , , ,254.1
8 Wheat Area Harvested 06/07 07/08 08/09 09/10 10/11 11/12 12/13 13/14 14/15 15/16 16/17 (Million hectares) Algeria Argentina Australia Brazil Canada China Egypt EU India Iran Japan Kazakhstan Mexico Morocco Nigeria Pakistan Russia South Korea Turkey Ukraine United States Uzbekistan Vietnam Rest of world World total
9 Wheat Area Harvested 17/18 18/19 19/20 20/21 21/22 22/23 23/24 24/25 25/26 26/27 27/28 (Million hectares) Algeria Argentina Australia Brazil Canada China Egypt EU India Iran Japan Kazakhstan Mexico Morocco Nigeria Pakistan Russia South Korea Turkey Ukraine United States Uzbekistan Vietnam Rest of world World total
10 Wheat Trade 06/07 07/08 08/09 09/10 10/11 11/12 12/13 13/14 14/15 15/16 16/17 (Thousand metric tons) Net exporters Argentina 10,715 11,185 6,768 5,096 9,481 12,921 3,548 2,248 5,266 9,588 13,795 Australia 8,634 7,371 14,632 14,706 18,478 24,533 18,504 18,458 16,432 15,965 22,500 Canada 19,114 15,736 18,491 18,611 16,162 16,892 18,499 22,849 23,621 21,593 19,672 EU-28 8,767 5,627 17,722 16,935 18,465 9,366 17,510 28,056 29,476 27,770 22,033 India -6,627-1, ,808 6,028 3, ,380 Kazakhstan 8,125 7,879 6,028 8,207 4,855 11,838 6,271 8,060 4,939 7,533 7,320 Pakistan , ,288 1, Russia 9,862 11,780 18,190 18,392 3,894 21,077 10,136 17,747 22,470 24,724 27,306 Ukraine 3, ,964 9,309 4,261 5,352 7,145 9,687 11,242 17,404 18,066 United States 21,408 31,298 24,179 20,704 32,509 25,527 24,161 27,318 19,407 18,100 25,501 Total net exports 83,917 90, , , , , , , , , ,410 Net importers Algeria 4,860 5,883 6,307 5,155 6,516 6,496 6,455 7,462 7,242 8,139 8,404 Brazil 8,010 6,003 6,008 5,996 4,158 5,302 5,773 6,986 3,683 5,686 6,649 China -2,395-2, ,955 1,991 5,884 1,123 2,747 3,662 Egypt 7,288 7,657 9,806 10,325 10,375 11,418 8,223 9,955 11,006 11,371 10,745 Indonesia 5,409 5,006 5,275 5,152 6,392 6,235 6,910 7,090 7,195 9,775 9,872 Iran ,750 4, ,491 4,685 5,115 3,300 1,000 Japan 5,330 5,362 4,884 5,206 5,577 6,058 6,323 5,854 5,616 5,457 5,634 South Korea 3,352 3,000 3,277 4,365 4,636 5,057 5,295 4,144 3,789 4,243 4,430 Mexico 3,059 1,881 1,936 2,357 2,583 4,230 3,094 3,317 3,367 3,237 4,251 Morocco 1,669 4,077 3,642 2,218 3,847 3,543 3,572 3,713 3,848 4,311 5,157 Nigeria 3,265 2,633 3,020 3,440 3,482 3,421 3,918 4,080 3,844 4,010 4,572 Turkey ,230-1, ,888-1,149-1,641 Uzbekistan ,240 1,277 1,118 2,048 1,513 1,924 2,030 2,462 2,500 Vietnam 1, ,820 2,342 2,552 1,506 1,980 2,066 2,819 5,307 Rest of world 44,050 46,621 57,464 57,632 56,842 62,561 59,428 66,956 69,629 74,769 76,704 Total net imports 86,292 87, , , , , , , , , ,246 Residual -2,375 2,894 6,418 3, ,427-7,263 7,198 4,730 2,740 4,164 (Dollars per metric ton) US SRW Gulf Port Price
11 Wheat Trade 17/18 18/19 19/20 20/21 21/22 22/23 23/24 24/25 25/26 26/27 27/28 (Thousand metric tons) Net exporters Argentina 11,783 11,510 12,672 13,015 13,318 13,678 14,033 14,344 14,617 14,885 15,166 Australia 15,615 17,378 18,406 18,802 18,809 18,850 18,908 18,984 19,055 19,113 19,165 Canada 21,521 19,515 19,894 20,067 20,315 20,566 20,840 21,063 21,268 21,426 21,580 EU-28 21,142 22,472 24,120 25,123 26,177 26,966 27,421 27,575 27,656 27,581 27,539 India -1,925-2,185-2,050-1,926-1,969-2,064-2,161-2,220-2,329-2,419-2,504 Kazakhstan 7,423 7,319 7,565 7,892 8,224 8,550 8,856 9,147 9,424 9,694 9,944 Pakistan Russia 34,405 27,855 24,581 25,561 26,542 27,573 28,604 29,811 30,829 31,809 32,704 Ukraine 16,918 17,183 17,290 17,631 18,018 18,304 18,496 18,652 18,798 18,877 18,916 United States 22,456 20,949 20,599 20,360 20,273 20,335 20,347 20,562 20,441 20,443 20,442 Total net exports 149, , , , , , , , , , ,101 Net importers Algeria 7,664 7,754 7,885 8,002 8,076 8,181 8,272 8,363 8,407 8,443 8,471 Brazil 7,291 7,721 7,739 7,744 7,720 7,687 7,651 7,619 7,595 7,577 7,558 China 3,200 3,066 3,036 2,910 3,067 3,261 3,428 3,511 3,566 3,584 3,581 Egypt 11,470 11,045 11,343 11,975 12,481 12,893 13,272 13,619 13,994 14,361 14,733 Indonesia 11,010 10,040 10,154 10,273 10,388 10,502 10,611 10,714 10,817 10,917 11,013 Iran -47 1, ,033 1,094 1,105 1,098 1,068 Japan 5,532 5,440 5,440 5,440 5,440 5,440 5,440 5,440 5,440 5,440 5,440 South Korea 4,374 4,384 4,305 4,256 4,237 4,230 4,237 4,234 4,250 4,264 4,320 Mexico 4,033 4,098 4,137 4,172 4,211 4,246 4,291 4,325 4,375 4,431 4,494 Morocco 4,680 4,924 5,100 5,269 5,426 5,554 5,673 5,792 5,906 6,015 6,120 Nigeria 4,760 4,827 4,944 5,071 5,215 5,367 5,521 5,677 5,837 6,000 6,165 Turkey -2,049-1, ,091-1,279-1,470-1,702-1,856-1,968-2,002 Uzbekistan 2,609 2,385 2,521 2,686 2,813 2,873 2,950 3,011 3,080 3,143 3,191 Vietnam 3,646 2,602 2,681 2,799 2,879 2,961 3,045 3,130 3,218 3,309 3,405 Rest of world 81,085 73,487 73,844 75,994 77,943 79,796 81,176 82,792 83,648 84,350 84,886 Total net imports 149, , , , , , , , , , ,441 Residual (Dollars per metric ton) US SRW Gulf Port Price
Improvement in global production and a gradual recovery in ending stocks over the past three years have allowed the global wheat market to balance at
 Wheat Improvement in global production and a gradual recovery in ending stocks over the past three years have allowed the global wheat market to balance at much lower prices than in the 2007/08 to 2012/13
Total Net Exports 105, , , , , , , , , , ,153
 Wheat Trade Net Exporters Argentina 7,495 6,454 7,206 6,988 7,144 7,205 7,343 7,492 7,737 7,766 7,711 Australia 18,900 20,066 20,021 20,047 20,254 20,486 20,827 21,027 21,262 21,494 21,619 Canada 17,600
Global Agricultural Supply and Demand: Factors contributing to recent increases in food commodity prices
 Global Agricultural Supply and Demand: Factors contributing to recent increases in food commodity prices Ron Trostle Economic Research Service U.S. Department of Agriculture Agricultural Markets and Food
Factors Affecting Global Agricultural Markets. Fred Giles Director, Agricultural Trade Office USDA / SP
 Factors Affecting Global Agricultural Markets Fred Giles Director, Agricultural Trade Office USDA / SP Factors Impacting Global Agricultural Markets Commodity Prices Energy Prices Value of the U.S. Dollar
INTERNATIONAL GRAINS COUNCIL
 INTERNATIONAL GRAINS COUNCIL GRAIN MARKET REPORT www.igc.int GMR No. 420 2 April 2012 WORLD ESTIMATES million tons 08/09 09/10 10/11 11/12 12/13 est forecast proj 23.02 02.04 02.04 WHEAT Production 685
Total Net Exports 97, , , , , , , , , , ,001
 Wheat Trade Net Exporters Argentina 2,495 7,623 8,013 8,368 8,651 8,813 8,828 8,866 9,026 9,218 9,539 Australia 14,925 16,281 16,750 16,816 17,382 17,549 17,671 17,743 17,952 18,157 18,384 Canada 18,100
Rice price relationships are becoming distorted again this year. The relatively thin rice market compared to other agricultural commodities and concen
 Rice Rice price relationships are becoming distorted again this year. The relatively thin rice market compared to other agricultural commodities and concentration of trade in Asia are factors that are
Emerging Global Trade Patterns: USDA s Long-term Agricultural Projections
 Emerging Global Trade Patterns: USDA s Long-term Agricultural Projections Midwest Agriculture s Ties to the Global Economy Federal Reserve Bank of Chicago November 28, 217 Chicago Jim Hansen, Ph.D. USDA,
World Wheat Market Supply Demand Trends
 World Wheat Market Supply Demand Trends Daniel O Brien Extension Agricultural Economist K State Research and Extension April 28, 21 The World wheat market is segmented into groups of countries with diverse
Wednesday July 11, 2012 World Ag Supply & Demand Report
 World Ag Supply & Demand Report U.S. 2011/12 Old Crop Corn is neutral Global Old Crop Corn is neutral USDA estimates the 2011/12 U.S. corn carryout at 903 million bushels, up from 851 million bushels from
Wheat Year in Review (International): Low 2007/08 Stocks and Higher Prices Drive Outlook
: Low 2007/08 Stocks and Higher Prices Drive Outlook") United States Department of Agriculture WHS-2008-01 May 2008 A Report from the Economic Research Service Wheat Year in Review (International): Low 2007/08 Stocks and Higher Prices Drive Outlook www.ers.usda.gov
United States Department of Agriculture WHS-2008-01 May 2008 A Report from the Economic Research Service Wheat Year in Review (International): Low 2007/08 Stocks and Higher Prices Drive Outlook www.ers.usda.gov
CORN: DECLINING WORLD GRAIN STOCKS OFFERS POTENTIAL FOR HIGHER PRICES
 CORN: DECLINING WORLD GRAIN STOCKS OFFERS POTENTIAL FOR HIGHER PRICES OCTOBER 2000 Darrel Good Summary The 2000 U.S. corn crop is now estimated at 10.192 billion bushels, 755 million (8 percent) larger
Global Sugar Consumption Expands While Production Stagnates
 United States Department of Agriculture Foreign Agricultural Service Sugar: World Markets and Trade Global Sugar Consumption Expands While Production Stagnates 180 Million Metric Tons, Raw Value 170 160
MARKET OUTLOOK REPORT Volume 2 Number 1
 MARKET OUTLOOK REPORT Volume 2 Number 1 WHEAT: SITUATION AND OUTLOOK April 1, 2010 Prepared by: Market Analysis Group Grains and Oilseeds Division Food Value Chain Bureau Market and Industry Services Branch
Major Points of Discussion
 Situation and Outlook for Agricultural Commodity Prices Presented to Global Insight s World Economic Outlook Conference April 16, 2008 Michael J. Dwyer Chief Economist and Director of Global Trade and
Global market trends and grain flows
 Global market trends and grain flows GTA Advisory & Compliance Workshop Melbourne 28/7/14 A global perspective Prices driven offshore price discovery starts offshore Understanding broad trends critical
May 12, Dear Subscriber: We will be adding material to this shell letter after todays reports are released at 11:00 a.m.
 May 12, 2015 Dear Subscriber: We will be adding material to this shell letter after todays reports are released at 11:00 a.m. Be sure to click back on the link often for the latest information. Whle today
Sugar: World Markets and Trade
 United States Department of Agriculture Foreign Agricultural Service Sugar: World Markets and Trade May 218 Elevated in 218/19 Keeps Stocks High, Pressuring Prices Ending Stocks 2 18 16 14 12 1 8 6 4 Other
MARKET OUTLOOK REPORT Volume 1 Number 1
 MARKET OUTLOOK REPORT Volume 1 Number 1 WHEAT: SITUATION AND OUTLOOK April 17, 2009 Prepared by: Market Analysis Group Grains and Oilseeds Division Food Value Chain Bureau Market and Industry Services
Feed Grains Outlook: Shifting Trade Patterns and Implications for the US Acreage Mix. May 23, 2018
 Feed Grains Outlook: Shifting Trade Patterns and Implications for the US Acreage Mix May 23, 2018 The Growth of Chinese Imports May Reshape World Trade in Corn Brazil s Safrinha Crop Could Play a Key Role
Market situation. Projection highlights CEREALS
 3. COMMODITY SNAPSHOTS Market situation CEREALS Global supplies of major cereals continued to exceed overall demand, leading to a significant build-up of inventories and much lower prices on international
Monitoring production of main producing countries
 Monitoring production of main producing countries Bruno Buffaria HoU Arable Crops European Commission Directorate General for Agriculture and Rural Development AGRISAT workshop, 13/10/2010 13-14 Oct 2010
World Agricultural Supply And Demand Estimates
 World Agricultural Supply And Demand Estimates United States Department of Agriculture Office of the Chief Economist Agricultural Marketing Service Economic Research Service Farm Service Agency Foreign
2010 Outlook of the U.S. and World Wheat Industries, Richard D. Taylor and Won W. Koo
 Agribusiness & Applied Economics 662 April 2010 2010 Outlook of the U.S. and World Wheat Industries, 2009-2019 Richard D. Taylor and Won W. Koo Center for Agricultural Policy and Trade Studies Department
June 12, USDA World Supply and Demand Estimates
 June 12, 2018 - USDA World Supply and Demand Estimates Corn Market Reaction: July 2018 corn futures closed up 10 ¼ cents at $3.77 ½ with a trading range for the day of $3.67 ¼ to $3.79 ½. December 2018
World Orange Juice Consumption Forecast: Balancing Supply and Demand
 World Orange Juice Consumption Forecast: Balancing Supply and Demand Robert Norberg Dep. Exec. Dir. of Research & Operations FLORIDA DEPARTMENT OF CITRUS Bartow, FL fdocgrower.com The International Citrus
Raisins: World Markets and Trade
 United States Department of Agriculture Foreign Agricultural Service Raisins: World Markets and Trade Global Raisin Production Up Marginally Global raisin production for 2014/15 is forecast at a record
CORN: BETTER DEMAND, PRODUCTION CONCERNS
 CORN: BETTER DEMAND, PRODUCTION CONCERNS April 2000 Darrel Good Summary The USDA s March Grain Stocks report, released on March 31, confirmed a high rate of domestic corn use during the second quarter
Implications for commodity prices and farm income
 Implications for commodity prices and farm income Mike Dwyer Director, Global Policy Analysis Office of Global Analysis Foreign Agricultural Service US Department of Agriculture Mike.Dwyer@fas.usda.gov
August 10, USDA World Supply and Demand Estimates
 August 10, 2017 - USDA World Supply and Demand Estimates Corn Market Reaction: September 2017 corn futures closed down 15 cents at $3.57 ¼ with a trading range for the day of $3.56 ½ to $3.75 ½. December
Grain: World Markets and Trade
 MMT 1, 975 95 925 9 875 85 825 8 Department of Agriculture Foreign Agricultural Service Grain: World Markets and Trade Near-Record Grain Supplies Support Growing Global Consumption Global Corn Production
May 10, USDA World Supply and Demand Estimates
 May 10, 2018 - USDA World Supply and Demand Estimates Corn Market Reaction: July 2018 corn futures closed down ¾ cent at $4.02 with a trading range for the day of $4.00 to $4.07. December 2018 corn futures
World Corn Market Supply Demand Trends
 World Corn Market Supply Demand Trends Daniel O Brien Extension Agricultural Economist K State Research and Extension May 27, 21 The world corn market has many participants, but a small number of larger
Rice Outlook and Baseline Projections. University of Arkansas Webinar Series February 13, 2015 Nathan Childs, Economic Research Service, USDA
 Rice Outlook and Baseline Projections University of Arkansas Webinar Series February 13, 2015 Nathan Childs, Economic Research Service, USDA THE GLOBAL RICE MARKET PART 1 The 2014/15 Global Rice Market:
Agriculture Commodity Markets & Trends
 Agriculture Commodity Markets & Trends Agenda Short History of Agriculture Commodities US & World Supply and Demand Commodity Prices Continuous Charts What is Contango and Backwardation Barge, Truck and
U.S. Rice Market Faces Larger Supplies and Lower Prices in 2018/19; Global Trade Projected Another Record High
 U.S. Rice Market Faces Larger Supplies and Lower Prices in 218/19; Global Trade Projected Another Record High 218 Rice Outlook Conference December 5-7, 218 Nathan Childs Economic Research Service USDA
UPDATED HOG PRODUCTION ESTIMATED RETURNS
 February 15, 21 Ames, Iowa Econ. Info. 187 UPDATED HOG PRODUCTION ESTIMATED RETURNS The Iowa State University Extension Estimated Livestock Returns have provided a barometer of profitability for the Iowa
INTERNATIONAL CENTER FOR AGRICULTURAL COMPETITIVENESS Policy Modeling Group
 INTERNATIONAL CENTER FOR AGRICULTURAL COMPETITIVENESS Policy Modeling Group Darren Hudson, Director Jaime Malaga, Associate Director Bing Liu, Research Scientist GLOBAL COTTON OUTLOOK 216/17 226/27 International
Sugar: World Markets and Trade
 United States Department of Agriculture Foreign Agricultural Service November 2018 Sugar: World Markets and Trade Record Stocks and Consumption Despite Lower Production 205 185 Production Consumption Stocks
World Grains and Oilseeds: Recent Trends and Perspectives. Agribusiness in Argentina A seminar on Investment Opportunities London 14 December 2011
 www. IGC 2011 World Grains and Oilseeds: Recent Trends and Perspectives Agribusiness in Argentina A seminar on Investment Opportunities London 14 December 2011 Darren Cooper Senior Economist International
World Agricultural Supply And Demand Estimates
 United States Department of Agriculture Office of the Chief Economist World Agricultural Supply And Demand Estimates Agricultural Marketing Service Economic Research Service Farm Service Agency Foreign
World Agricultural Supply and Demand Estimates
 World Agricultural Supply and Demand Estimates Report of Interagency Commodity Estimates Committee Forecasts World Agricultural Outlook Board, Chairing Agency Economic Research Service Foreign Agricultural
Friday Aug 10, 2012 World Ag Supply & Demand Report
 Friday Aug 10, 2012 World Ag Supply & Demand Report U.S. 2011/12 Old Crop Corn is Supportive Global Old Crop Corn is Slightly Bearish USDA estimates the 2011/12 U.S. corn carryout at 1,021 million bushels,
WORLD AGRICULTURAL SUPPLY AND DEMAND ESTIMATES
 WORLD AGRICULTURAL SUPPLY AND DEMAND ESTIMATES United States Department of Agriculture Washington, D.C. Approved by the World Agricultural Outlook Board WASDE-339 - June 12, 1998 NOTE Because planting
SOYBEANS: LOW PRICES TO PERSIST
 SOYBEANS: LOW PRICES TO PERSIST JANUARY 2002 Darrel Good 2002 - NO. 2 Summary Soybean prices received some support from the USDA s January 11 final U.S. production estimate for the 2001 crop. At 2.891
World Agricultural Supply And Demand Estimates
 United States Department of Agriculture Office of the Chief Economist World Agricultural Supply And Demand Estimates Agricultural Marketing Service Economic Research Service Farm Service Agency Foreign
Market situation Cereals. AGRI C 5 Advisory Group on Cereals, Oilseeds and Proteins 30 March 2012
 Market situation Cereals AGRI C 5 Advisory Group on Cereals, Oilseeds and Proteins 30 March 2012 World cereal balance : IGC 1000 900 World Ending Stocks of which 8 major exporters World Production World
CORN: CROP PROSPECTS TO DOMINATE PRICES
 CORN: CROP PROSPECTS TO DOMINATE PRICES JULY 2002 Darrel Good 2002 NO. 5 Summary The USDA s June Grain Stocks report confirmed a rapid rate of domestic corn consumption during the third quarter of the
April 9, Dear Subscriber:
 April 9, 2014 Dear Subscriber: We will be adding material to this shell letter after the report is released on April 9, 2014 at 11:00 a.m CST. Be sure to click back on the link often for the latest information.
World Agricultural Supply And Demand Estimates
 World Agricultural Supply And Demand Estimates United States Department of Agriculture Office of the Chief Economist Agricultural Marketing Service Economic Research Service Farm Service Agency Foreign
World Agricultural Outlook Board Interagency Commodity Estimates Committee Forecasts. Lockup Briefing June 11, 2014
 World Agricultural Outlook Board Interagency Commodity Estimates Committee Forecasts Lockup Briefing World Wheat Production Country or Region 2014/15 Million Tons World 714.0 701.6 0.7-1.7 United States
World Agricultural Supply And Demand Estimates
 United States Department of Agriculture Office of the Chief Economist World Agricultural Supply And Demand Estimates Agricultural Marketing Service Economic Research Service Farm Service Agency Foreign
World Agricultural Outlook Board Interagency Commodity Estimates Committee Forecasts. Lockup Briefing April 9, 2014
 World Agricultural Outlook Board Interagency Commodity Estimates Committee Forecasts Lockup Briefing World Wheat Production Country or Region Million Tons World 656.5 712.5 8.5 United States 61.7 58.0-6.0
CORN: FIVE CONSECUTIVE LARGE CROPS?
 CORN: FIVE CONSECUTIVE LARGE CROPS? JULY 2000 Darrel Good Summary The USDA s June Acreage Report revealed that U.S. producers had planted nearly 79.6 million acres of corn in 2000, up from 77.4 million
September 12, USDA World Supply and Demand Estimates
 September 12, 2018 - USDA World Supply and Demand Estimates Corn Market Reaction: December 2018 corn futures closed down 14 ¼ cents at $3.52 ½ with a trading range for the day of $3.50 ¾ to $3.66 ¼. December
Steelmaking raw materials: Market and Policy Developments
 Steelmaking raw materials: Market and Policy Developments DSTI/SU/SC(2010)16 69 th Steel Committee Meeting Paris 3-4 December 2010 Summary Recovery in world output of steel has raised the demand for raw
Iowa Farm Outlook. December 15, 2004 Ames, Iowa Econ. Info. 1900
 Iowa Farm Outlook December 15, 24 Ames, Iowa Econ. Info. 19 Beef and Pork Price Relationships Historically, beef and pork prices have moved somewhat together. They are substitutes in the consumer s shopping
Fresh Deciduous Fruit: World Markets and Trade (Apples, Grapes, & Pears)
") United States Department of Agriculture Foreign Agricultural Service December 2017 Fresh Deciduous Fruit: World Markets and Trade (Apples, Grapes, & Pears) FRESH APPLES World production for 2017/18 is
United States Department of Agriculture Foreign Agricultural Service December 2017 Fresh Deciduous Fruit: World Markets and Trade (Apples, Grapes, & Pears) FRESH APPLES World production for 2017/18 is
Meat Market Review April Meat Market Review
 April 2018 World meat market overview 2017 Meat Market Review World meat output, comprising bovine, pig, poultry and ovine meat, is estimated at 330 million tonnes in 2017, an increase of 1 percent from
WORLD AGRICULTURAL OUTLOOK
 WORLD AGRICULTURAL OUTLOOK FEBRUARY 21 FAPRI Food and Agricultural Policy Research Institute CENTER FOR AGRICULTURAL AND RURAL DEVELOPMENT IOWA STATE UNIVERSITY AMES, IOWA 511-17 TELEPHONE: 515.294.7519
2016 Risk and Profit Conference General Session Speakers. GENERAL SESSION IV Grain Market Situation and Outlook
 2016 Risk and Profit Conference General Session Speakers GENERAL SESSION IV Grain Market Situation and Outlook Dan O Brien, Kansas State University Daniel O Brien was raised on a grain and livestock farm
CORN: SMALLER SUPPLIES ON THE HORIZON. April 2001 Darrel Good No. 3
 CORN: SMALLER SUPPLIES ON THE HORIZON April 2001 Darrel Good 2001- No. 3 Summary The USDA s March Grain Stocks and Prospective Plantings report released on March 30 provided some fundamentally supportive
Dynamic Considerations
 6 Dynamic Considerations The analysis in this study uses current production (or population) for country weights in obtaining global estimates for the impact of climate change on agriculture. This approach
KC FED Agriculture Infrastructure Investor Perspective. Chris Erickson Managing Director HighQuest Partners, LLC July 2013
 KC FED Agriculture Infrastructure Investor Perspective Chris Erickson Managing Director HighQuest Partners, LLC July 2013 Global Supply and Demand 1 Global Soybean Supply and Demand 1,000 MT 350,000 300,000
Food Markets Wheat & Maize Outlook 2018/19
 Food Markets Wheat & Maize Outlook THIRTEENTH SESSION OF THE AMIS GLOBAL FOOD MARKET INFORMATION GROUP FAO Headquarters, Rome 3-4 May 2018 Presentation Outline I. Macro conditions & food markets II. Market
Grain: World Markets and Trade
 MMT MMT MMT May 218 Department of Agriculture Foreign Agricultural Service Grain: World Markets and Trade Record Global Grain Consumption Drives Stocks Down 1, 1, 1, 9 9 8 8 76 74 72 7 68 66 64 62 6 49
PART I. COUNTRY-BASED DATA AND INDICATORS
 PART I. COUNTRY-BASED DATA AND INDICATORS Ch. 2 GHG Emissions and Trends 11 Ch. 3 Emissions Projections 17 Ch. 4 Per Capita Emissions 21 Ch. 5 Emissions Intensity 25 Ch. 6 Cumulative Emissions 31 Ch. 7
January 12, USDA World Supply and Demand Estimates
 January 12, 2017 - USDA World Supply and Demand Estimates Corn This month s U.S. corn outlook is for lower production, reduced feed and residual use, increased corn used to produce ethanol, and smaller
USDA lowered the 2010/11 wheat carry out by 5 million and decreased 2010/11 Yield by.3 bushels/acre.
 Tuesday November 9 th 2010 World Ag Supply & Demand Estimates Slightly Bullish for Corn More Bullish for Soybeans Friendly U.S. Wheat USDA lowered the 2010/11 corn carry out by 75 million and decreased
THE FUTURE OF GLOBAL MEAT DEMAND IMPLICATIONS FOR THE GRAIN MARKET
 1 THE FUTURE OF GLOBAL MEAT DEMAND IMPLICATIONS FOR THE GRAIN MARKET Mitsui Global Strategic Studies Industrial Studies Dept. II Yukiko Nozaki In the 2000s, the growing demand for meat pushed up the demand
World Agricultural Supply And Demand Estimates
 United States Department of Agriculture Office of the Chief Economist World Agricultural Supply And Demand Estimates Agricultural Marketing Service Economic Research Service Farm Service Agency Foreign
USDA WASDE Report. Friday April 9 th 2010 World AG Supply & Demand Estimates. Office Friday April 09, 2010
 Friday April 9 th 2010 World AG Supply & Demand Estimates The trade was expecting the new carry out to incorporate additional stocks resulting from the March 31 grain stocks report which was not reflected
Why Another Food. Commodity Price Spike?
 18 Why Another Food Commodity Price Spike? Ronald Trostle, rtrostle@ers.usda.gov Shutterstock Large and rapid increases have occurred for many food commodity prices during 21-11. Long-term production and
Fresh Peaches and Cherries: World Markets and Trade
 United States Department of Agriculture Foreign Agricultural Service Fresh Peaches and Cherries: World Markets and Trade Fresh Peach/Nectarine: 2014/15 Highlights Global production in 2014/15 of peaches/nectarines
June 9, USDA World Supply and Demand Estimates
 June 9, 2017 - USDA World Supply and Demand Estimates Corn Market Reaction: July 2017 corn futures closed up 2 cents at $3.87 ¾ with a trading range for the day of $3.80 ¾ to $3.89 ½. December 2017 corn
DAIRY AND DAIRY PRODUCTS
 3. COMMODITY SNAPSHOTS Market situation DAIRY AND DAIRY PRODUCTS International dairy prices started to increase in the last half of 2016, with butter and whole milk powder (WMP) accounting for most of
World Agricultural Supply And Demand Estimates
 World Agricultural Supply And Demand Estimates United States Department of Agriculture Office of the Chief Economist Agricultural Marketing Service Economic Research Service Farm Service Agency Foreign
January 12, USDA World Supply and Demand Estimates
 January 12, 2018 - USDA World Supply and Demand Estimates Corn Market Reaction: March 2018 corn futures closed down 2 ½ cents at $3.46 ¼ with a trading range for the day of $3.45 ½ to $3.50. December 2018
8 TH ANNUAL ALLTECH GLOBAL FEED SURVEY
 8 TH ANNUAL ALLTECH GLOBAL FEED SURVEY Now in its eighth year, the annual Alltech Global Feed Survey has become the premier insight into the feed industry. The survey is cited in more than 80 articles
The fortunes of U.S. farmers and
 U.S. Food Sector Linked to Global Consumers Anita Regmi and Greg Pompelli The fortunes of U.S. farmers and food processors are increasingly influenced by events in markets around the world. The importance
Beef and Sheep Network
 Beef and Sheep Network Claus Deblitz A new dimension for the analysis of the beef sector Working Paper 1/2011 Part 1 1 A global network for the exchange of information, knowledge and expertise generating
Grain: World Markets and Trade
 e 218 Department of Agriculture Foreign Agricultural Service Grain: World Markets and Trade 3 28 26 24 Southeast Asia and Sub-Saharan Africa Now Top Wheat Importers MMT 22 2 18 16 14 12 1 Southeast Asia
March 10, Dear Subscriber:
 March 10, 2014 Dear Subscriber: We will be adding material to this shell letter after the report is released on March 10 at 11:00 a.m CST. Be sure to click back on the link often for the latest information.
3. CEREALS 109. Chapter 3. Cereals
 3. CEREALS 19 Chapter 3. Cereals This chapter describes the market situation and highlights the latest set of quantitative medium-term projections for world and national cereals markets for the ten-year
ERS/USDA Briefing Room - Corn: Market Outlook
 1 of 19 7/21/2006 8:12 PM Briefing Rooms Corn: Market Outlook USDA Feed Grains Baseline, 2005-14 The gross domestic product is expected to grow in the United States and around the world, raising incomes
THE WORLD COTTON MARKET SITUATION
 THE WORLD COTTON MARKET SITUATION Prepared by Carlos Valderrama and presented by M. Rafiq Chaudhry International Cotton Advisory Committee Washington, DC Southern/Eastern African Cotton Forum Pretoria,
Potential implications of MERCOSUR obtaining Foot and Mouth Disease free status. Pierre Charlebois Carole Gendron Paul Lirette
 Potential implications of MERCOSUR obtaining Foot and Mouth Disease free status Pierre Charlebois Carole Gendron Paul Lirette 1 Purpose The goal of this presentation is to quantify the potential international
U.S. Agricultural Trade: Trends, Composition, Direction, and Policy
 U.S. Agricultural Trade: Trends, Composition, Direction, and Policy Charles E. Hanrahan Senior Specialist in Agricultural Policy Carol Canada Information Research Specialist Beverly A. Banks Acquisitions
International Energy Outlook 2011
 International Energy Outlook 211 Center for Strategic and International Studies, Acting Administrator September 19, 211 Washington, DC U.S. Energy Information Administration Independent Statistics & Analysis
USDA lowered the 2010/11 wheat carry out by 49 million and decreased 2010/11 Yield by.2 bushels/acre.
 Friday October 8 th 2010 World Ag Supply & Demand Estimates Very Bullish for Corn Bullish for Soybeans Friendly U.S. Wheat USDA lowered the 2010/11 corn carry out by 214 million and decreased 2010/11 Yield
The OECD-FAO Agricultural Outlook Global Trends in Commodity Markets by Pavel Vavra
 The OECD-FAO Agricultural Outlook Global Trends in Commodity Markets by Pavel Vavra Power Point Presentation for the International Agricultural Trade Research Consortium Analytic Symposium Confronting
U.S. Rice Market Faces Tighter Supplies and Higher Prices in 2017/18
 U.S. Rice Market Faces Tighter Supplies and Higher Prices in 217/18 University of Arkansas Webinar Series October 26, 217 Nathan Childs Economic Research Service USDA Approved by the World Agricultural
OECD FAO Agricultural Outlook
 OECD FAO Agricultural Outlook 2018 ca 7. DAIRY AND DAIRY PRODUCTS Chapter 7. Dairy and dairy products This chapter describes the market situation and highlights the latest set of quantitative medium-term
USDA Agricultural Baseline Projections to 2012
 United States Department of Agriculture Office of the Chief Economist Staff Report WAOB-23-1 USDA Agricultural Baseline Projections to 212 Interagency Agricultural Projections Committee World Agricultural
United Nations Conference on Trade and Development
 United Nations Conference on Trade and Development 1th MULTI-YEAR EXPERT MEETING ON COMMODITIES AND DEVELOPMENT 25-26 April 218, Geneva Assessing the recent past and prospects for grains and oilseeds markets
Summary of WASDE and Production USDA
 Summary of WASDE and Production USDA The following information are summary and extracts from the latest, AUG 2016, WASDE and World Agricultural Production reports provided by the United States Department
PROSPECTS FOR WORLD AGRICULTURAL MARKETS
 PROSPECTS FOR WORLD AGRICULTURAL MARKETS 113 114 1. Introduction This chapter is aimed at giving an overall picture of the long-term prospects of world markets for some key agricultural products. While
Oral Statement before the United States Senate Committee on Agriculture, Nutrition, and Forestry. Hearing on the trade section of the farm bill
 Oral Statement before the United States Senate Committee on Agriculture, Nutrition, and Forestry Hearing on the trade section of the farm bill April 25, 2001 Bruce A. Babcock Center for Agricultural and
U.S. Hide and Skin Industry 2017 Year End Data; 2018 Projections
 For Immediate Release For More Information Please Contact: Stephen Sothmann ssothmann@meatinstitute.org U.S. Hide and Skin Industry 2017 Year End Data; 2018 Projections The U.S. hides and skins market