LAND CAPABILITY FOR AGRICULTURE PRELIMINARY REPORT
|
|
|
- Gwen Spencer
- 5 years ago
- Views:
Transcription


1 LAND CAPABILITY FOR AGRICULTURE PRELIMINARY REPORT The Canada Land Inventory Report No Reprinted 1977, 1978
2
3 LAND CAPABILITY FOR AGRICULTURE CANADA LAND INVENTORY A PRELIMINARY REPORT Environment Canada Lands Directorate April, Reprinted 1977, 1978
4 Minister of Supply and Services Canada 1978 Cat. No. En63-10/1978 ISBN
5 PREFACE Although Canada has the second largest land area of any nation, only ten percent of that area is, in practical terms, suitable for agriculture. From this ten percent, the nation obtains a great variety of produce, including large quantities of food for the world market. Owing to the dependence of Canada on the produce of the land, it is essential to understand the limits of the land resource, the location of prime lands, and the forces that may affect the capability of the land resource to continue to serve Canada's needs. After a decade of data collection and analysis, the Canada Land Inventory (CLI) is nearing completion. This publication details the preliminary results for the agriculture sector, as processed by the Canada Geographic Information System (CGIS) from CLI data. This will be followed by the publication of results for recreation, forestry, wildlife (both waterfowl and ungulates) and present land use. It is hoped that through a better understanding of the limits and capabilities of the land resource, sound and wise management will be realized. C J. McCormack, Director General, Lands Directorate.
6
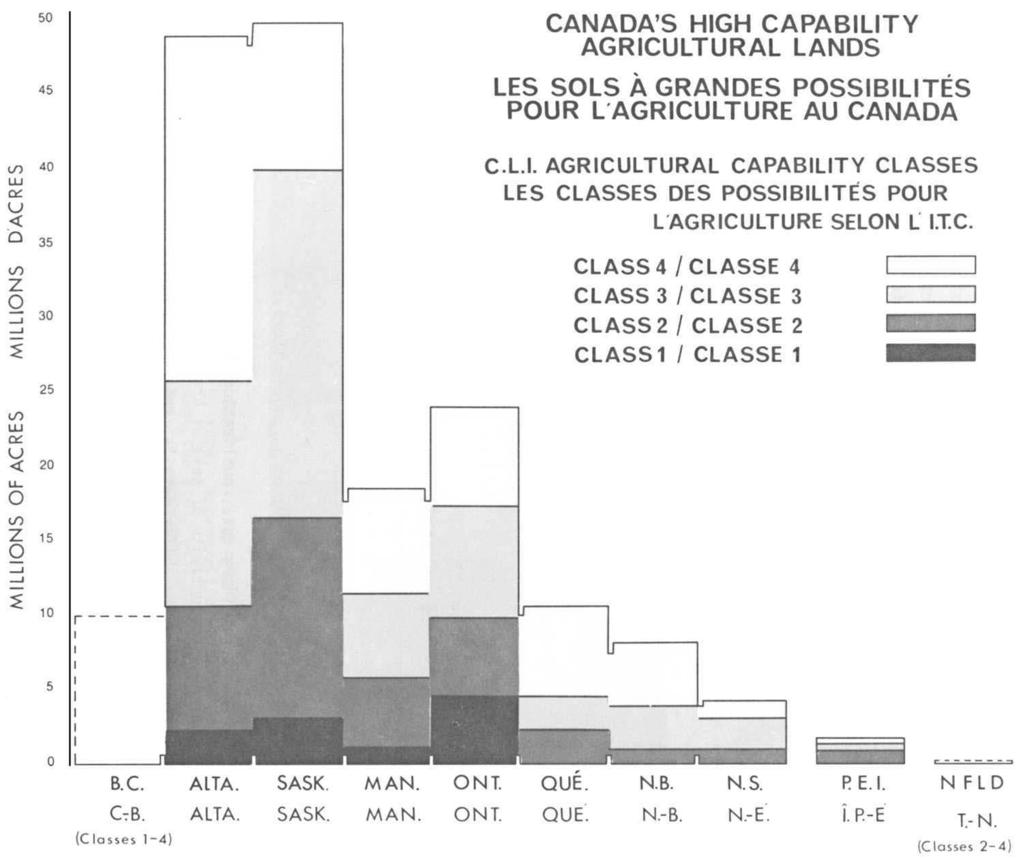
7 LAND CAPABILITY FOR AGRICULTURE (A CLI-CGIS report on soil capability) Approximately 10.3 percent of Canada's land can support economically viable agricultural production. 1 Only five percent of Canada's soils are free from severe physical limitations and can support crop production. 2 Just one half of one percent of Canada's land falls into the category of Class 1 soils. 3 These and other facts about the physical capability of Canada's land resource are now available from an analysis of Canada Land Inventory (CLI) data. The CLI began in 1963 as a cooperative federal-provincial program; its purpose is to assess and document the physical capability and use of land within the settled areas of Canada. The complete inventory area covers approximately 1 million square miles and encompasses all of the regions of Canada that have significant agricultural capability; these include the Island of Newfoundland, the Maritime Provinces, and the settled parts of Québec, Ontario and the Western Provinces. (Refer to Map 1). Areas outside the present CLI boundaries, by reason of climate or topography, do not contain significant areas of land capable of sustained agricultural practice. (Refer to Table 1). The CLI program consists of mapping and assessing the lands of Canada for agricultural capability, forestry capability, recreation capability, wildlife (waterfowl and ungulates) capability and present land use. Each province classifies its land according to the national classification systems; these have been prepared jointly by the provincial and federal government departments responsible for resource development. The agricultural capability data were derived primarily from the extensive work in soil surveys done over the last fifty years by the federal and provincial soil survey staffs. To facilitate the use of data for land planning and resource studies, a computerized data bank and analytical system were developed as part of the CLI program. This system, known as the Canada Geographic Information System (CGIS), permits all CLI data to be transformed to numeric data for analysis Includes agricultural capability Classes 1 to 5. Includes agricultural capability Classes 1 to 3. These prime soils have no significant limitations and have high productivity for a wide range of crops. 1
8 Map 1. CLI area / région ITC 2
9 After twelve years of field studies and mapping programs, which have involved the cooperative participation of more than 100 provincial and federal agencies, several universities, non-governmental organizations and private companies, the CLI is nearing completion. As the map data are analyzed through the CGIS, a national picture of actual and potential land use emerges. The first results provided data concerning land capability for agricultural use. These data are available for all provinces except Newfoundland and British Columbia; for the latter, data compilation and input to the CGIS system are still in progress. Tables 2 to 5 present a summary of agricultural land capability information. 1 Knowledge of the CLI land classification system is required to fully understand the tables. THE AGRICULTURAL LAND CLASSIFICATION SYSTEM 2 In the CLI classification system of land capability for agriculture, mineral soils are grouped into seven classes according to their potential and limitations for agricultural use. The most highly rated soils, those having no significant limitations for cropping, are designated Class 1. Soils with no agricultural potential are designated Class 7. Soils designated Classes 2 to 6 indicate, in declining order, capability for agriculture. A separate category has been established for organic soils, category O. Summary descriptions of each agricultural capability class follow. Class 1 Soils of this class have no significant limitations for crop use. They are generally level, or have very gentle slopes, deep, well-to-imperfectly drained and have good water-holding capacity. Class 2 Soils of this class have moderate limitations that restrict the range of crops or require moderate conservation practices. Class 2 soils are deep and have good water-holding capacity. Limitations are moderate and crops can be grown on these soils with little difficulty. The limitations of the soils in this class may be for example, adverse regional climate, moderate erosion, poor soil structure or low fertility which is readily correctable. 1 2 Internal CGIS Report, Version 001-X, October, Abstracted from CLI Report No. 2: "Soil Capability Classification for Agriculture" (1972),

10 FIGURE 1: Classes 2, 3, and 5 are present in this illustration. Class 2 has moderate slopes, indicated by subclass T, that require some soil conservation measures for sustained use for arable crops. Class 5 has steep slopes which make this area unsuitable for arable field crops but it is capable of improvement for production of perennial forage crops. Class 3 has a continuing limitation of wetness that restricts its use for field crops. 4

11 FIGURE 2: Classes 2, 3, 4, 5, and 7 are illustrated. The Class 2 area has a moderate limitation because of occasional damaging overflow; the Class 3 areas are affected by topographic and fertility limitations; the Class 4 and 5 areas are downgraded from Class 3 because of steepness of slope. The Class 7 area is considered to be non-agricultural because of steepness of slopes and generally rough topography. 5
12 Class 3 Soils of this class have moderately severe limitations that restrict the range of crops or require special conservation practices. Although these soils have more severe limitations than those in Class 2, they are still fair to moderately high in productivity for a fairly wide range of field crops adapted to the region. Limitations may be a combination of those described under Class 2, or are of the following; moderate climatic limitations, moderately severe erosion, intractable soil mass or very slow permeability, correctable low fertility, moderate to steep slopes, frequent runoff accompanied by crop damage, stoniness necessitating some clearing, etc. Classes 1 to 3 are considered to be capable of sustained annual production of common cultivated crops. Map 2 indicates the location of all soils in Canada classified as agricultural capability Class 3 or better. Class 4 Soils of this class have severe limitations that either restrict the range of crops or require special conservation practices or both. Soils in Class 4 have such limitations that they are suitable for only a few crops, or the yield for a range of crops is low, or crop failure is high. These soils are low to medium in productivity for a narrow range of crops but may have higher productivity for a specially adapted crop. Limitations may include steep slopes, severe past erosion, frequent surface runoff - with severe effects on crops, severe salinity, extreme stoniness, or severe aridity. Class 5 Soils of this class have very severe limitations that restrict their capability to produce perennial forage crops. Class 5 soils have such serious physical, climatic or other limitations that they are not capable of use for sustained production of annual field crops. Class 5 soils are amenable, however, to improvement and, with intensive management practices, may be used for permanent pasture. The limitations described in Classes 2 to 4 may be present for Class 5 areas. Cultivated field crops may be grown in Class 5 areas where adverse climate is the main limitation but crop failures will occur under average conditions. Soils of Classes 4 and 5 are considered suitable for most varieties of forage crops. 6
13 7
14 Class 6 Soils of this class are capable only of producing perennial forage crops, and improvement practices are not feasible. Class 6 soils have some natural, sustained grazing capacity for farm animals, but they have such serious climatic or other physical limitations that the application of improvement practices is impractical. Although Class 6 soils are marginal for any agricultural use, they can often support periodic rough grazing. Class 7 Soils of this class have no capability for arable culture or permanent pasture. Combinations of severe climatic and physical limitations preclude economic use of the land for agriculture. All classified areas, except organic soils, and soils not designated as Classes 1 to 6, are placed in this class. Class 7 therefore includes areas of exposed rock and bodies of water too small to delineate on maps. Subclasses A series of subclasses designate the specific nature of limitations inherent in each soil class. (Refer to Appendix 1 for details of subclassifications and an example of the information available for subclassifications). SOME SIGNIFICANT FACTS RESULTING FROM CLI DATA ANALYSIS Tables 1 to 5 reveal a number of significant facts about the extent and location of land that is capable of supporting Canadian agricultural production. 1. Eighty-eight percent of Canada's land area has no agricultural capability whatsoever. 2. Ten and one-half percent of Canada's land area (250 million acres) has some agricultural capability. This figure represents Class 1 to 5 soils. 3. One and one-half percent of Canada's land area is marginal for agricultural production (Class 6 soils). 4. By adding the marginal land to the total area of arable land, a figure of about 12% of Canada's total land area results. According to Agriculture Canada figures and the results of CLI land-use mapping, approximately 60% of this arable land is currently in agricultural use. The unused area includes Class 5 and 6 soils. 8

15 FIGURE 3: The main limitation in the Class 2 and Class 3 land shown here is topography. The Class 2 land requires some special conservation measures to prevent damage from water erosion while the Class 3 area, owing to its greater slopes, requires more intense conservation measures to control water erosion. The Class 5 area, while severely eroded, may be used for perennial forage crops. 9

16 FIGURE 4: The soil areas marked as Class 6 are so rough and eroded as to be capable of being used only as wild pasture. Regeneration of trees on the cleared areas will be very slow so that the areas will provide wild pasture for many years. The area classified as 7, if cleared, would also provide wild pasture. However, areas that require land clearing must have a higher capability than Class 6 to be rated other than Class 7. 10
17 4. Cropland (Class 1, 2 and 3 soils) constitutes slightly more than 5% of Canada's total land area or 115 million acres. This figure includes the CLI categories 1 to 3 and an additional estimate of 6 million acres of Class 1 to 3 soils for British Columbia. 5. Less than one-half of one percent (0.45%) (10,192,980 acres) of Canada's land area is Class 1 agricultural land according to the CLI. If the estimated area of Class 1 soils in British Columbia is added, the total rises to approximately one half of one percent. There is no Class 1 or 2 agricultural land in Newfoundland. 6. About one-half of Canada's Class 1 agricultural land (5.3 million acres) is located in Ontario - most of it In the urbanizing southern part of the province. 7. The three Prairie Provinces contain 67% (77 million acres) of Canada's potential cropland (Class 1 to 3 soils). If Ontario's Class 1 to 3 soils (18 million acres) are added, these four provinces account for 82% of Canada's potential cropland. 8. No Class 1 agricultural land is found in the Atlantic Provinces but, approximately 75% of Prince Edward Island (nearly 1 million acres) is good cropland (Classes 2 and 3) and over one-half of New Brunswick's land area falls into agricultural capability Classes 2, 3 and 4. Thirty percent of Nova Scotia falls into Classes 2 to Only 1.5% (5.4 million acres) of Québec is classified as Class 1, 2 or 3 soils. Over 95% of Québec's land area is incapable of supporting any agriculture. From preliminary data, publications of Agriculture Canada have detailed the agricultural productivity of several areas, based upon the CLI agricultural capability classification. (For details, refer to Appendix 3). These preliminary figures differ from the CGIS compilation because they were prepared by manual procedures rather than computerized inventory. In both cases, data were derived from generalized maps at the 1:250,000 scale. Because of generalization, data may exhibit inconsistencies when used for areas smaller than those for which they were designed. 11
18 12
19 Caution should be used in comparing land classes from province to province as each province was classified independently. The classifications, while standardized nationally, are essentially a comparable series of regional ratings; for example, Class 1 soils on the Prairies are not necessarily equivalent in terms of potential productivity to Class 1 soils in Ontario, especially when compared for particular crop use. In some cases, action by users to alter the drainage, slope, or physical quality of a soil may be adequate to change the rating of that soil. Data should be used with care. These characteristics of the CLI agricultural classification system should be considered before use is made of CGIS data output. Canada Land Inventory information on land capability for uses in the other land resource sectors (forestry, outdoor recreation and wildlife) is being compiled and processed through the CGIS. As processing is completed, the data will be released through Environment Canada's Information Service. For additional information on the CLI, the CGIS and land capability data for the various resource sectors contact: Information Officer Lands Directorate, Environmental Management Service, Environment Canada, Ottawa, Ontario. K1A 0H3 or Telephone (819)
20 TABLES 14
21 TABLE 1. CLI Agricultural Capability Coverage Of Canada, December By Province A. Total Land Area B. Available C. Percentage Province Coverage (2) (B/A) (sq.mi.) (1) (acres) (acres) (%) Newfoundland 143,045 91,548,800 N.A. (3) N.A. Prince Edward Island 2,174 1,391,233 1,391,233 (4) 100 Nova Scotia 20,449 13,087,208 13,087,208 (4) 100 New Brunswick 27,587 17,655,693 17,655,693 (4) 100 Québec 523, ,270,400 74,678,154 (4) 22.3 Ontario 344, ,218,880 68,029,915 (4) 30.1 Manitoba 211, ,536,000 47,634,999 (4) 35.2 Saskatchewan 220, ,916,480 85,140,506 (4) 60.4 Alberta 248, ,232, ,350,659 (4) 74.3 British Columbia 359, ,938,560 N.A. (5) N.A. Yukon 205, ,421, (6) -- N.W.T. 1,253, ,200, (6) - - CANADA 3,560,027 2,278,417, ,968,367 (3)(5) 18.7 (7) (1) (2) (3) (4) (5) (6) (7) Areas of provinces from Canada Year Book 1974, except for N.B., N.S., and P.E.I. where CLI data were used. Figures for all CLI agricultural coverage, Classes 1-7, 0, and unclassified land areas within CLI boundaries, from provincial data available to A total area of 425,968,367 acres was on the CGIS system by December Newfoundland figures: total CLI area to be covered:26,304,960 acres (28.8% of the provincial land area). Data are not yet available. Coverage of the CLI territory is complete within these provinces. British Columbia figures: total CLI area to be covered: about 160,000,000 acres (approximately 70% of the provincial land area). Data are not yet available. The Yukon and N.W.T. are not covered by the CLI. When complete, the CLI will have classified approximately 27% of Canada's total land area for agricultural capability. Small pockets of land with some agriculture potential may occur outside CLI boundaries but are too small to map and should not significantly affect national totals for high capability lands. 15
22 TABLE 2. CLI Classification Of Soil Capability For Agriculture. By Province and by CLI Class Class > Organic Unclassified Province Soils (O) Land in CLI Area (in acres) Newfoundland (1) Prince Edward Island 0 645, , , , ,378 16,489 0 Nova Scotia 0 410,821 2,427,617 1,048, ,080 35,387 8,674, ,189 0 New Brunswick 0 397,312 2,846,772 5,023,626 4,202,813 28,538 4,544, , ,817 Québec 48,266 2,247,767 3,165,413 6,388,113 4,100,406 26,368 51,310,434 3,774,044 3,617,343 Ontario 5,329,320 5,480,036 7,189,177 6,488,284 4,733,138 2,817,523 27,727,064 6,333,899 1,931,474 Manitoba 401,552 6,252,181 6,030,356 5,908,745 5,529,607 5,152,752 2,555,549 10,990,338 4,813,919 Saskatchewan 2,470,292 14,512,689 23,276,642 9,347,635 21,059,390 7,215,335 87,911 4,387,862 2,782,751 Alberta 1,943,550 9,485,953 15,097,711 22,943,417 27,430,124 9,720,922 10,357,377 14,807,901 6,563,704 British Columbia (1) N.W.T.& Yukon (2) CANADA (3) 10,192,980 39,432,550 60,383,388 57,271,137 67,446,435 24,996, ,325,837 40,925,208 19,994,008 (1) (2) (3) Data not yet available. Not covered by the CLI. Does not include B.C., Nfld., N.W.T. and Yukon. 16
23 TABLE 3. Percentage Distribution Of Soil Capability For Agriculture. Province Class > By Province and by CLI Class Organic Unclass'd (1) Outside CLI (2) (percentages) Total Provincial Land Area Newfoundland (est.) (3) Prince Edward Island Nova Scotia New Brunswick Québec Ontario Manitoba Saskatchewan Alberta British Columbia (est.) (4) <1 ( < ) ( < ) ( > ) 100 Yukon (5) N.W.T. (5) CANADA (6) ( ) 100 (1) (2) (3) (4) (5) (6) Includes urban areas, national parks, and military reserves not included in the CLI agricultural classification. All areas outside CLI boundaries (see map) - nearly all Classes 6, 7, and organic (Class 0). Source: estimated areas from CLI maps not yet published Source: British Columbia Land Commission, Keeping the Options Open, Burnaby, B.C., March Not included in CLI area. Adjusted for the estimates. 17
24 TABLE 4. Canada's Soil Capability For Agriculture: A Percentage Summary By CLI Class (1). Agricultural Classes Class Areas as a Percentage of Canada's Total Land Area Cumulative Total of Class Area as a Percentage of Canada's Land Area (2) (%) (%) Class Class Class Class Class Class 6 Class7 Class O Includes some land outside CLI area and is marginal for any agricultural activity except open range. Includes the bulk of land outside the CLI area and is not suitable for any agricultural activity. Includes large areas of land outside the CLI area. (1) (2) The CLI soil capability data for British Columbia and Newfoundland not available and not included in the table. Percentages shown represent addition of raw percentages in order of land class. For example, 2.18% of Canada's land area is Class 2 or better, 4.83% of Canada's land area is Class 3 or better. 18
25 TABLE 5. Distribution Of Canada's Agricultural Lands (1). By CLI Agricultural Capability Class and by Province Province Class (2) Class1 (Best Land) Classes 1to 3 Total (Good Land) Classes1to 5 Total (Arable Land) (acres) (%) (acres) (%) (acres) (%) Newfoundland (3) N.A. -- N.A. -- N.A. -- Prince Edward Island , ,306, Nova Scotia 0 0 2,838, ,089, New Brunswick 0 0 3,244, ,470, Québec 48, ,461, ,949, Ontario 5,329, ,998, ,219, Manitoba 401, ,684, ,122, Saskatchewan 2,470, ,259, ,666, Alberta 1,943, ,527, ,900, British Columbia (3) N.A. -- N.A. -- N.A. -- Yukon & N.W.T. (4) CANADA (5) 10,192, ,008, ,726, (1) (2) (3) (4) (5) Canada's lands capable of sustaining improved agriculture. Class 1 is the best land. Classes 1 to 3 can be classified as good crop land. Classes 1 to 5include all land capable of sustaining any improved agriculture. Area of classified land excludes B.C., Nfld., and regions of other provinces outside CLI boundaries. Addition of B.C. and Nfld. data (not yet available) will cause only minor changes in the percentages, as Class 1 to 3 constitute less than 0.01% of the area of Nfld.,and less than 5% of the area of B.C. Not included in CLI area. Rounding results in percentages not totalling 100%. 19
26 APPENDICES 20
27 APPENDIX 1 CLI SOIL CAPABILITY FOR AGRICULTURE SUBCLASSES The CLI has a detailed subclassification system for agricultural land which defines the limitations inherent in a land area. Each area is classified according to its capability, e.g. "5"; additional symbols indicate limiting factors, e.g. "5 FD". Thus 5 FD would be Class 5 because of fertility limitations (F) and soil structure (D). The subclass categories covered by the CLI are the following: C - adverse climate D - undesirable soil structure and/or low permeability E - erosion (and gully land) F - low fertility correctable by careful management and fertilizer use I - inundation by streams or lakes M - moisture limitation, usually due to soils' low water-holding capacity N - salinity P - stoniness R - consolidated bedrock near surface S - adverse soil. characteristics in general T - topography W - excess water X - cumulative minor adverse characteristics EXAMPLE: PRINCE EDWARD ISLAND Class Subclass (principal first) (in acres) S 0 645, ,629 40,257 3, ,292 SW ,641 54, , ,415 I ,736 W , ,828 T ,227 25,519 19, ,107 TS , ST Total 0 645, , , , ,378 Thus,25,519 acres of land in P.E.I. have been classified as Class 4T, principally because of adverse topographic conditions, while 2,220 acres have been classified as Class 4 TS, principally because of a combination of adverse topographic and soil conditions. For a detailed explanation of each class and subclass refer to The Canada Land Inventory: Soil Capability Classification for Agriculture, CLI Report No. 2, 1965 (reprinted 1969, 1972). 21
28 APPENDIX 2 "UNCLASSIFIED" AREAS TABLE A: Breakdown Of Soils "Unclassified" For Agricultural Capability. Prov. (1) > Area (2) P.E.I. N.S. N.B. QUE. ONT. MAN. SASK. ALTA. (in acres) Urban (3) 0 0 7, , ,769 42,161 58, ,186 Provincial parks ,570, , ,857 1,131,437 National parks , ,922 4,108,374 Forest reserves ,775 1,684,184 10,294 Unmapped (4) ,967 3,451,333 1,758 3,165,709 11,605 1,169,415 Total ,787 3,617,343 1,931,474 4,813,919 2,782,751 6,563,706 (1) (2) (3) (4) Data for Nfld. and B.C. not yet available. The definition of each of these areas and the inventory methodology may vary from province to province for CLI purposes. Those major areas expressly excluded from classification for agricultural capability because the land fell within the confines of those designated urban areas during the CLI agricultural capability mapping program. These areas may include parks, urban areas, etc., according to the method used by each province for reporting. They may also include all those lands outside the CLI boundaries but within the 1:250,000 N.T.S. sheets' boundaries. TABLE B: Total Of Actual Areas Of Urban Land Use. Prov. (1) Area (2) P.E.I. N.S. N.B. QUE. ONT. MAN. SASK. ALTA. (in acres) Designated urban (3) 0 0 7, , ,769 42,161 58, ,186 Built-up (4) 6, , , , ,036 49, , ,334 Total 6, , , ,261 1,011,805 92, , ,520 (1) (2) (3) (4) Data for Nfld. and B.C. not yet available. As in Table A, definition of each of these two types of areas and the inventory methodology may vary from province to province for CLI purposes. Those same areas designated as "urban" in Table A above, and hence, not classified during the CLI agricultural capability mapping program. Built-up areas discovered outside the designated urban areas during the CLI present land use program (PLU). 22
29 APPENDIX 3 PUBLICATIONS ON LAND CAPABILITY From CLI, Lands Directorate, Environment Canada, Ottawa K1A 0H3 (free of charge): Report No. 1 Objectives, Scope and Organization. 66 pp. Revised 1970 Reprinted 1972 Report No. 2 Soil Capability Classification for Agriculture. 16 pp. Reprinted 1972 Report No. 3 The Climates of Canada for Agriculture (being reprinted). 24 pp. 19 maps 1966 Report No. 4 Land Capability Classification for Forestry (2 nd Edition). 36 pp. Revised 1970 Reprinted 1972 Report No. 5 The Economics of Plantation Forestry in Southern Ontario D.V. Love and J.R.M. Williams 46 pp Report No. 6 Land Capability for Recreation. 70 photographs, 2 map examples, 110 pp Report No. 7 Land Capability for Wildlife. Half-tone, stereo and colour illustrations 29 pp Reprinted 1973 Report No. 8 Soil Capability for Agriculture in Nova Scotia Maps and tables. 45 pp Report No. 9 Landowners and Land Use in the Tantramar area, New Brunswick. 195 pp The Canada Geographic Information System - Overview, 8 pp From the Research Branch, Agriculture Canada, Ottawa K1A 007: Hoffman, D.W. 1970, Land-use capability for agriculture. ARDA, Toronto 59 pp. Nowland, S.L. 1975, The agricultural productivity of the soils of the Atlantic Provinces, Can. Dep. Agric. Monograph No. 12,19 pp. Nowland, S.L. 1975, The agricultural productivity of the soils of Ontario and Québec,Can. Dep. Agric. Monograph No. 13, 19 pp. Shields, J.A. and W.S. Ferguson, 1975, Land Resources, Production Possibilities and Limitations for Agricultural Production in the Prairie Provinces. Proceedings of conference on oil seeds and pulse crops in Western Canada. Shields, J.A. and S.L. Nowland, (Land Reserves - Overview) in preparation. 23
24. Wildlife Habitat on Farmland
 24. Wildlife Habitat on Farmland AUTHORS: S.K. Javorek, R. Antonowitsch, C. Callaghan, M. Grant and T. Weins INDICATOR NAME: Wildlife Habitat on Farmland Indicator STATUS: National coverage, 1981 to 2001
B.C./CANADA STATISTICS
 B.C./CANADA STATISTICS CONTENTS 3 B.C./Canada Statistics 3.1 Forestry Practices... 78 Total Crown and private land available for timber production in 1991, by province... 78 Allowable annual cut on Crown
Farm Credit Corporation (FCC) estimates that Canadian farmland values
 estimates that Canadian farmland values") Spring 1999 Farmland Values F a r m C r e d i t C o r p o r a t i o n National trends Methodology 2 Provincial trends Farm Credit Corporation (FCC) estimates that Canadian farmland values rose by only
Spring 1999 Farmland Values F a r m C r e d i t C o r p o r a t i o n National trends Methodology 2 Provincial trends Farm Credit Corporation (FCC) estimates that Canadian farmland values rose by only
Greenhouse gas emissions in the Canadian economy,
 Catalogue no. 11-624-MIE No. 001 ISSN: 1708-0169 ISBN: 0-662-34291-7 Analytical Paper Insights on the Canadian economy Greenhouse gas emissions in the Canadian economy, 1981-2000 by Tarek M. Harchaoui
This article deals with the recent increase in the number
 Electoral and Political Implications Of a Larger Canadian Parliament Roberto Zepeda Martínez* This article deals with the recent increase in the number of seats in Canada s Parliament from 308 to 338,
NATIONAL INVENTORY OF PCBs IN USE AND PCB WASTES IN STORAGE IN CANADA 1995 ANNUAL REPORT
 NATIONAL INVENTORY OF PCBs IN USE AND PCB WASTES IN STORAGE IN CANADA 1995 ANNUAL REPORT PREPARED FOR THE CANADIAN COUNCIL OF MINISTERS OF ENVIRONMENT BY: COMMERCIAL CHEMICALS EVALUATION BRANCH ENVIRONMENTAL
April An Analysis of New Brunswick s Productivity Performance, : Labour Productivity Driven by Capital Intensity Growth CENTRE FOR
 April 2011 111 Sparks Street, Suite 500 Ottawa, Ontario K1P 5B5 613-233-8891, Fax 613-233-8250 csls@csls.ca CENTRE FOR THE STUDY OF LIVING STANDARDS An Analysis of New Brunswick s Productivity Performance,
United States and Canadian Hogs and Pigs
 United States and Canadian Hogs and Pigs Released October 28, 2004, by the National Agricultural Statistics Service (NASS),, U.S. Department of Agriculture. For information on call Dan Lofthus at 202-720-3106
Data from the Waste Management Industry Survey and the Household Environment Survey
 Household participation in composting Data from the Waste Management Industry Survey and the Household Environment Survey Amanda Elliott October 1 st, 2009 Who am I? Why am I here? Amanda Elliott Analyst,
Saskatchewan Labour Force Statistics
 Saskatchewan Labour Force Statistics February 2018 UNADJUSTED DATA According to the Statistics Canada Labour Force Survey during the week covering February 11 th to 17 th,, 2018, there were 555,800 persons
Saskatchewan Labour Force Statistics
 Saskatchewan Labour Force Statistics June 2017 UNADJUSTED DATA According to the Statistics Canada Labour Force Survey during the week covering June 11 th to 17 th,, 2017, there were 579,800 persons employed
Saskatchewan Labour Force Statistics
 Saskatchewan Labour Force Statistics March 2018 UNADJUSTED DATA According to the Statistics Canada Labour Force Survey during the week covering March 11 th to 17 th,, 2018, there were 562,700 persons employed
UPDATE ON THE ECONOMIC IMPACTS OF THE CANADIAN DAIRY INDUSTRY IN 2015
 UPDATE ON THE ECONOMIC IMPACTS OF THE CANADIAN DAIRY INDUSTRY IN 2015 Prepared for Dairy Farmers of Canada July 2016 Siège social : 825, rue Raoul-Jobin, Québec (Québec) Canada, G1N 1S6 Montréal : 201-1097,
Saskatchewan Labour Force Statistics
 Saskatchewan Labour Force Statistics April 2018 UNADJUSTED DATA According to the Statistics Canada Labour Force Survey during the week covering April 15 th to 21 st, 2018, there were 558,300 persons employed
National Inventory of PCBs in Use and PCB Wastes in Storage in Canada
 National Inventory of PCBs in Use and PCB Wastes in Storage in Canada 1997 Annual Report Prepared for Canadian Council of Ministers of the Environment by Toxics Pollution Prevention Directorate Environmental
Saskatchewan Labour Force Statistics
 Saskatchewan Labour Force Statistics June 2018 UNADJUSTED DATA According to the Statistics Canada Labour Force Survey during the week covering June 10 th to 16 th, 2018, there were 583,700 persons employed
Very slight to negligible limitations no special land management practices required.
 Land Capability Classes Land and Soil Capability Class 1 Class 1 Definition Very slight to negligible limitations no special land management practices required. On-site impact of land management practices
Catalogue no XIE. Cattle. 2005, vol. 4, no. 1. Statistique Canada. Statistics. Canada
 Catalogue no. 23-012-XIE Cattle Statistics 2005, vol. 4, no. 1 Statistics Canada Statistique Canada How to obtain more information Specific inquiries about this product and related statistics or services
IMPLEMENTING CANADA S PLAN TO ADDRESS CLIMATE CHANGE AND GROW THE ECONOMY
 IMPLEMENTING CANADA S PLAN TO ADDRESS CLIMATE CHANGE AND GROW THE ECONOMY PUTTING A PRICE ON CARBON POLLUTION Technical Briefing October 23, 2018 Addressing climate change and growing the economy Canada
Catalogue no XIE. Cattle. 2006, vol. 5 no. 2. Statistique Canada. Statistics. Canada
 Catalogue no. 23-012-XIE Cattle Statistics 2006, vol. 5 no. 2 Statistics Canada Statistique Canada How to obtain more information Specific inquiries about this product and related statistics or services
BUSINESS PUBLICATION Publisher s Statement 6 months ended December 31, 20XX Subject to Audit
 Canadian Business Paid/Nonpaid BUSINESS NEWS TODAY BUSINESS PUBLICATION Publisher s Statement 6 months ended December 31, 20XX Subject to Audit Field Served: BUSINESS NEWS TODAY is edited for creative
GREENHOUSE GAS EMISSIONS REPORTING PROGRAM. Overview of 2008 Facility Data
 GREENHOUSE GAS EMISSIONS REPORTING PROGRAM Overview of 2008 Facility Data Photo credits: Cover page: Photocom Inside: Jim Moyes (p. 1); Photocom (p. 12) ISSN 1918-6150 Her Majesty the Queen in Right of
14. Soil Organic Carbon
 14. Soil Organic Carbon AUTHORS: B. McConkey, J. Hutchinson, W. Smith, B. Grant and R. Desjardins INDICATOR NAME: Soil Organic Carbon Change STATUS: National coverage, 1981 to 2001 SUMMARY Soil organic
Evaluating government plans and actions to reduce GHG emissions in Canada: The state of play in 2016
 Evaluating government plans and actions to reduce GHG emissions in Canada: The state of play in 2016 Hadrian Mertins-Kirkwood, Canadian Centre for Policy Alternatives Bruce Campbell, CCPA & University
Overview of livestock farm operating expenses
 Catalogue no. 96 32 X No. 008 ISSN 0-662-369-4 Canadian Agriculture at a Glance Overview of livestock farm operating expenses by Jean-Mathieu Lachapelle Release date: October 28, 2014 How to obtain more
TECHNICAL SUPPORT DOCUMENT # 1 COMPARATIVE EVALUATION OF ALTERNATIVE SITES APPENDIX TDS#1-G. Agriculture Component
 TECHNICAL SUPPORT DOCUMENT # 1 COMPARATIVE EVALUATION OF ALTERNATIVE SITES APPENDIX TDS#1-G Agriculture Component February 2013 February 2013 Agriculture Component Appendix TSD#1-G COMPARATIVE EVALUATION
The Newfoundland and Labrador Agricultural Context: A Comparison with the Overall Context in Canada
 The Newfoundland and Labrador Agricultural Context: A Comparison with the Overall Context in Canada Chrissy Vincent November 2 nd, 2016 Photo: Vicky TH Acknowledgements: This work was funded by Agrivita
Query Manufacturer File
 Query Manufacturer File This chapter provides record formats needed to query a manufacturer identification (MID) code. RECORD DESCRIPTIONS Record Identifier $ (Input).........................QMF-3 A mandatory
1. Agricultural Land Capability Background
 Contents Introduction... 2 1. Agricultural Land Capability Background... 3 2. Electoral Area B ALR Boundary Review... 5 3. Baynes Lake Official Community Plan... 6 4. Agricultural Capability within the
Resolution : of a degree which corresponds to approximately 25 meters
 Canada Land Inventory (CLI) CANADA LAND INVENTORY LEVEL I LAT/LON DIGITAL DATA REVISED EDITION LAND CAPABILITY FOR WILDLIFE-WATERFOWL 1. Coverage Specifications Original Map Scale: 1:250,000 Resolution
Canadian Environmental Employment
 Canadian Environmental Employment Supply and demand (preliminary findings) September 2017 Photo credit: Andrew Neel About ECO Canada 2 For over 20 years, we ve studied the environmental labour market and
What s in LawSource Tribunals
 What s in LawSource s 02/2018 LawSource includes all tribunal decisions published in print reporters from 1997 forward, and the full text of all decisions reported in Labour Arbitration Cases since 1948.
April An Analysis of Newfoundland and Labrador s Productivity, : Mining, and Oil and Gas Extraction Drives Strong Productivity Growth
 April 2011 111 Sparks Street, Suite 500 Ottawa, Ontario K1P 5B5 613-233-8891, Fax 613-233-8250 csls@csls.ca CENTRE FOR THE STUDY OF LIVING STANDARDS An Analysis of Newfoundland and Labrador s Productivity,
Query Manufacturer File
 Query Manufacturer File RECORD DESCRIPTIONS This chapter provides record formats needed to query a manufacturer identification (MID) code. Record Identifier $ (Input)...... QMF-3 A mandatory query manufacturer
Soil Mapping, Classification and Land Use Planning. Environmental Management Branch Ontario Ministry of Agriculture, Food and Rural Affairs
 Soil Mapping, Classification and Land Use Planning Environmental Management Branch Ontario Ministry of Agriculture, Food and Rural Affairs Farmland Forum - March 2017 1 Pressures on Ontario s Soils Loss
FARMLAND A Prerequisite for Farmers, Food and Agri-food Policy
 FARMLAND A Prerequisite for Farmers, Food and Agri-food Policy August, 2016 POLICY BRIEF Authors Dr. David J. Connell, Univ. of Northern British Columbia Dr. Wayne Caldwell, Univ. of Guelph Dr. Chris Bryant,
CROSS-CANADA DEFINITION OF UNION PRIVATE SECTOR. Statute s Definition of Trade Union Union or Labour Organization
 CROSS-CANADA DEFINITION OF UNION PRIVATE SECTOR Jurisdiction Statute Uses Trade Union? Legislation Reference Statute s Definition of Trade Union Union or Labour Organization Canada Yes Trade Union s.3(1)
Pan-Canadian Approach to Carbon Pricing. High Level Regional Dialogue on Carbon Pricing January 22, 2018 Environment and Climate Change Canada
 Pan-Canadian Approach to Carbon Pricing High Level Regional Dialogue on Carbon Pricing January 22, 2018 Environment and Climate Change Canada Pan-Canadian Carbon Pricing Benchmark Timely introduction (in
OCCUPATIONAL LANDSCAPE
 OCCUPATIONAL LANDSCAPE HYDROLOGIST & HYDROGEOLOGIST ECO Canada has developed the Occupational Landscape report to provide insight on twelve professions working with or in the Environmental sector. This
Agricultural Impact Assessment Killarney Bay Road, Geographic Township of Fenelon City of Kawartha Lakes CCS Project No. 2602
 Agricultural Impact Assessment Killarney Bay Road, Geographic Township of Fenelon City of Kawartha Lakes CCS Project No. 2602 May 2015 Prepared for: Invenergy Canada Prepared by: Clark Consulting Services
Private Woodland Owners - Meeting the Stewardship Challenge
 Private Woodland Owners - Meeting the Stewardship Challenge Authors: Erin Neave (conference presenter), Neave Resource Management, Nepean, Ontario, Canada (neavee@igs.net) Doug Wolthausen (co-author),
15. Soil Salinity SUMMARY THE ISSUE
 15. Soil Salinity AUTHORS: B.H. Wiebe, R.G. Eilers, W.D. Eilers and J.A. Brierley INDICATOR NAME: Risk of Soil Salinization STATUS: Provincial coverage (AB, SK, MB), 1981 to 2001 SUMMARY At very low levels,
Sample Assessment Booklet: New Layout Booklet 2 ANSWERS. Ontario Secondary School Literacy Test (OSSLT) 2015
 2015") Sample Assessment Booklet: New Layout Booklet 2 ANSWERS Ontario Secondary School Literacy Test (OSSLT) 2015 INSTRUCTIONS Attempt all questions. If you leave a question blank, the question will be scored
Sample Assessment Booklet: New Layout Booklet 2 ANSWERS Ontario Secondary School Literacy Test (OSSLT) 2015 INSTRUCTIONS Attempt all questions. If you leave a question blank, the question will be scored
Operating revenues of businesses in the Employment Services Industry decreased 7.1% in 2009, dropping to $8.7 billion from a year earlier.
 Catalogue no. 63-252-X. Service bulletin Employment Services 2009. Highlights Operating revenues of businesses in the Employment Services Industry decreased 7.1% in 2009, dropping to $8.7 billion from
2014 Survey of Environmental Workers Section 1 Methodology
 2014 Survey of Environmental Workers Section 1 Methodology April 1 P2015 a g e Introduction This document reports the results from the 2014 Survey of Environmental Workers. The primary purpose of the survey
Digging a Big Hole: How tar sands expansion undermines a Canadian energy strategy that shows climate leadership
 Digging a Big Hole: How tar sands expansion undermines a Canadian energy strategy that shows climate leadership Introduction Canadian provinces are developing an energy strategy together that will be finalized
Esri Business Analyst (Canadian Edition) Map Your Way to Better Business Decisions
 Map Your Way to Better Business Decisions") Esri Business Analyst (Canadian Edition) Map Your Way to Better Business Decisions Esri Business Analyst (Canadian Edition) The Most Complete GIS and Data Solution for Geographic Business Analysis To
Esri Business Analyst (Canadian Edition) Map Your Way to Better Business Decisions Esri Business Analyst (Canadian Edition) The Most Complete GIS and Data Solution for Geographic Business Analysis To
Operating revenue for the employment services industry rose 9.5% in 2012, increasing to $11.5 billion.
 Catalogue no. 63-252-X. Service bulletin Employment Services 2012. Highlights Employment services, 2012 Operating revenue for the employment services industry rose 9.5% in 2012, increasing to $11.5 billion.
Catalogue no. 16F0023X. Waste Management Industry Survey: Business and Government Sectors
 Catalogue no. 16F0023X Waste Management Industry Survey: Business and Government Sectors 2006 How to obtain more information For information about this product or the wide range of services and data available
Catalogue no X. Electric Power Generation, Transmission and Distribution
 Catalogue no. 57-202-X Electric Power Generation, Transmission and Distribution 2006 How to obtain more information For information about this product or the wide range of services and data available from
Farm and Off-Farm Income Statistics
 Catalogue no. 21-019-XIE Farm and Off-Farm Income Statistics 2001 Statistics Canada Statistique Canada How to obtain more information Specific inquiries about this product and related statistics or services
Buried Treasure: Groundwater Permitting and Pricing in Canada. Alfonso Rivera Chief Hydrogeologist Geological Survey of Canada
 Buried Treasure: Groundwater Permitting and Pricing in Canada Alfonso Rivera Chief Hydrogeologist Geological Survey of Canada Exempt Wells Conference, Walla Walla, WA May 17-18, 2011 1 OUTLINE Buried Treasure
National Register of Electors. Updates: November 2017 Annual Lists
 National Register of Electors Updates: November 2017 Annual Lists Table of Contents Introduction...3 Overview...4 1. Background...5 2. Updating...5 3. Quality...7 3.1 Coverage...7 3.2 Currency...10 3.3
Fiscal Federalism in Canada. Rupak Chattopadhyay
 Fiscal Federalism in Canada Rupak Chattopadhyay Web statistics Yukon (1898) 0.1% North-West Territories (1870) 0.1% Provinces and territories (date of entry into Confederation) and % share of 2013 population
The Social and Economic Importance of Canada s Privately Owned Forest Lands
 The Social and Economic Importance of Canada s Privately Owned Forest Lands Key Points n Private forests make up 6% of Canada s 402 million ha of forested land and 13% of the managed forest. n Private
Low Estimate High Estimate Method/Source Description
 Name Air and Carbon Alberta Greenhouse Gas Emissions Trading System Ontario Emissions Trading Registry On Road Vehicle and Engine Emission Regulations trading system Heavy duty Vehicle and Engine Greenhouse
Access to Residential Recycling of Paper Packaging Materials in Canada. October 2014
 Access to Residential Recycling of Paper Packaging Materials in Canada October 2014 Submitted to: Prepared by: Access to Residential Recycling of Packaging and Packaging Materials in Canada 2 Table of
Cropland Values in Canada
 Cropland Values in Canada HIGHLIGHTS Using data from the Farm Financial Survey (FFS), this study provides an overview of trends in cropland values in Canada -. Cropland values were highest in British Columbia,
8 Healthy environment 9
 8 Healthy environment 9 11 Canada s Provincial Trees Can you list the official tree for each Canadian Province and Territory? British Columbia Alberta Saskatchewan Manitoba Ontario Quebec New Foundland
A S S E S S I NG COMMUNITY A G R I C U L T U R A L S U I T A B I L I T Y I N S P R Y F I E L D, N O V A S C O T IA
 A S S E S S I NG COMMUNITY A G R I C U L T U R A L S U I T A B I L I T Y I N S P R Y F I E L D, N O V A S C O T IA P R EPARED BY: JAR ED D ALZ IE L MARCH 5, 2 0 1 2 D ALHOUSIE U NVERSITY & CHEBUCTO CON
Payroll & Vacations: Is Your Organization Compliant?
 One of the biggest anxieties for payroll professionals is dealing with annual vacations. While it may seem like a simple and straightforward aspect of the employment relationship, it is can be quite complex.
A RESIDENTIAL END-USE ENERGY CONSUMPTION MODEL FOR CANADA
 A RESIDENTIAL END-USE ENERGY CONSUMPTION MODEL FOR CANADA A.S. Fung, M. Aydinalp, V. I. Ugursal, H. Farahbakhsh Canadian Residential Energy End-use Data and Analysis Centre Department of Mechanical Engineering
New Brunswick Census of Agriculture Graphs October 2017
 New Brunswick Census of Agriculture Graphs 216 October 217 New Brunswick Census of Agriculture Report 216 Province of New Brunswick P.O. Box 6, Fredericton NB E3B 5H1 CANADA www.gnb.ca Printed English
Appendix D. Land Evaluation Site Assessment System
 Appendix D Land Evaluation Site Assessment System Town of Dewey Comprehensive Plan 2009 PORTAGE COUNTY S LAND EVALUATION SITE ASSESSMENT SYSTEM A tool to help local communities understand the agricultural
APPLICATION CHECKLIST VESSEL OPERATION RESTRICTION REGULATIONS
 APPLICATION CHECKLIST VESSEL OPERATION RESTRICTION REGULATIONS GENERAL INFORMATION This checklist will help local authorities prepare applications for Vessel Operation Restriction Regulations (VORR). Transport
Agricultural Lands of Importance to the State of Hawaii
 Agricultural Lands of Importance to the State of Hawaii Harold L. Baker Specialist in Agricultural Economics Cooperative Extension Service College of Tropical Agriculture and Human Resources University
Volunteers in Arts and Culture Organizations in Canada
 Volunteers in Arts and Culture Organizations in Canada Hill Strategies Research Inc. http://www.hillstrategies.com Hill Strategies Research Inc., November 2003 Research series on the arts, Vol. 2 No. 1
Department of Agriculture, Aquaculture and Fisheries
 AGRICULTURAL LAND POLICY CONSULTATIONS WHAT WAS SAID June 2016 Department of Agriculture, Aquaculture and Fisheries Message from the Minister of Agriculture, Aquaculture and Fisheries Agriculture plays
National Wildfire Prevention Campaign: Survey Results. Hayley Hesseln, Toddi Steelman, David Zhang University of Saskatchewan
 National Wildfire Prevention Campaign: Survey Results Hayley Hesseln, Toddi Steelman, David Zhang University of Saskatchewan October 25, 2015 The problem The problem The problem The problem The problem
Contents ... TEACHER GUIDE STUDENT HANDOUTS
 Contents TEACHER GUIDE Assessment Rubric... 4 How Is Our Resource Organized?... 5 Bloom s Taxonomy for Reading Comprehension... 6 Vocabulary... 6 STUDENT HANDOUTS Reading Comprehension 1. What is Government?...
The CHBA Poll Winter 2013
 The CHBA Poll Winter 213 The 46 th Pulse Survey of new home builders and renovators was conducted by the Canadian Home Builders' Association (CHBA) in December 212 and January 213 with the assistance of
Form F5 Change of Registration Information (sections 3.1 and 4.1)
") Form 33-109F5 Change of Registration Information (sections 3.1 and 4.1) General Instructions Complete and submit this form to notify the relevant regulator(s) or, in Québec, the securities regulatory authority,
Form 33-109F5 Change of Registration Information (sections 3.1 and 4.1) General Instructions Complete and submit this form to notify the relevant regulator(s) or, in Québec, the securities regulatory authority,
Results from the National Municipal Adaptation Survey
 Canada NMAP Results Results from the National Municipal Adaptation Survey Since the Intergovernmental Panel on Climate Change (IPCC) issued its consensus reports on climate change, the global science and
Canadian Fertilizer Institute. Presentation to the. Senate Standing Committee on Agriculture and Forestry
 Canadian Fertilizer Institute Presentation to the Senate Standing Committee on Agriculture and Forestry Study on international market access priorities for the Canadian agricultural and agri-food sector
AMO Background Paper and Survey on Municipal Council Term and Related Matters
 AMO Background Paper and Survey on Municipal Council Term and Related Matters February 2005 (Survey is attached as a separate Word document) Association of Municipalities of Ontario 393 University Avenue,
FORM F3 BUSINESS LOCATIONS OTHER THAN HEAD OFFICE (section 3.2)
") FORM 33-109F3 BUSINESS LOCATIONS OTHER THAN HEAD OFFICE (section 3.2) GENERAL INSTRUCTIONS Complete and submit this form to notify the relevant regulator(s) or, in Québec, the securities regulatory authority,
FORM 33-109F3 BUSINESS LOCATIONS OTHER THAN HEAD OFFICE (section 3.2) GENERAL INSTRUCTIONS Complete and submit this form to notify the relevant regulator(s) or, in Québec, the securities regulatory authority,
 Historical and Comparative Cabinet Structures Companion Document Cabinet Secretariat 2015 1 Historical and Comparative Cabinet Structures Confidentiality Statement The information contained in this document
NOVA SCOTIA GPI SOILS AND AGRICULTURE ACCOUNTS: PART 2: RESOURCE CAPACITY AND USE SECTION 3: LAND CAPACITY
 M E A S U R I N G S U S T A I N A B L E D E V E L O P M E N T A P P L I C A T I O N O F T H E G E N U I N E P R O G R E S S I N D E X T O N O V A S C O T I A NOVA SCOTIA GPI SOILS AND AGRICULTURE ACCOUNTS:
Submit this form at the National Registration Database (NRD) website in NRD format at
 website in NRD format at") FORM 33-109F2 CHANGE OR SURRENDER OF INDIVIDUAL CATEGORIES (section 2.2(2), 2.4, 2.6(2) or 4.1(4)) GENERAL INSTRUCTIONS Complete and submit this form to notify the relevant regulator(s) or, in Québec,
FORM 33-109F2 CHANGE OR SURRENDER OF INDIVIDUAL CATEGORIES (section 2.2(2), 2.4, 2.6(2) or 4.1(4)) GENERAL INSTRUCTIONS Complete and submit this form to notify the relevant regulator(s) or, in Québec,
Class Principal Soils
 LAND RESOURCES Soil Characteristics Soils in the hilly regions are formed from material weathered from granitic gneiss and other igneous or metamorphosed rocks. They belong to the Chester-Glenville-Brandywine
RENEWABLE FUELS A SUCCESS FOR GOVERNMENTS A SURVEY OF 1,750 CANADIANS JUNE 2015
 RENEWABLE FUELS A SUCCESS FOR GOVERNMENTS A SURVEY OF 1,750 CANADIANS JUNE 2015 CANADA S LEADING VOICE FOR RENEWABLE FUELS For over 30 years, the Canadian Renewable Fuels Association (CRFA) has been the
2012 Statistics on the International Movements of Hazardous Waste and Hazardous Recyclable Material
 2012 Statistics on the International Movements of Hazardous Waste and Hazardous Recyclable Material Waste Reduction and Management Division Environment Canada OCTOBER 2013 Cat. No.: En11-7E-PDF ISSN: 1927-2359
We grow a lot more than you may think
 We grow a lot more than you may think Find out what makes our agriculture and agri-food industry the apple of Canada s eye Agriculture and Agri-Food Canada Agriculture et Agroalimentaire Canada Ag Facts
Percent of provincial total. county land area 64,
 GUYSBOROUGH COUNTY PROFILE of AGRICULTURAL LAND RESOURCES Overview of county land resources Land most suitable for agricultural production (Canadian Land Inventory (CLI) classes 2,3 and 4 i ) covers approximately
Bullfrog Power Green Energy Audit Report 2016 Table of Contents
 Bullfrog Power Green Energy Audit Report 2016 Table of Contents Bullfrog Power Green Energy Audit Report 2016 Bullfrog Audit Report 2016 Table of Contents Table of Contents Sale of Green Electricity and
Council of the Federation Founding Agreement
 Council of the Federation Founding Agreement Preamble Premiers agreed to create a Council of the Federation, as part of their plan to play a leadership role in revitalizing the Canadian federation and
FutureMetrics LLC 8 Airport Road Bethel, ME 04217, USA
 Why is the Heating Pellet Market in Canada so Small? Why One Province Will Soon Embrace Pellets for Heating! By William Strauss, PhD October 30, 2015 The US heating pellet market consumes an estimated
Renewable Energy Financial Support in Canada. M. Stumborg, AAFC SPARC Swift Current, Saskatchewan Canada
 Renewable Energy Financial Support in Canada M. Stumborg, AAFC SPARC Swift Current, Saskatchewan Canada The Future?? 2 Office of Energy Efficiency ecoenergy Programs 2007/2008 2011/2012 1. ecoenergy Retrofit
Agricultural Labour Market Information: The Latest Numbers
 Agricultural Labour Market Information: The Latest Numbers Michael Burt and Jean-Charles Le Vallée The Conference Board of Canada Debra Hauer Canadian Agricultural Human Resource Council March 15, 2016
Canadian International Merchandise Trade
 Catalogue no. 65-001-X Vol. 69, no. 7. Canadian International Merchandise Trade. Statistical tables Table 1 Merchandise trade of Canada, balance of payments basis, seasonally adjusted - Current dollars
Canadian International Merchandise Trade
 Catalogue no. 65-001-X Vol. 66, no. 9. Canadian International Merchandise Trade. Statistical tables Table 1 Merchandise trade of Canada, balance of payments basis, seasonally adjusted Current dollars Export
Canadian International Merchandise Trade
 Catalogue no. 65-001-X Vol. 69, no. 9. Canadian International Merchandise Trade. Statistical tables Table 1 Merchandise trade of Canada, balance of payments basis, seasonally adjusted - Current dollars
Canadian International Merchandise Trade
 Catalogue no. 65-001-X Vol. 69, no. 12. Canadian International Merchandise Trade. Statistical tables Table 1 Merchandise trade of Canada, balance of payments basis, seasonally adjusted - Current dollars
Understanding the Training and Professional Development Needs of CIC-funded Settlement Service Providers November 2014
 Understanding the Training and Professional Development Needs of CIC-funded Settlement Service Providers November 2014 Data Analysis and Report by OCASI the Ontario Council of Agencies Serving Immigrants
CANADA-WIDE STANDARD. for BENZENE PHASE 2
 Canadian Council of Ministers of the Environment CANADA-WIDE STANDARD for BENZENE PHASE 2 Endorsed by CCME Council of Ministers, September 22-23, 2001, The Pas MB 1 of 6 CANADA-WIDE STANDARD for BENZENE
Appendix I New Zealand Land Use Capability Classification
 Appendices Appendix I New Zealand Land Use Capability Classification New Zealand Land Use Capability Units(From Our Land Resources a bulletin to accompany New Zealand Land Resource Inventory Worksheets,
Transitioning to the new rural cannabis economy
 Transitioning to the new rural cannabis economy Rural Policy Learning Commons Webinar Prepared by Tracey Harvey, PhD Student, University of Guelph Thursday, September 27 th, 2018 A PhD project supported
Effective October CURRENT
 Flag Display Policy Policy Number POL-20 Effective October 04 2017 Review Date Not scheduled Final Approver Council Training Course Code Not applicable Document State CURRENT 1.0 Purpose The purpose of
CANADIAN DAIRY COMMISSION
 CANADIAN DAIRY COMMISSION COST OF PRODUCTION FINAL RESULT BASED ON 2010 SURVEY DATA INDEXED TO 3 RD QUARTER OF 2011 November 2011 Policy and Economics Section DM#197552-v4 2010 COP Highlights Results The