Development of Biomass Harvesting Systems
|
|
|
- Erica Ward
- 5 years ago
- Views:
Transcription

1 Development of Biomass Harvesting Systems Stuart Birrell, Dept. of Agricultural and Biosystems Engineering Iowa State University 1
2 Biorefinery Capacity, Feedstock Supply Economical Biorefinery Capacity Requirements for 2000 ton/day (approx 50m gal/yr) Production Area and Storage Capacity Required 6950 square miles, Mean Travel Distance 40 miles (Perlack and Turhollow, 2002) 30% Corn acreage, 50% farmer participation Storage Capacity (300 days) 1,200 million lbs, 109 million cubic feet (Material Density 11 lbs/cubic feet) 2500 acre.ft (100 acres by 25 ft high) Transportation Bio-refinery delivery 53 ft truck, 50,000lb Tare (Assuming weight limited truck) 80 trucks per day (year round delivery) 320 trucks per day (3 month harvest/delivery window) Field Harvest Transportation & Logistics 2 ton/acre, 12 acres/hr, 10 hours day. 10 truck loads day (assuming weight limit, i.e lbs/cubic foot) 40 truck loads day (raw density 3-4 lbs/cubic foot) 2
3 Development of Feedstock Supply Chain Harvest Technologies Harvest Capacity and costs Capital Investment costs, Flexibility of machinery use Seasonal Labor requirements Transportation and Storage Logistics Low Density Material Transportation Distance and Costs Local Farm Storage, Satellite Storage Systems, Central Storage Systems Storage Systems Wet Storage vs. Dry Storage, Preprocessing during storage (Increase Energy Density / Value) Material Transfer Bulk Material System vs. Unit Operations System Producer Acceptance Technology adoption Due to supply catchment area, adoption curve must be dramatically shifted Risk management Timeliness of operations Demonstration of a viable feedstock supply chain Scale consistent with farm operations Sustainable Production Systems Soil Quality, Water Quality, Environmental Concerns (Public Perception) 3
 High")

4 Stover Harvesting Systems: Multi-pass forage harvest systems Conventional Forage Harvesters or balers Densification, Transportation and Logistics Multiple Operations, Timeliness of Field Operations Moisture Content for storage Unit Handling versus Bulk Handling Soil Contamination (15%) High percentage of Stalks, (Moisture & Nutrients) Single Pass, Combined Stream Harvesting System Ear corn and chopped stover, without threshing Densification, Transportation and Logistics Grain Quality and Accountability Centralized equipment for separation and processing Storage volumes, central storage 4


 Significant Investment cost for low")

5 Single Pass Corn Cob Mix Cob Harvesting Systems: Changes in sieves and bars Field Transportation and Logistics Cobs high density, low nutrient content Additional Separation system for cobs Conversion back to conventional harvest Grain Damage?? Single Pass Towed Cob Separation Separation system towed by combine Grain Quality not impacted No secondary separation system Fewer support tractors, Transportation and Logistics Mass of wagon and maneuverability Reduces harvest capacity due to unloading (& power) Significant Investment cost for low volume feedstock Flexible Single Pass Harvesting, Dual Stream Harvesting System Conventional harvester, two harvest streams, Grain and Cobs Utilizes multi-use conventional harvest machinery, capital costs Grain Quality and Accountability Transportation and Logistics Complexity and cost for low volume material 5


6 Dual Stream Harvesting Systems: Dual Pass Harvesting, Dual Stream Harvesting System (University of Wisconsin) Conventional harvester, two harvest streams, Grain and Biomass, windrow of stover behind combine Utilizes multi-use conventional harvest machinery, capital costs Decouples, grain harvest from stover logistics Improved Cob Collection and soil contamination Grain Quality and Accountability Multi-pass, timeliness of second operations Flexible Single Pass Harvesting, Dual Stream Harvesting System Conventional harvester, two harvest streams, Grain and Biomass Utilizes multi-use conventional harvest machinery, capital costs Grain Quality and Accountability Higher collection efficiency Single pass Densification, Transportation and Logistics Harvest capacity 6

7 Single Pass Harvester System Development Based on modular attachments to standard combine lower capital conversion costs, maximum flexibility, lower risk Producer control of ownership and independent marketing of the grain rapid conversion from conventional corn harvest to corn/stover harvest Variable removal rates Harvest capacity, timeliness of operations, seasonal labor 7


8 System Flexibility 8


9 Department of Agricultural and Biosystems Engineering Material Size Reduction, 2007 Design Top 50% Removal, Row Crop Head Bottom 50% Removal, Row Crop Head Top 50% Removal, Corn Head Cob Cut Length, Row Crop Head 9


10 Cob Fractionation System,

11 Machinery Development Research Summary Performance evaluation of Chopper designs Particle size reduction Impact Chopper, size reduction more variable Shear Chopper, stalks & cobs to 2, husks less success Power consumption Impact Chopper, higher power demand Shear Chopper, lower power demand Performance evaluation of conventional and row crop headers Field capacity Conventional, 100% Prototype row crop header, 50-75% Percent stover removal Conventional head, approx 30% of 100% stover removal Prototype row crop header, approx 3 ton dry matter per acre at 100% removal Identification of machine productivity limiting factors Conventional Header No loss in harvest capacity, limited stover removal Row Crop Header Limits Field Capacity 70-80% 11
, All material from cob to top of the plant (Top 50% Removal) MOG removal with conventional head (Cob/Husk Only).")
12 Status A second generation harvest system has been designed in conjunction with John Deere. Complete stover collection (100% Removal), All material from cob to top of the plant (Top 50% Removal) MOG removal with conventional head (Cob/Husk Only). COB only removal (in development) The system allows automatic transition from biomass/grain harvest to grain only harvest. The field capacity is approximately 50-75% of that of conventional corn harvest with 100% removal Equal to conventional harvest with a conventional corn head is used with stover (Cob/Husk) collection. The additional horsepower requirements for stover harvest over conventional harvest were 65, 50, and 45 Hp for 100% stover removal, Top 50% removal, and Cob/Husk removal respectively, with estimated stover yields for 3, 2.2 and 1.2 tons/acre. Major limiting factor for biomass harvest are that the field logistics associated with moving the material from the harvester. 12
13 Harvest Logistics 13
 Grain Density (wet) 45 lb/ft 3 Grain Density (dry) 28-42 lb/ft 3 Transport Volume (200 bu) 248 ft 3 /ac Cobs Only: Yields :")
 400 ft 3 /ac Corn Stover: Yields: 100% Harvest 3-4 ton/ac Top 50% Harvest 2-2.")
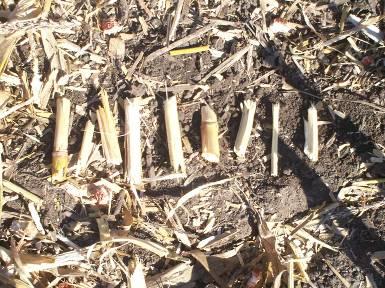
14 Harvest Logistics Grain Only: ( ft 3 /bu) Grain Density (wet) 45 lb/ft 3 Grain Density (dry) lb/ft 3 Transport Volume (200 bu) 248 ft 3 /ac Cobs Only: Yields : Per bushel of grain 14 lb/bu Volume Ratio (Cob:Grain) Cob Density lb/ft 3 Bulk Density 7-9 lb/ft 3 Transport Volume (200 bu) 400 ft 3 /ac Corn Stover: Yields: 100% Harvest 3-4 ton/ac Top 50% Harvest ton/ac Cobs & Husk ton/ac Bulk Density 3 lb/ft 3 Transport Volume (2 t/ac) 1333 ft 3 /ac Figure 1. The 100% stover removal. Figure 2. The 50% top stover removal. 14
15 Stover Nutrient Composition Table 1. Dry matter and nutrient composition by corn plant part at maturity.* Component Dry Matter Nitrogen Phosphorus Potassium %oftotal lb/acre %N lb N/acre lb N/ton %P 2O 5 lb P 2O 5/acre lb P 2O 5/ton %K 2O lb K 2O/acre lb K 2O/ton Grain** 48.0% 7, % % % Stover 52.4% % % % Stalks 22.0% 3, % % % Leaves 10.6% 1, % % % Sheaths 5.3% % % % Husks 4.3% % % % Shanks 1.5% % % % Cobs 7.5% 1, % % % Tassels 0.5% % % % Lower ears 0.5% % % % Silks 0.2% % % % *Source: After Sawyer and Mallarino, Iowa State University Extension Service. ( **Corn yield at 161 bu/acre. 15
16 Field Tests of Four Stover Harvest Scenarios Objectives: Four different harvest systems Conventional Harvest Top 50% Removal Bottom 50% Removal 100% Removal Evaluation of plant nutrients removal and the potential impact soil quality indicators potential ethanol production from the various stover fractions. (Iowa State University, USDA-ARS, Idaho National Labs) Figure 1. The 100% stover removal. Figure 2. The 50% top stover removal. 16
17 Stover Yield and Ethanol Production Table 1: Grain and stover yields for the four harvest scenarios Harvest scenario Grain Stover Moisture (% Wet basis) Yield (bu ac 1 ) Moisture (% Wet basis) Wet Yield (ton ac 1 ) Dry Yield (ton ha 1 ) High cut Top 11.20% % High cut bottom 63.90% Low cut 12.10% % Normal cut 11.80% % Table 2: Theoretical Ethanol Yield Harvest scenario C6 yield C5 yield Total yield C6 EtOH C5 EtOH gal ton 1 Dry Basis gal ac 1 high cut top high cut bottom low cut normal cut Total EtOH 17
18 N, P, and K Nutrient Removal Table 2: Nutrient removal associated with four corn stover harvest scenarios Harvest Scenario Carbon Macronutrients (lb ac 1 ) Micronutrients, (oz ac 1 ) (ton ac 1 ) N P K Ca Mg Cu Fe Mn Zn High cut top High cut bottom Low cut Normal Cut LSD (0.05) ns ns ns Table 3: Nutrient concentrations in corn stover collected using different harvest scenarios Harvest Scenario Carbon Macronutrients (lb ton 1 ) Micronutrients, (oz ton 1 ) (lb ton 1 ) N P K Ca Mg Cu Fe Mn Zn High cut top High cut bottom Low cut Normal Cut LSD (0.05) ns 1.20 ns ns ns 18

19 Stover Harvest Scenarios Summary Conclusions: Harvesting at the normal height would probably provide best system Biomass Harvest Yields Maximum Removal, 3 ton/ac DM Top 50% Removal, 2.2 ton/ac DM Harvesting the lower portion of the stalk is not recommended little dry matter, slow harvest efficiency, increase nutrient replacement costs, decrease surface cover and erosion protection Harvesting the bottom portion of the stalks would also produce a inferior feedstock excessive water content increased transportation and storage costs minimal improvement on ethanol yield, soil contamination may cause problems in the biorefinery. 19


20 Questions??? 20