December 2 nd in Lafayette Indiana and Monticello Illinois December 3 rd in Jacksonville, Illinois
|
|
|
- Erik Atkins
- 5 years ago
- Views:
Transcription
 USDA released its latest Crop Production and WASDE reports. Don t forget we will have on air coverage of the report at 12:40 p.m. Central Time.")

1 November 8, 2013 WE WILL BE UPDATING AND ADDING MATERIAL THROUGHOUT THE DAY ON NOVEMBER 8 TO THIS LETTER BEGINNING AT 11:00 AM CST. PLEASE CHECK BACK OFTEN FOR THE LATEST INFORMATION! This morning (Friday, November 8, 2013) USDA released its latest Crop Production and WASDE reports. Don t forget we will have on air coverage of the report at 12:40 p.m. Central Time. We ll post that audio to this letter shortly after air. Here are some of the key numbers: Support comes from Global Commodity Analytics, NOW taking reservations for upcoming seminars in Illinois & Indiana December 2 nd in Lafayette Indiana and Monticello Illinois December 3 rd in Jacksonville, Illinois Meals provided! Reservations required Seating is limited Contact Mike Zuzolo at USDA November 2013 Crop Production Report for in billions of bushels (released November 8, 2013) Crop USDA November Average Guess Range USDA September Corn: Production
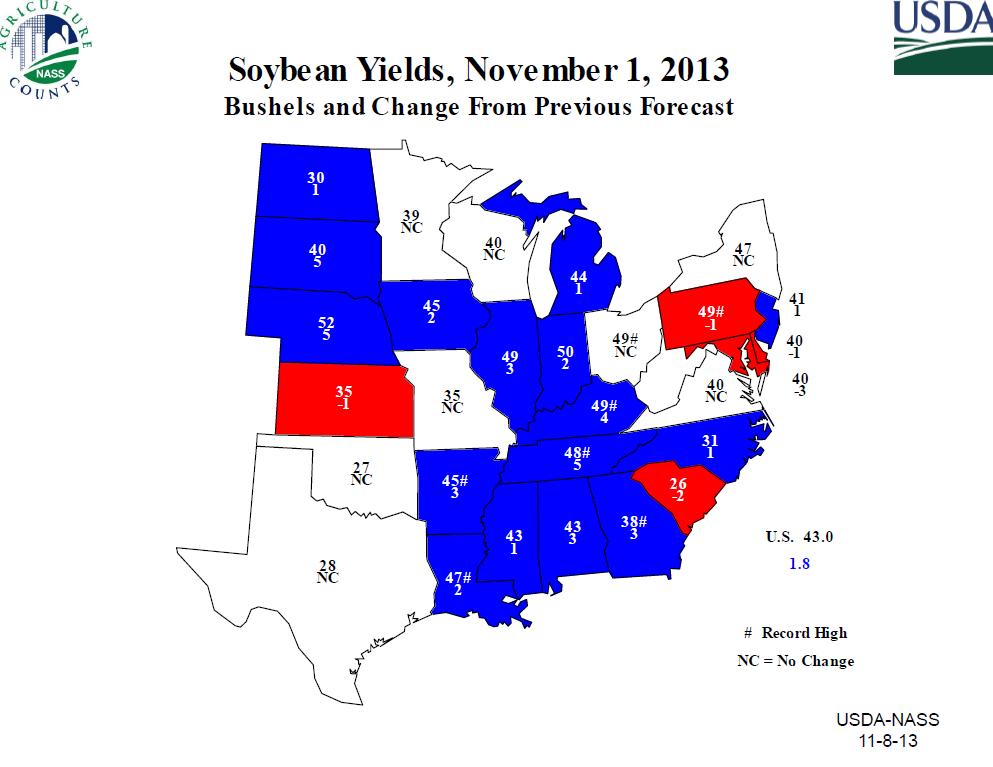
2 Yield Harvested Acres Soybeans: Production Yield Harvested Acres From the November 2013 Crop Production Report: CORN: Corn production is forecast at 14.0 billion bushels, up 1 percent from the previous forecast and up 30 percent from If realized, this will be a new record production for the United States. Based on conditions as of November 1, yields are expected to average bushels per acre, up 5.1 bushels from the previous forecast and 37.0 bushels above the 2012 average. If realized, this will be the highest average yield since Area harvested for grain is forecast at 87.2 million acres, down 2 percent from the previous forecast and down slightly from SOYBEANS: Soybean production is forecast at 3.26 billion bushels, up 3 percent from the previous forecast and up 7 percent from last year. If realized, production will be the third largest on record. Based on November 1 conditions, yields are expected to average 43.0 bushels per acre, up 1.8 bushels from the previous forecast and up 3.2 bushels from Area for harvest in the United States is forecast at 75.7 million acres, down 1 percent from both the previous forecast and last year. To see the full November 2013 USDA Crop Production report go to: documentid=1046 USDA also released its November 2013 WASDE report. Here are the key numbers and comments: 2

3 USDA November 2013 U-S Ending Stocks for in billions of bushels (released November 8, 2013) Crop USDA November Average Guess Range September Corn Soybeans , Wheat From the November 2013 WASDE report: CORN: Projected U.S. feed grain supplies for 2013/14 are raised with higher estimated beginning stocks and increases in corn and sorghum production with the November Crop Production report. Corn production is forecast 146 million bushels higher at a record 13,989 million bushels. A 1.9-millionacre reduction in harvested area is more than offset by a 5.1-bushelper-acre increase in the forecast yield. At bushels per acre, the national average yield remains 4.3 bushels per acre below the record in 2009/10. Despite a late planted crop and July and August dryness across 3
4 much of the Corn Belt, cooler-than-normal summer temperatures and an extended growing season have supported higher-than-expected yields for most producers. Higher yields are forecast this month across the Plains, Corn Belt, and South. Sorghum production is also higher, up 20 million bushels from the September forecast as higher area boosts production despite a lower yield. A very small decrease is reported for oats production with the resurvey of North Dakota and Montana producers. Production for both barley and oats were previously lowered in the Small Grains report. U.S. corn supplies for 2013/14 are projected 307 million bushels higher at a record 14,837 million bushels as this month s increase in production combines with higher beginning stocks from the September 30 Grain Stocks report. Total corn use is raised 275 million bushels, offsetting much of the supply increase. Feed and residual use is raised 100 million bushels with the larger crop. Corn exports are projected 175 million bushels higher with larger supplies and lower prices that have increased the competitiveness of U.S. corn as indicated by strong outstanding export sales and rising export shipments in recent weeks. Ending stocks for 2013/14 are projected 32 million bushels higher at 1,887 million. The projected season-average farm price range for corn is lowered 30 cents at both ends to $4.10 to $4.90 per bushel. Cash and futures prices have responded to rising yield prospects over the past 2 months, sharply reducing the outlook for 2013/14 farm prices. Other notable feed grain changes this month include higher projected 2013/14 exports for sorghum and small revisions to 2012/13 corn and sorghum use. Corn and sorghum trade changes for 2012/13 are based on final August export data reported by the U.S. Census Bureau. Corn use for ethanol production is lowered 17 million bushels for 2012/13 and 9 million bushels for 2011/12 based on revisions to calendar year 2012 ethanol production by the Energy Information Administration. Sorghum food, seed, and industrial use for 2012/13 is also reduced based on lower 2012 ethanol production. SOYBEANS: U.S. oilseed production for 2013/14 is projected at 96.4 million tons, up 3.3 million from the September estimate due to increased soybean, peanut, cottonseed, and canola production. Soybean production is forecast at billion bushels, up 109 million as higher yields more than offset lower harvested area. Harvested area is reduced 0.7 million acres to 75.7 million. The soybean yield is projected at 43.0 bushels per acre, up 1.8 bushels. Soybean supplies for 2013/14 are projected 4 percent above the September estimate on both increased production and beginning stocks. U.S. soybean exports for 2013/14 are raised 80 million bushels to 1.45 billion reflecting increased supplies and the record pace of sales through late October. Soybean crush is raised 30 million bushels to billion mostly due to increased soybean meal exports. Soybean ending stocks are projected at 170 million bushels, up 20 million from the September forecast. 4
5 The U.S. season-average soybean price range for 2013/14 is projected at $11.15 to $13.15 per bushel, down $0.35 on both ends of the range. The soybean meal price is projected at $375 to $415 per short ton, up $15 on both ends of the range. The soybean oil price range is projected at 40 to 44 cents per pound, down 3 cents on both ends. Crop USDA November WASDE Production in millions of metric tons (released November 8, 2013) Argentina Wheat Australia Wheat China Wheat India Wheat USDA November USDA September USDA November USDA September FSU-12 Wheat EU-28 Wheat Argentina Corn Brazil Corn China Corn South Africa Corn Argentina Soybeans Brazil Soybeans


6 From the November 2013 WASDE report: CORN: Global coarse grain supplies for 2013/14 are projected 20.6 million tons higher compared with the September projection. A combination of higher 2012/13 and 2013/14 production and reduced consumption for 2012/13, mostly for corn, boost 2013/14 coarse grain supplies. Global 2013/14 coarse grain production is raised with a 6.2-million-ton increase in corn production. More than half of the increase is for the United States. Corn production is also raised for Russia, India, and the European Union. Corn production for Brazil is reduced with lower expected area as declines in interior corn prices push expected returns into negative territory for the safrinha crop, which will not be planted until January. Mexico production is also lowered. 6
7 Global 2013/14 corn consumption is raised 5.5 million tons with foreign consumption up 3.0 million. Corn feeding is raised for Mexico, Russia, Ukraine, Egypt, India, Colombia, and Turkey. Industrial use is raised for Brazil, but a larger reduction for China leaves foreign food, seed, and industrial use lower, partly offsetting the global increase in feed use. World corn exports for 2013/14 are raised 7.7 million tons as lower prices are expected to boost demand. Corn imports are raised for Mexico as sorghum imports are reduced. Sorghum imports, however, are raised for China. Corn imports are also raised for Egypt, the European Union, Colombia, and Turkey; all driven by higher expected feeding. Corn imports are lowered for South Korea with an increase in wheat feeding. In addition to the increase in U.S. corn exports, 2013/14 exports are also raised for Brazil, the European Union, and Russia. Global corn ending stocks for 2013/14 are projected 12.9 million tons higher with most of the increase in China where consumption has been lowered for both 2012/13 and 2013/14. Corn stock changes elsewhere are mostly offsetting. SOYBEANS: Global oilseed production for 2013/14 is projected at a record million tons, up 4.3 million from September. Higher soybean, sunflowerseed, and rapeseed forecasts account for most of the change. Global soybean production is projected at million tons, up 1.9 million as the increase for the United States more than offsets reductions for India, Canada, Russia, and Ukraine. The India soybean crop is reduced 0.5 million tons to 11.8 million as excessive rainfall during much of the growing season reduced yield potential. Global sunflowerseed production is increased 1 million tons to a record 42.8 million on gains for Russia, European Union, and Moldova which are only partly offset by a reduction for Argentina. The increase for Russia reflects sharply higher yields reported in weekly harvest progress reports. Global rapeseed production is raised to a record 67.9 million tons reflecting gains for Canada, Ukraine, and the European Union. The increase for Canada is based on higher yields reported in the most recent survey from Statistics Canada. Almost ideal weather conditions throughout the growing season resulted in a projected record large crop despite the first decline in harvested area since Revisions to the world 2013/14 oilseed supply and demand estimates include reduced soybean exports and increased crush for Argentina and increased soybean exports for Brazil. Soybean crush is reduced for India and Russia on smaller supplies. Rapeseed exports are increased for Canada and Ukraine, while imports are raised for China. Global oilseed stocks for 2013/14 are reduced 0.5 million tons to 80.7 million. Soybeans account for most of the change, with reduced stocks in Brazil more than offsetting gains in Argentina and the United States. 7
8 WHEAT: Global 2013/14 wheat supplies are lowered 0.8 million tons as a decline in global output more than offsets higher beginning stocks, mostly in the European Union. European Union production for 2012/13 is revised higher and domestic consumption is estimated lower boosting 2013/14 beginning stocks. European Union production for 2013/14 is raised 0.4 million tons with small increases to reported crops in a number of member countries. Canada production is raised 1.7 million tons in line with official estimates. Global production, however, declines 2.6 million tons with production lowered 2.5 million tons for Russia, 1.5 million tons for Kazakhstan, and 1.0 million tons for Argentina. Reductions for Russia and Kazakhstan reflect late-season harvest reports for spring wheat. The reduction for Argentina is based on lower expected harvested area as dryness and late-season freeze events reduce prospects for a crop which will be harvested over the coming weeks. Global wheat consumption for 2013/14 is lowered 3.0 million tons with reductions in foreign feed and food use projected this month. Feed use is lowered for China, Russia, and the European Union, more than offsetting a small increase for South Korea. Food use is lowered for India, Russia, and the European Union. Global wheat trade, in the aggregate, is mostly unchanged this month with imports raised for several African countries and Mexico, but lowered for China, the European Union, and the Philippines. World exports decline slightly as reductions for Argentina, Kazakhstan, and Russia more than offset increases for Canada, the European Union, and India. World wheat stocks are projected 2.2 million tons higher with the biggest increases for the European Union, Canada, and Argentina. To see the full November 2013 WASDE report go to: After the reports were released Dave spoke with Mike Zuzolo of Global Commodity Analytics in Atchison, Kansas. THIS LINK IS NOW LIVE! Broadband MP3: Here are some of the key slides from the USDA Secretary lock-up briefing this morning (November 8) in Washington, D.C.: 8
9 9
10 10
11 11
12 12

13 13
14 AM-580 Daily Agricultural Programming Schedule Monday Friday (all times central) 8:49 a.m. $*Opening Commodity Market Report 8:52 a.m. - $Drew Lerner Agricultural Weather 9:49 a.m. $*Mid-Morning Commodity Market Report 10:59 a.m. Commodity Market Price Update 11:59 a.m. Commodity Market Price Update 12:58:30 p.m. *Midday Market Analysis with Sue Martin 2:06-2:36 p.m. $*Closing Market Report o o o o 2:11 Futures Analysis 2:20 - Agricultural News 2:25 - Cash Grain Analysis or Energy Analysis 2:32 Agricultural Weather Analysis Saturday 6:30 a.m. - $* Commodity Week 11:30 a.m. $*Commodity Week * Available on the website for on demand listening $ Available via podcast 14