BANGLADESH FOOD SECURITY MONITORING BULLETIN
|
|
|
- Marilynn Marshall
- 5 years ago
- Views:
Transcription
1 BANGLADESH FOOD SECURITY MONITORING BULLETIN Issue No.13 April-June 2013 Environmental Conditions Favourable weather conditions for Aus and Aman, Boro damaged (page 2) Economic Conditions Inflation & Remittances (page 2,3) Food Availability Crop Production, Food Import & Public Grain Stock (page 3,4,5) Food Price Monitoring Wholesale and Retail Prices (page 5,6,7) Terms of Trade (page 8,9) Impact of Shocks on Household Food Security Food Insecurity in Tropical Storm Mahasen Affected Areas (page 9) Food Security Outlook Food Grain Production, Trade & Price Prospect (page 10,11) Map ToT for Male & Female Agricultural Labourers May 2013 (page 12,13) HIGHLIGHTS The average retail price of coarse rice rose from Tk/kg (Aman HYV coarse rice) in January to 28.9 Tk/kg in June, which is 11 percent higher than a year ago. Although the average wholesale price of Boro HYV coarse rice came down in June, the price is still to reflect in the retail market. The average retail price of whole grain wheat flour (atta) in June was Tk/kg, which is still 13 percent higher than the price a year ago. The average retail price of palm oil has continued to decrease since August 2012 and stood at Tk/litre in June 2013, the lentil price is 3 percent higher than the average price a year ago. When compared to the high food prices of 2008, the retail prices of almost all essential food commodities are substantially lower, except for lentils in Dhaka sadar market and palm oil in Sylhet sadar market. The general inflation, measured by the point to point variation in the Consumer Price Index (CPI), stood at 7.97 percent in June compared to 8.56 percent a year ago (base year is 1995/96). The government succeeded to bring down the inflation rate to 7.7 percent which is almost at the level of its targeted inflation rate of 7.5 percent in FY 2012/13. In the current quarter both food inflation and non-food inflation increased by June. The remittance inflow in this quarter is slightly less than during the same period last year, mainly because of devaluation of the Taka versus the USD. In USD, the remittance inflow in this quarter is comparable to the same quarter in FY 2012/13 saw record inflow in remittances of USD 14.5 billion, which is 13 percent higher than in FY 2011/12. According to the BBS, the estimated Aus, Aman and wheat production in FY 2012/13 are 2.2 million MT, 12.8 million MT and 1.26 million MT respectively which are short of the target set for the FY. However, the Aman production is considered to be good despite losses caused by less than optimal monsoon rainfalls and flash floods. Production of Aus crop is estimated to be 7.5 percent less than the previous harvest due to reduction in cultivation area of similar percentage. The opening public stock of food grain for the FY 2012/13 is 0.96 million MT which is 21 percent less than last year. The public food grain import target for FY 2013/14 is 1.25 million MT, comprising 0.26 million MT rice and 0.99 million MT wheat. The import target is 34 percent less than last FY s target. Rice distribution through Open Market Sales (OMS) programme in FY 2012/13 was particularly low (0.05 million MT) compared to 0.23 million MT in the previous FY. The coastal districts of Barguna, Patuakhali and Bhola were hit by the tropical storm Mahasen on 16 May The Joint Needs Assessment (JNA) in the affected areas reported 75 percent of the households food insecure with women especially vulnerable. In the saline soil Southern coastal region, the period from end April to May is considered to be lean season. In addition due to tropical storm Mahasen and continuous rainfall in May in different districts in Barisal division, the number of agricultural work days was low. Based on wage data collected by BBS in May 2013, the average rice purchasing capacity of a male agricultural day labourer was kg of rice with his average daily income of 311 Taka, which is slightly less than the ToT (11.4 kg/day) a year ago. Compared to May 2012, although wage rate increased by 2 percent, it was offset by the 5 percent increase in average rice price. The ToT is generally highest in May when the wage rate is high due to harvesting of Boro and at the same time rice prices come down after Boro harvest. In May the average wage for a female labourer was only 236 Taka/day whereas for a male labourer it was Taka/day - a difference of 75 Taka/day. The difference in wage rates is highest during May, the peak labour season.

2 ENVIRONMENTAL CONDITIONS Favourable weather for Aus and Aman planting and growing, Boro damaged by heavy rainfall following Mahasen The country did not experience any early flash floods in March-April, which could have damaged the Boro paddy especially in the north-eastern Haor districts. However, tracts of standing Boro paddy were damaged by the tropical storm Mahasen which hit the Southern coastal belt in mid-may, followed by heavy rainfall for a week. The country wide rainfall in May was 91.7 percent above normal and in June it was 13 percent less than normal, as confirmed by the Bangladesh Meteorological Department. The high rainfall data of May is mainly due to days of heavy rainfall caused before and after the tropical storm Mahasen. Rain water is very much needed for the rain-fed crops. Due to the absence of flash floods as well as early monsoon floods, along with moderate levels of pre-monsoon and monsoon rainfall, the Aus and Aman crops are expected to be satisfactory provided there is no late flooding this year. ECONOMIC CONDITIONS INFLATION AND REMITTANCES The general inflation, measured by the point to point variation in the Consumer Price Index (CPI), stood at 7.97 percent in June compared to 8.56 percent a year ago (inflation base year is 1995/96). The government targeted to bring down the average inflation rate to 7.5 percent in FY 2012/13 and it could attain an average inflation of 7.7 percent which is very close to the target. The central bank s inflation curbing monetary policy, weak domestic demand due to unfavourable domestic climate and low food commodity prices during the first half of the year, contributed to lowering of the inflation. However the second half of the fiscal year saw general inflation rising compared to the first half. General inflation rose from 7.38 percent in January to 7.97 percent in June. Inflation Rate (%) April-June 2013 General Food Non-Food Food-Rural Food-Urban April May June Base year: 1995/96 Source: BBS The falling general inflation rate in the first half of the fiscal year was mostly attributed to the declining food inflation as a result of the decrease in prices of essential food items (particularly rice as a result of good harvest and sufficient government opening stock). Frequent supply disruptions due to hartals and rise in transport fares due to a fuel price hike in January were the main reasons behind rise in food prices, especially rice, in the second half of the fiscal year. Rise in domestic price of wheat as a result of the increase in international market prices also contributed to increasing food inflation. Yet in FY 2012/13 average food inflation (7.3 percent) was much lower compared to that of FY 2011/12 (10.5 percent). Although (since August 2011) urban food inflation continues to be higher than rural food inflation, rural food inflation is fast approaching urban inflation figures. Month-to-month rural food inflation increased faster than - 2 -
3 urban food inflation in FY 2012/13. Rural inflation increased 2.35 percentage points from July 2012 to June 2013 while for urban inflation the increase was 1.93 percentage points. Unlike food inflation, non-food inflation declined over FY 2012/13 (from percent in July 2012 to 6.99 percent in June 2013).However in the current quarter it rose from 6.79 percent in March to 6.99 percent in June. FY 2012/13 saw a record inflow in remittances in USD 14.5 billion (equivalent to Taka 1156 billion), which is 13 percent higher than in FY 2011/12. Meanwhile in the current quarter remittance inflow (both in current Taka and constant Taka of the year 2000) is 11 percent less than the previous quarter. Compared to the same period last year the remittance inflow is 4 percent less (in current Taka). This is because of the strengthening of Taka versus USD as the inflow in USD is actually comparable in this quarter to the same quarter in The values in the graph are adjusted for inflation and are in constant Taka of the year Average annual growth of remittance inflows (in USD) from FY 2001/02 to FY 2008/09 was 22 percent and in the past four fiscal years the average growth was 11 percent, which is considered to be robust. According to the Refugee and Migratory Movement Research Unit (RMMRU), a Bangladeshi think-tank, the strong remittance inflow observed in FY 2008/09 and the first half of FY 2009/10 can be attributed to the record increase in outflow of workers in 2007/08. Another explanatory factor is the increased use of formal banking channels and money transfer companies during that period to send money home, rather than resorting to illegal hundi channels (The Financial Express, 6 July 2009). Yet another explanatory factor for the recent decrease in annual growth of remittance inflow compared to the FY 2001/ /09 period is the base effect, meaning the base for calculation of annual growth is much larger now, thus returning a slower growth rate. The Minister of Finance quoted in his budget speech for FY 2013/14 (page 18) that currently, about 36,000 Bangladeshi female workers get overseas employment in different professions every year and the signing of memoranda of understanding with Malaysia and Bahrain and the interests shown by Hong Kong and Jordan to recruit female workers are expected to boost further the flow of remittance in future. It is expected that growth of remittance inflows will be 15 percent in FY 2013/14. FOOD AVAILABILITY CROP PRODUCTION, FOOD IMPORT AND PUBLIC GRAIN STOCK Domestic food grain production The total rice production for FY 2011/12 was estimated at million MT which is 1 percent more than the previous year s production. For FY 2012/13, the DAE set Aus, Aman, Boro and wheat production targets at 2.37 million MT, 13.3 million MT, million MT (revised) and 1.03 million MT respectively (FPMU, FSR 90). According to the BBS, the estimated Aman, Aus and wheat production in FY 2012/13 are 12.8 million MT, 2.2 million MT and 1.26 million MT respectively

4 The Aman production is considered to be good despite falling short of target due to losses caused by less than optimal monsoon rainfalls and flash floods (in the northwest). Both yield and area coverage of the Aman crop has increased by less than 1 percent compared to last year. The cultivation of broadcast Aman and local transplant Aman has decreased and the area of HYV Aman increased remarkably this year as compared to the previous year. Production of Aus crop is estimated to be 7.5 percent less than the previous harvest due to reduction in cultivation area of similar percentage. Government food grain procurement, import and public stock situation Food grain stock: The opening public stock of food grain for the FY 2012/13 is 0.96 million MT which is 21 percent less than last year. Import arrival, domestic Boro rice procurement contributed to the higher stock position during the first quarter of FY 2012/13, but relatively higher public distribution and lower procurement during the second half contributed to lower stocks. As of 2 July 2013 the government stock of rice was 0.72 million MT (26 percent less than one year ago) and wheat were 0.24 million MT (4 percent more than a year ago) (Ministry of Food). Food grain imports: For FY 2012/13, the target for food grain import was set at 2.24 million MT of which 0.04 million MT would be rice and 2.20 million MT of wheat. The cumulative food grain import in FY 2012/13 is 1.9 million MT which is 18 percent less than FY 2011/12. Of the total food grain import, rice was minimal (0.03 million MT) and the rest was wheat (1.85 million MT which is 4 percent more than the total wheat import in the FY 2011/12). Rice import was minimal due to a good opening stock and satisfactory harvest. Of the 1.85 million MT of imported wheat, 75 percent was imported by the private sector compared to 25 percent by the government. Imports dropped in the first half of the fiscal year following high prices in the international market. In FY 2013/14 budget proposal, the government has planned to make public food grain import of 1.25 million MT, comprising 0.26 million MT rice and 0.99 million MT wheat. The import target is 34 percent lower than the last FY s target. Food grain procurement: The government set the food grain procurement target for FY 2012/13 at 1.6 million MT. Total procurement was 1.40 million MT, of which rice was 1.27 million MT and wheat was 0.13 million MT (FPMU, FSR 93). Aman rice procurement by the government started on 9 December, 2012 at 26 Tk/kg for parboiled rice and 25 Tk/kg for white (atop) rice with a target of procuring 0.30 million MT of Aman rice by the end of February The procurement duration was later extended up until 28 March. The total Aman procurement was 0.27 million MT
5 Boro procurement started from 01 May with a target of 1.0 million MT at 29 Tk/kg. The procurement drive will continue upto 30 September (Ministry of Food). Wheat procurement started on 01 April, 2013 at 25 Tk/kg with a target of 0.15 million MT. The procurement was completed on 30 June 2013 with 0.13 million MT wheat (Ministry of Food). Food grain distribution: The total distribution in FY 2012/13 was 2.02 million MT (Ministry of Food) against the targeted distribution of 2.77 million MT (FPMU, FSR 92). It is close to the previous FY s total distribution of 2.01 million MT. In the current fiscal year the percentage share of rice distribution through monetized channels has decreased from 60 percent (during the same period in 2011/12) to 35 percent while the percentage share of wheat distribution through monetized channels has increased. The reverse applies for the percentage share of distribution through non-monetized channels. The Food for Work (FFW) Programme constituted the largest share among distribution channels followed by Test Relief (TR) and Open Market Sale (OMS). Rice distribution through OMS was 0.05 million MT compared to 0.28 million MT in the previous fiscal year. The Finance Minister quoted in his speech for budget FY 2013/14 that the demand for food under the OMS programme had substantially reduced due to the government s success in maintaining food price stability. The government started selling wheat and rice at the divisional cities and labour-intensive areas in the country as part of its Open Market Sale (OMS) Programme from 18 March. Rice was sold at 24 Tk/kg and whole grain wheat flour (atta) at 20 Tk/kg. FOOD PRICE MONITORING Nominal WHOLESALE and Real AND Wholesale RETAIL PRICES Prices of & Rice TERMS and OF Wheat TRADE in Bangladesh The countrywide average wholesale nominal price of rice (in Taka/quintal) in the current quarter has increased by 4 percent compared to the previous quarter. Both the average wholesale nominal price and the real price of coarse rice in Dhaka division increased in the current quarter by 9 percent and it is significantly higher than in the corresponding quarter of last year. Although the nominal wholesale price of rice remains higher than in pre-2008 shock years, the real wholesale price of rice is less compared to the same period. Average whole sale price of rice & wheat (Tk/Quintal); Dhaka Division Time Period Rice Wheat Nominal Price Real Price Nominal Price Real Price Apr-June ' Previous Quarter (Jan-Mar'13) Previous Year (Apr-June '12) Pre-shock Years (Apr-June'07) Shock Period (Mar-May '08) * Data for wholesale price of rice in Dhaka division in April 2013 was unavailable. Source:DAM In general rice prices peak during February-March (which is the period between the end of Aman harvest and beginning of Boro harvest) and come down in May-June after the Boro harvest. Prices did not decrease this season as quickly as expected. However average Boro HYV coarse rice prices have come down more recently in June (by 3 percent countrywide and by 11 percent in Dhaka division compared to prices in May). The wholesale prices of wheat (in Tk/quintal) in Dhaka Sadar dropped in the current quarter after continuing to move upwards since June 2012 (dropping slightly in December and January). Average wholesale nominal price and real price were 4 percent less than the previous quarter and are significantly lower (10 percent in nominal terms and 40 percent in real terms) than the prices of the 2008 shock year.however prices are still significantly higher than in the corresponding quarter of last year
6 International wholesale prices of rice and wheat Compared to both the previous quarter and the corresponding quarter of last year, in the current quarter, the average wholesale price (in USD/MT) of coarse rice in Dhaka division and in Kolkata (India) increased while in Thailand the price of 5% broken rice decreased marginally. For all three, prices were staggeringly higher than pre-2008 shock years. The monthly wholesale prices of rice both in Dhaka division and in Kolkata have increased from April to May before dropping in June (in local currencies). By contrast the wholesale price of Thai 5% broken rice has decreased throughout the quarter. The average wholesale prices of Kolkata coarse rice, Dhaka coarse rice and Thai 5% broken rice in June were 394 USD/MT, 339 USD/MT and 552 USD/MT respectively. Following the announcement by the Thai government to sell 70,000 MT of rice from the government pledged stock, rice prices in Thailand started declining from March. The Thai government is attempting gradually to sell pledged rice stocks at a lower price than it had bought from the farmers. Thailand s announcement on 18 June of a 20 percent cut in the official procurement price under the rice pledging programme, although it was revoked later, also contributed to depressing the Thai rice quotations (FAO Crop Prospects and Food Situation Report July 2013). The decline in the price is also partly a reflection of the Baht depreciation against the US dollar. In the current quarter, the average wholesale price of wheat both in Dhaka Sadar and in the Gulf of Mexico decreased by 3 percent and 2 percent compared to the previous quarter. Although the wholesale price of wheat in the Gulf of Mexico has been decreasing after soaring during June-November 2012, prices are still significantly higher than during the previous year. The average wholesale price of wheat in the Gulf of Mexico in the current quarter is 17 percent higher than in the same period of last year and the figure is even 32 percent for Dhaka Sadar. Prices came down for Dhaka Sadar only recently in the current quarter after having soared with the international prices last year. The average wholesale price of wheat in Dhaka in June was 368 USD/MT and in the Gulf of Mexico it was 314 USD/MT. Retail prices for essential food commodities When compared to the high food prices of 2008, the retail prices of almost all essential food commodities are now substantially lower. However, the average retail price of coarse rice has increased by 2 percent from last quarter and it is 8 percent higher than in the corresponding quarter of last year Retail prices of essential food commodities (Tk/kg); Dhaka Sadar Market April'13 May'13 June'13 Peak 2008 Coarse Rice Wheat flour (atta) Palm Oil Lentil (masur)
7 The retail price of coarse rice started to increase from November 2012 following the increase in the wholesale price of rice. Although the average wholesale price of Boro HYV coarse rice came down in June, this has not translated into a reduction of the retail price. The average retail price of coarse rice rose from Tk/kg (Aman HYV coarse rice) in January to 28.9 Tk/kg in June, which is 11 percent higher than a year ago. In Dhaka Sadar market, the retail price of HYV coarse rice increased throughout the quarter. The retail price of whole grain wheat flour, which had been increasing from August 2012 to March 2013 following increases in the price of wheat in the domestic wholesale market, came down slightly in the current quarter. The average retail price of whole grain wheat flour (atta) in June was 37.4 Tk/kg, which is still 13 percent higher than the price a year ago. However both the wholesale market and retail market prices are still to show any stable decreasing trend. Lentil (masur) The average retail price of palm oil has continued to decrease from Tk/litre in August 2012 to 80.1 Tk/litre in June In Dhaka Sadar market the price has come down significantly by 6 percent compared to the last quarter and stood at 81 Tk/litre in March. Prices had peaked during April-May 2012 to 107 Tk/L crossing the peak price in shock year Although the average price of lentils (masur) decreased by 2 percent from March to April, it increased afterwards throughout the quarter and stood at 84.7 Tk/kg which is 3 percent higher than the average price in June Last year prices hiked up during the month of Ramadan (July-August 2012) and kept moving upwards or remained steady till February In Dhaka Sadar market, it crossed the 2008 peak price back in May 2012 and despite decreasing throughout the current quarter remains significantly higher (16 percent) than the 2008 peak price. There are divisional variations in the prices of these essential food commodities. Compared to the 2008 peak prices the highest decrease in the prices of rice has been reported in Sylhet Sadar market (by 22 percent) and the lowest in Rajshahi Sadar market (by 8 percent).the nominal retail price of rice is also lowest in Sylhet (26.5 Tk/kg) among all the divisional Sadar markets. Lentil retail prices in all divisions except in Dhaka Sadar market are 7 to 11 percent lower than the 2008 peak prices. Throughout all divisional Sadar markets, the price of wheat flour in the current quarter is percent less than the 2008 peak price. The retail price of palm oil in Sylhet Sadar market had been increasing since March 2009 (57 Tk/litre) and crossed the 2008 peak price (88 Tk/litre) in February Prices came down lower than the 2008 peak price for a brief period during January and February. In the current quarter although the average price in Sylhet division remains lower than the 2008 peak price, in the Sylhet Sadar market price has shot up again. It was 90 Tk/litre in June, 2 percent higher than the 2008 peak price. Retail cost of basic food basket The cost of this basket is calculated based on the prices of essential food items like rice, wheat flour, edible oil and lentils and the average daily consumption (Source: Household Income and Expenditure Survey 2010, BBS) of these items by a typical 5-member household. The average daily household food basket cost in Dhaka Sadar during April-June was Taka While prices of rice, % Change of Retail Prices (National Average) of Apr- June'13 compared to- Commodities Last Quarter Jan-Mar'13 Last Year Apr-June' (high food price peak periods) Coarse Rice Wheat Flour (atta) Palm Oil
 of agricultural day labourers, the ratio between the daily wage of agricultural labourers and the")
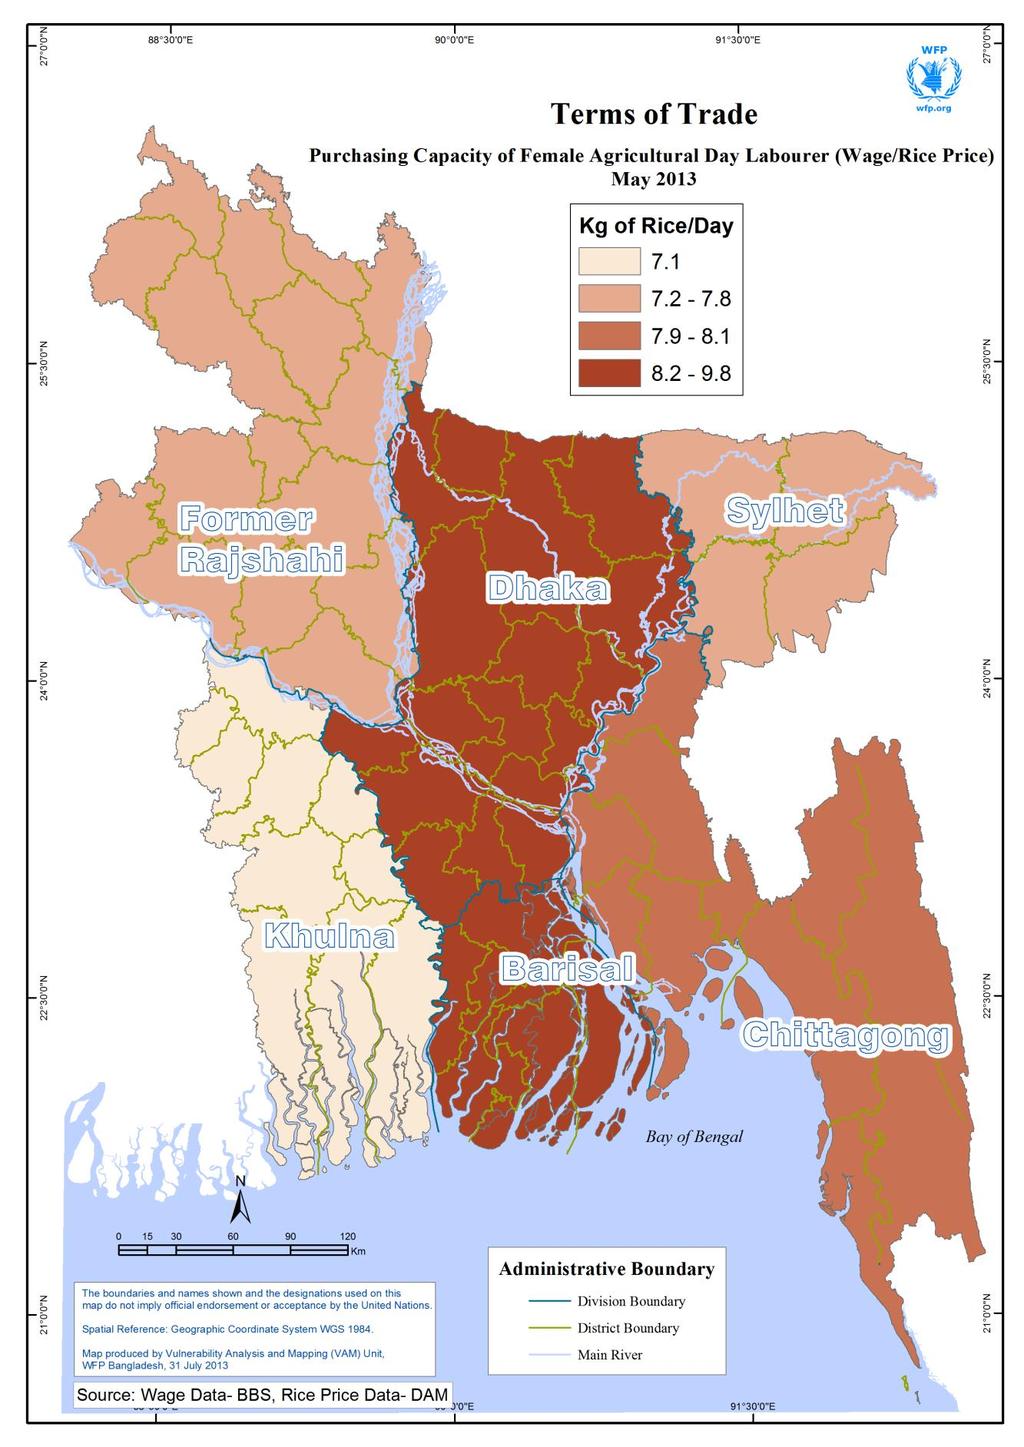
8 palm oil and whole wheat flour in the current quarter are lower than in 2008; the average price of lentils is 108 Tk/kg while it was 84 Tk/kg during the same period in Terms of Trade/ Food purchasing capacity of agricultural day labourers The Terms of Trade (ToT) of agricultural day labourers, the ratio between the daily wage of agricultural labourers and the average retail price of rice in the market, is used to assess the food purchasing capacity of impoverished households. It is an indicator of the quantity of essential food items that an agricultural day labourer can buy with his/her daily income. The latest available wage data from BBS is of May WFP collects wage data from a selection of farmers and labourers and interviews with upazila agricultural officers in Barisal, Khulna and Rajshahi (old Rajshahi division including districts from current Rangpur division) divisions. To create a time series of national agricultural day labour (male and female) rates and the daily purchasing capacity up to June 2013, the wage data collected by WFP was used for the month of June However, the estimated national average based on wage data collected by WFP is an average of wage data from only 3 divisions- Barisal and Khulna in the south and Rajshahi in the north. It cannot be presented as statistically valid data, but provides an indication of the wage trend. There is a significant difference between the agricultural daily wages for male and female labourers. In May the average wage for a female labourer was only 236 Taka/day whereas for a male labourer it was 311 Taka/day a difference of 75 Taka/day. Households depending on a female wage labour are therefore highly disadvantaged and remain most impoverished. Trend analysis of the agricultural wage data of male and female labourers in the past three years show that on average female labourers receive a wage 25 to 40 percent less than their male counterpart; the difference is highest during the Boro harvest season in May. The wage gap was particularly high in This gap was an average of 79 Taka/day for the period of January-May 2012, However on a postive note it was 68 Taka/day for the same period a year later in a reduction of 14 percent in the wage gap. The average wage rate for a female labourer in the month of May 2013 (236 Taka/day) is the highest monthly average for female labourers recorded by BBS. The ToT for a female labourer in May of - 8 -
9 shock year 2008 and May 2013 was respectively 3.27 kg/day and 8.4 kg/day-which is more than double compared to the shock year. The average rice purchasing capacity followed the usual trend of decreasing during the lean periods of February-March and increasing from April. In May, the average rice purchasing capacity for a male agricultural day labourer was kg of rice with his average daily income of 311 Taka, which is slightly less than the ToT (11.4 kg/day) a year ago. Compared to May 2012, although wage rate increased by 2 percent, it was offset by the 5 percent increase in average rice price. The daily ToT of a male agricultural wage labourer was only 4.55 kg/day in May of the high price shock year 2008, indicating that the rice purchasing capacity has more than doubled since then. The ToT is generally highest in May when wage rate is high due to harvesting of Boro and planting of Aman and at the same time rice prices come down after Boro harvest. The ToT also varies among divisions. There is a significant regional difference in the monthly rice purchasing capacity (measured by multiplying the daily ToT with the average number of work days per month in the region). Usually the purchasing capacity in the southern region (especially in Barisal division) is higher than in the northern region because of a higher wage rate. However agricultural work opportunities are lower in the southern coastal region during Boro harvest season. Boro is cultivated in most growing areas except for the saline soil coastal zone. Therefore in the coastal region, the period from end April to May is considered to be lean season. In addition due to tropical storm Mahasen and continuous rainfall in May in different districts in Barisal division, the number of agricultural work days was low. In April the monthly rice based ToT were reported to be highest in Khulna division (215 kg) followed by Barisal division (170 kg) and Rajshahi division (154 kg). With the rice prices being the same in Rajshahi and Khulna divisions, this difference is mainly due to the difference in divisional wage rates and better work opportunities related to shrimp cultivation in Khulna division during April, which is the shrimp gher preparation month. Despite daily ToTs comparable to the northern Rajshahi division, the scenario for monthly ToT in southern region changed in May-June, due to lower monthly work opportunities. IMPACT OF SHOCKS ON HOUSEHOLD FOOD SECURITY FOOD INSECURITY IN TROPICAL STORM MAHASEN AFFECTED AREAS The coastal region of Bangladesh was hit by tropical storm Mahasen on May 16, Following a Phase 1 Joint Needs Assessment (JNA), the Food Security Cluster (FSC) along with Nutrition Cluster carried out a detailed assessment on food security, nutrition and agriculture in the three worst affected districts-barguna, Bhola and Patuakhali. Major findings of the assessment are: Livelihoods worst affected: Day labourers, marginal farmers and the fishing community especially those involved in aquaculture were identified as worst affected livelihoods. Of the total number of households with poor food consumption nearly 60 percent depended on day labour and 30 percent of the households on fishing and aquaculture. Food Security: Food consumption of the affected population reduced significantly. Diet diversity and frequency were critical in the affected areas with 75 percent of the households having poor and borderline food consumption. Nearly 80 percent of the women were consuming less than three food groups
10 Nutrition: No major disease outbreaks have been reported. It was the pregnant and lactating women (PLW) who were suffering most after the tropical storm. Over 80 percent of the pregnant and lactating women were consuming an inadequate diet. Agriculture: A substantial amount of Rabi/winter cash crops awaiting harvest were damaged posing critical income loss for the marginal farmers as well as for the agricultural day labourers. The next harvest season starts in November; until then income opportunities in the affected areas are very limited. Moreover, in the coming Aman planting season in June-August the marginal farmers are unlikely to cultivate to their full capacity due to lack of sufficient capital resulting from crop damage in the current season. This also has direct impact on the wages of agricultural day labourers. Coping: Livelihoods that are worst affected like day labourers both agriculture and non-agriculture and marginal farmers are mostly spending their savings and take credits to purchase food. About 76 percent of those who are taking loans are borrowing for food only. There is reporting of increased debt which is likely to place the households in higher debts difficult to recover from. Area and people in need of assistance and priority needs: Out of 194 unions in three affected districts, 96 unions were identified as worst affected by the local representatives and government officials. In these 96 unions 43,000 households have been estimated to be most vulnerable and severely affected and would need external assistance to overcome the shock. Communities identified food is their immediate need, followed by house repairing materials, cash and work opportunities. Thus, wage labour opportunity is another major need for the affected communities. Government Response: According to the Situation Report May 2013 by the Disaster Management Information Center (DMIC), a total of 2500 MT of Government Relief Rice and and Taka 11.3 million of Government Relief Cash were allocated from the Department of Disaster Management (DDM) to the District Administration for victims of Mahasen in 13 districts. For details on methodology, findings and recommendations, the full report is available at FOOD SECURITY OUTLOOK FOOD GRAIN PRODUCTION, IMPORT, EXPORT AND PRICE PROSPECT Global The FAO Food Price Index is a composite of five food groupings: meat, dairy, cereals, oils and fats and sugar. According to FAO s July report on the Food Price Index, the index averaged points in June The Food Price Index figures of June 2013 are still higher (by nearly 11 points) than the figures in corresponding month last year. The Food Price Index went up in April before falling consecutively in May and June. The increase in April was mainly due to a spike in dairy prices because of a pause in milk production in New Zealand, the world s largest producer. The decline in June was backed by large drops in prices of sugar and dairy products and contained decreases in cereals and oils. The FAO Cereal Price Index was unstable in the current quarter- dropping in April and increasing in May before dropping again in June. Maize prices increased slightly in June and rice prices were generally stable. The decline in Cereal Price Index in June was mainly due to slight decline in wheat prices followed by the onset of winter crop harvests in the northern hemisphere and expectations of large supplies. The Cereal Price Index averaged points in June, which is still 14 points above June last year. For 2013/14 FAO forecasts a significant 7.2 percent increase in world cereal production to a new record level (2.479 billion MT) and the world cereal utilization is estimated to be billion MT. The cereal utilization is expected to be 3.4 percent higher from the 2012/13 estimated level, most of which is due to increase in feed use (Crop Prospects and Food Situation Report July 2013)

11 FAO forecasts record levels (704 million MT) of world wheat outputs in 2013/14 which is an increase of 6.8 percent from the previous year s production. The record wheat output is expected to replenish last year s drought induced reduction in output which consequently saw price hikes in wheat and wheat flour. Bangladesh The price of rice remained relatively low and stable throughout 2012, but has increased since the beginning of Despite the Boro harvest which started in mid-april, the retail price of rice is yet to come down significantly. If the prices continue to be high, the government may have to extend its OMS programme. The government s inflation target of 7 percent for FY 2013/14 will largely rest on containing food inflation, which in turn is dependent on the price of rice. The stability of rice prices is relies on satisfactory domestic production, increased storage capacity, stable fuel prices, non-disruption of supply and food prices in the international market. With the completion of the construction of silos and multistoried warehouses, government s food storage capacity is expected to be enhanced to 2 million MT by FY The government aims to raise the storage capacity of its silos up to 2.2 million MT by 2015 For the agricultural cycle of May 2013-April 2014, the United States Department of Agriculture (USDA) in its Annual Update of Grain and Feed for Bangladesh forecasted rice production to expand to 34.2 million MT and rice consumption to 34.7 million MT. The Boro harvest is forecasted to be lower than last year due to reduction in acreage and damage due to Mahasen (The Financial Express, 30 June 2013).The USDA forecasted Bangladesh rice imports to reach 0.38 million MT during the same cycle, almost all of which is likely to take place through the private sector. Despite the increase in forecasted imports, it remains a very small share of the total consumption. According to the USDA, with the population growing by 1.8 million per year, Bangladesh currently needs to produce approximately an additional 300,000 MT of rice a year. Bangladesh, Cambodia, China, India, Indonesia, Nigeria, and Vietnam account for most of the projected increase in global rice consumption in 2013/14 (Rice Outlook May 2013, USDA). References: Bangladesh Bank, Central Bank of Bangladesh, Bangladesh Bureau of Statistics, Department of Agricultural Marketing/DAM, Ministry of Agriculture, FAO Crops Prospects and Food Situation Report, July 2013, FAO Food Price Index, July 2013, Food Planning and Monitoring Unit (FPMU), Ministry of Food, Food Situation Report 90, 92 and 93, Financial Express, July 2009 & June 2013, Index Mundi Website, India Department of Consumer Affairs, Ministry of Consumer Affairs, Food and Public Distribution, Ministry of Finance, Budget Speech , Ministry of Food, US Department of Agriculture (USDA), Rice Outlook May 2013, The Bangladesh Food Security Monitoring Bulletin is prepared by the Vulnerability Analysis and Mapping (VAM) unit of the World Food Programme (WFP) and published by the WFP Bangladesh Country Office. It is published four times a year and focuses on developments affecting food security in Bangladesh. This issue is based on data available up to early-june 2013 and covers the quarter of April to June BFSM bulletins are available on the internet at the following URL address: The bulletins can be received by subscription upon request. For comments or queries, please contact nusha.choudhury@wfp.org (Head, VAM Unit, WFP Bangladesh) or kayenat.kabir@wfp.org (Senior Programme Officer, VAM Unit, WFP Bangladesh)
12 - 12 -
13 - 13 -