Tools and Methodologies in Agrometeorology
|
|
|
- Edwin May
- 5 years ago
- Views:
Transcription
1 Tools and Methodologies in Agrometeorology Adrian R. Trotman Caribbean Institute for Meteorology and Hydrology October, Nairobi, Kenya
2 Outline Statistical Analysis Evapotranspiration, Soil Water Balance and Irrigation Estimation Growing Seasons Rainfall Monitoring and Forecasting Crop Simulation Land Evaluation
3 Statistical Analysis
4 For agroclimatic studies/maps simple and more complicated Instat Genstat Excel Sigmastat Systat SPSS Combined with GIS can map output
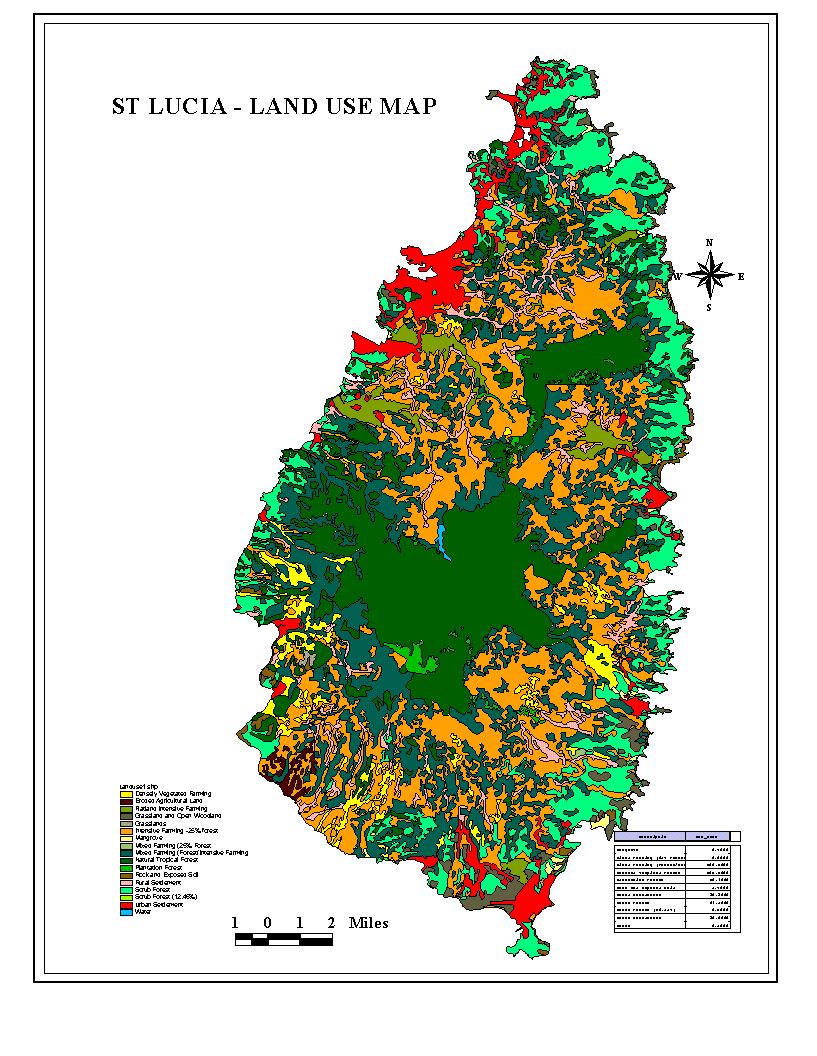
5 Agroclimatic maps for examples using Arcview Rainfall totals Dry spells/drought Probabilities Percentiles Potential flood rains Extreme value analysis/return periods

6
7 Evapotranspiration, Soil Water Balance and Irrigation Estimation
8 Potential water loss using Penman- Monteith Potential water loss using evaporation pan Combined with rainfall, runoff and drainage gives water storage change Irrigation estimation Box : Water Balance Equation and its parameters P = Q + D+E + S Where: P Q D E S precipitation received runoff (influenced by the slope of the land) drainage evaporation change in water storage in the soil
9 Software Instat Cropwat WINISAREG, SIMDualKc Excel
10 The Windows version of the model used in this study, WINISAREG (Pereira et al., 2003), includes programs for ETo computation and crop parameterization following the FAO methodology described by Allen et al. (1998). It also includes an algorithm to consider soil salinity impacts on ETc and yield (Pereira et al., 2007) and parametric functions for computation of the groundwater contribution and percolation (Liu et al., 2006). The water stress impacts on crop yields are evaluated by estimating the relative yield losses as a function of the relative evapotranspiration deficit through the water yield response factor Ky (Stewart et al., 1977).
11 SIMDualKc, A Software Tool for Water Balance Simulation Based on Dual Crop Coefficient Published by the American Society of Agricultural and Biological Engineers, St. Joseph, Michigan Citation: Computers in Agriculture and Natural Resources, 4th World Congress Conference, Proceedings of the July 2006 (Orlando, Florida USA) Publication Date 24 July P0606. Authors: João Rolim, Pedro Godinho, Bruno Sequeira, Ricardo Rosa, Paula Paredes and Luis Santos Pereira Keywords: simulation models, irrigation scheduling, dual crop coefficients, soil water balance, crop evapotranspiration
12 SIMDualKc is a software application for soil water balance simulation, based on the dual crop coefficient (Kcb + Ke). The main goal of this software is to develop a tool to compute crop water requirements, particularly focused on vegetables and orchards, which have high irrigation frequencies and have a fraction of the ground surface with bare soil during the irrigation season. This model was developed either to operate alone carrying out all the computational procedures or to be integrated with other irrigation scheduling models, such as WINSAREG for the adoption of the dual Kc approach. In addition, this model can also be used to real-time irrigation scheduling, for assessing the evolution of the soil water content. The SIMDualKc model was developed using a three tiers architecture approach. Thus, three different components were built: a graphic user interface (GUI), a mathematical model and a database. The computational module was built to enable an easy integration with the WINISAREG model or to be operated alone through the GUI. This feature was achieved using two abstract interfaces: one that links the computation module with the GUI or with a selected model; the other to perform the connection with the different databases using queries. The data structure of this model, clearly separating the algorithm procedures from the database, enables the connection of this application to different databases, including a georeferenced database (GIS). This model was validated for the irrigation project of Fergana valley, Uzbequistan, showing a good adherence of model results to field observations.
13 Growing Seasons
14 Based on Rainfall Rainfall and evapotranspiration Soil moisture content Can be general (for a number of crops averaged) For a specific crop
15 Start of crop growing season for Barbados
16 End of the growing season of C. chinense West Indies Red. Values are of month/date
17 Rainfall Monitoring and Forecasting
18 Using a number of rainfall/soil moisture indices Standardised Precipitation Index (SPI) Palmer Drought Severity Index (PDSI Crop Monitoring Index (CMI) Percent of Normal Deciles
19 PDSI and CMI Developed by W.C.Palmer (1965) Measures degree of dryness or Applicable to agriculture Precipitation Temperature Thornwaite s Evapotranspiration. Available Water Capacity (AWC) 1 National Agricultural Decision Support System (
20 Classifications 4.0 or more Extremely wet -0.5 to Incipient dry spell 3.0 to 3.99 Very wet -1.0 to Mild drought PDSI 2.0 to to 1.99 Moderately wet Slightly wet -2.0 to to Moderate drought Severe drought 0.5 to 0.99 Incipient wet spell -4.0 or less Extreme drought 0.49 to Near normal +3.0 and above Excessively Wet 2.0 to 2.9 Wet CMI 1.0 to to to to or Less Abnormally Moist Slightly Dry /Favourably Moist Abnormally Dry Excessively Dry Severely dry
21 SPI Values and precipitation intensities (Mckee et al 1993) SPI Category Probability (%) to to 1.49 Extremely wet Very wet Moderately wet to to Near normal Moderately dry to and less Severely dry Extremely dry
22 Caribbean Drought and Precipitation Monitoring Network (CDPMN)
23 Precipitation status monitored using a number of indices Standardized Precipitation Index; Palmer Drought Severity Index; Crop Moisture Index Other indicators (e.g. water levels, state of vegetation and ecosystems) Final precipitation status determined, by consensus, by a network of persons from different sectors, institutions and communities embracing the diversity in definitions and impacts of drought Short term and seasonal precipitation forecasts to provide a projection of future drought (1-6 months)


24 SPI for the Caribbean 1-, 3- and 6 - month SPI for the Caribbean for October 2007 CIMH

25 PDSI on Agricultural Drought in Barbados Mean PDSI values for April and October CIMH
26 PDSI on Agricultural Drought in Barbados PDSI values for April and October 1998 (an El Niño year) CIMH
27 CMI Appropriate for Agricultural Drought? W Bal (x0.1) CMI Soil M Time series of agricultural drought indicators from January 2005 to June CIMH

28
 Mile Gully/ Warwick Castle (Jamaica) The CDPMN will afford an opportunity for a participatory process, between CIMH, national and local governments and pilot")
29 Monitoring stations One hydrological and meteorological monitoring station will be installed in each partner country The pilot communities for the three countries are Great River (Grenada) St. Cuthbert s Amerindian mission (Guyana) Mile Gully/ Warwick Castle (Jamaica) The CDPMN will afford an opportunity for a participatory process, between CIMH, national and local governments and pilot communities, to propose new community water strategies which consider the extremes of drought and flood for water resource management

30 Outcomes of the CDPMN 1. Through the hydrometric stations and sensor data, monitor hydrological indicators, climate indicators Projection of future status (using precipitation forecasts and drought indices 3. Early warning information through CIMH website and networking with key agencies, governments 4. Build adaptation and response strategies to drought and flooding events collaboration with a network of communities, researchers and decision makers

31 Drought and Flood Planning Data collection, monitoring and dissemination Integrating climate indices and other indicators into routine decision making processes Determining existing needs, scientific knowledge gaps Forecasting, predicting, strengthening infrastructure Establish monitoring systems and early warning systems Information can then be used by decision makers at community level and national level to improve livelihoods All toward MANAGING RISK
32 Crop Simulation Models
33 Introduced mainly for climate change impact and vulnerability studies DSSAT work done by Agricultural Researchers in Guyana being completed Wofost part of the training in the Caribbean through the CCCCC APSIM not yet introduced in the Caribbean

34
35 Land Evaluation
36 ALES Automated Land Evaluation System is a computer program that allows land evaluators to build expert systems to evaluate land according to the method presented in the FAO Framework on Land Evaluation:
37 Methodological Framework BIOPHYSICAL FACTORS SOCIOECONOMIC FACTORS Socio cultural factors SOIL WATER VEGETATION OTHERS POPULATION CHARACTERISTICS ACCESS TO SERVICES, INFRASTRUCTURE, CREDIT, ETC. PRODUCTION SYSTEM NATURAL INFLUENCES SITE ACTUAL SITUATION USE HUMAN INFLUENCES CLIMATE PRODUCTION SYSTEMS POLITICAL INSTITUTIONAL Economic Institutional factors
38 Methodology DATA/INFORMATION Start with access to data/information, collection, selection, generation of data and information according to the objectives of the System and storage of the data information in GIS databases
39 Structure of the Land Resources Information Systems GIS Database comprising Soils and land capability Land use/land Cover Administrative boundaries Hydrology Infrastructure Elevation Protected areas and forest services Land Parcels/cadastral Agro-climatic zones
40 Land Resources Information Systems (Continued) Soils Attribute data comprising Soil Unit (number) Soil Family FAO Classification Soil parent material Surface stoniness/rockiness Slope class Erosion status Occurrence and frequency of flooding Soil drainage class (FAO classification) Effective rooting depth
41 Land Resources Information Systems (Continued) Soils Attribute data comprising Colour of the subsoil Particle soze in the top soil (30-50 cm) Soil nutrient status (N, P,K) Soil acidity/alkanity (ph- H2O) Percent rock and mineral fragments in the soil profile Crop Requirement Database
42 Methodology DATA/INFORMATION CREATE SPATIAL ANALYSIS UNITS Stratification of the physical space and population,using the variables defined according to the study objectives. This process of spatialization of the information is mainly based on the concept of Ecological Economic Zoning developed by FAO (1997) and adapted to local conditions and needs by the project. The process is called Definition of Analysis Units.
43 Methodology DATA/INFORMATION CREATE SPATIAL ANALYSIS UNITS EVALUATION OF LAND SUITABILITY by UNIT Following delineation and characterisation of the analysis units bio-physical suitability and socioeconomic viability of each unit are determined using the FAO methodology for land evaluation (1976, 1994), generating a matrix of suitabilities and related information for each of the selected land utilization types in all the analysis units.
44 Methodology DATA/INFORMATION CREATE SPATIAL ANALYSIS UNITS EVALUATION OF LAND SUITABILITY by UNIT GENERATING SCENARIOS On determination of a large number of land use types arranged in suitability matrix, it is possible to generate various scenarios according to predetermined objectives. Scenarios are generated on the basis of procedures which introduce changes in the initial suitability matrix, thereby generating new matrices using an iterative process which optimizes use according to the set criteria and restrictions.
45 NEGOTIATION SCENARIOS Methodology DATA/INFORMATION CREATE SPATIAL ANALYSIS UNITS EVALUATION OF LAND SUITABILITY by UNIT Finally all the results from the analysis are organized in an integrated information base in a GIS. The information base will be used to support the negotiation process for land use decisions. In this way the LRIS addresses the objective of providing information to support the land use planning process. GENERATING SCENARIOS PRESENTATION OF RESULTS
46

47