From Aspiration to Transformation: Myanmar Agriculture and the Rural Economy
|
|
|
- Charles Wilkerson
- 5 years ago
- Views:
Transcription


1 From Aspiration to Transformation: Myanmar Agriculture and the Rural Economy Duncan Boughton and Ben Belton Michigan State University Yangon, June 1, 2018
2 Outline MOALI s Agricultural Development Strategy Summary findings on the status of ag and rural transformation Evidence on ag and rural transformation Migration and wages Mechanization Agriculture and non-farm economy Outcomes (rural household incomes) Discussion


3 MOALI s Aspiration: Agricultural Development Strategy P 1 P 2 P 3 MOALI Vision Statement: An inclusive, competitive, food and nutrition secure and sustainable agricultural system contributing to the socioeconomic wellbeing of farmers and rural people and further development of the national economy
4 ADS goals require decentralized and multi-sectoral approach 1. Improved production systems Diversified farming systems (food staple, high value, livestock) Improved Varieties (yield, quality, resilience, cycle) Integrated soil fertility/pest and disease management Mechanization for cost saving and precision agriculture 2. Access to sustainable, efficient irrigation services 3. Flexibility of enterprise choice for farmers Land policy, trade policy Efficient agribusiness linkages (seed, chemicals, mechanization services, processors and exporters) Financial services and business management skills
5 Ag and rural transformation summary (1) 1) Agriculture is the largest source of rural employment and, with growing urban demand for high quality and diversified food, a key potential driver of sustained growth in the rural economy. 2) Migration out of rural areas is accelerating, driving up rural wage rates and injecting liquidity into migrant households in the form of remittances. 3) Increasing wage rates, combined with bank finance for machinery rental services, is driving extremely rapid mechanization. 4) Access to a wide range of goods and services, especially transport and communications, has improved rapidly in rural areas.
6 Ag and rural transformation summary (2) 5) Agriculture is under-performing relative to potential due to: poor water control (irrigation and drainage) inefficient use of modern technology (improved varieties, fertilizer, pesticide) lack of diversification into high value farm enterprises (aquaculture, livestock, fruit and vegetables) 6) Multi-sectoral (all hands) provision of public goods (research, extension, irrigation management, food safety) is needed to enable farmers to respond to emerging market opportunities. 7) The new Agricultural Development Strategy provides the framework for public sector reform but strong stakeholder engagement will be necessary to overcome organizational and human capacity constraints.
7 Evidence of agricultural and rural transformation
 2018: Dry Zone Variety Adoption and Seed Demand 2018: Southern Shan State (with maize and")
8 Survey Locations 2015: Mon State Survey 2016: Delta Region Survey (with aquaculture VC) 2017: Dry Zone Survey (with pulses and oilseed VCs) 2018: Dry Zone Variety Adoption and Seed Demand 2018: Southern Shan State (with maize and pigeonpea VCs)
9 Survey Components Mon Delta Dry Zone Shan Scoping 1 week 3 months (fish VC) Household Survey 1 month (mostly government) + 1 month (enterprises) 1600 HH 1100 HH 1600 HH Seed 1400 HH 1 month (farmers; government; enterprises) 1600 HH Community Survey 137 villages 73 villages 300 villages 425 villages Non-farm surveys 0 Machine & spare parts suppliers (49) Machinery Dealerships (60) Service providers (123) Oil Mills (182) Traders (376) Total = Dealerships TBD Service providers 350 Traders

10 Accelerating migration, rising wages
11 Accelerating migration in Delta Urban Rural 90% rural-urban 92% domestic 1 in 6 HH have migrants 50 Average migrant age :45 male/female split % employed in manufacturing 10 0 Cumulative share of all migrants by year first migrated (%),
12 and Dry Zone Domestic International % domestic 1 in 5 HH have long term migrants Average migrant age 24 56:44 male/female split 26% employed in manufacturing 55% low-skilled informal jobs Cumulative share of all migrants by year first migrated (%),
13 Migration is driving large rural wage increases Delta Dry Zone Real daily wages (MMK) % +32% % +15% Change in real daily wages for male casual workers

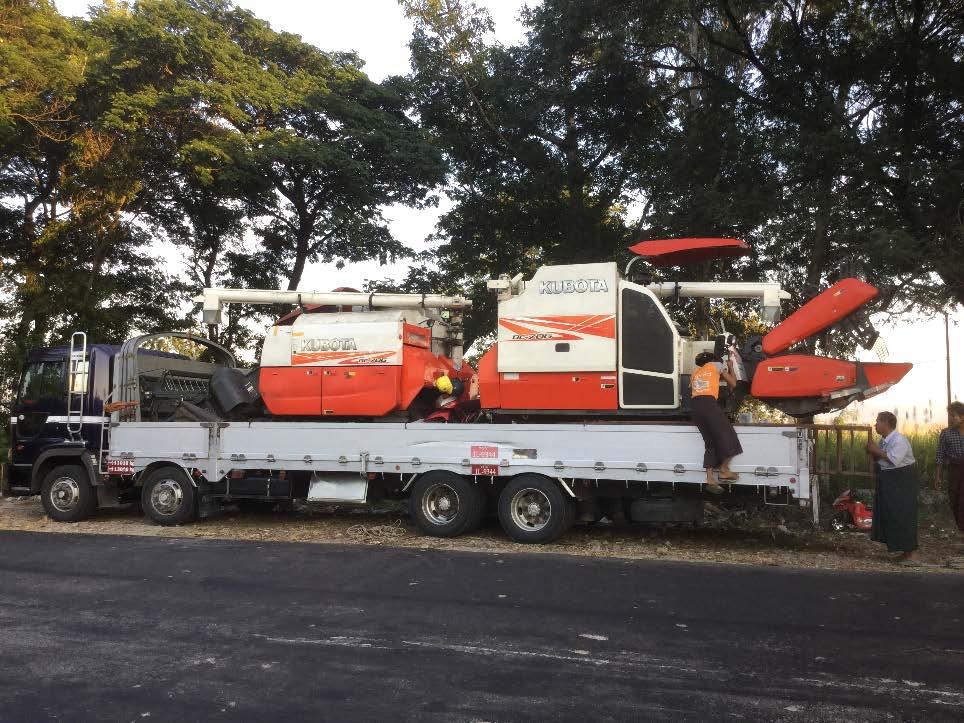
14 Agriculture mechanizing rapidly
15 Geographical spread of machine supply businesses
16 Improving access to formal financial services for machine purchases Share of sales (%) Bank Dealer Customer Hire purchase agreements with commercial banks began in 2013 Reduced capital constraints for machine suppliers, cost of credit to buyers 2WT 4WT Combine Harvester Source of finance for machinery purchases, 2016 (MAAS)
17 Rental services enabling access to machines 60% +1839% 50% Own Rent Share of farm HHs 40% 30% 20% 10% +216% +1801% +170% 0% 10 years ago 5 years ago Today 10 years ago 5 years ago Today 10 years ago 5 years ago Today 10 years ago 5 years ago Today 2WT 4WT Combine Harvester Thresher Share of farmers using machinery, by machine type, year and ownership status (READZ)
18
19 Scale-neutral technology % of farm households using <5 acres >5 & <10 acres >10 acres WT (Land Preparation) 4WT (Land Preparation) Combine (Harvesting) Share of households using agricultural machinery, by size of landholding (MAAS)

20 Access to formal credit is improving
21 Sources of credit diversifying % of villages with access Share of villages with credit access by source, 2011 & 2016 (MAAS)
22 Credit becoming much cheaper as sources diversify Monthly interest rate (%) % -0.4% -1.3% -1.3% -1.7% -3% -5.2% 0 Monthly interest rates from informal lenders and microcredit providers, 2012 & 2017 (READZ)

23 Rural non-farm economy growing rapidly
24 Numbers of non-farm businesses growing quickly MEAN No. ENTERPRISES/VILLAGE % Delta % +44% +67% % Dry Zone % +33% +56% 0 Motor transport Retail Personal services Food services Mean numbers of non-farm enterprise per village by type, 2011 & 2016/17 (MAAS & READZ)
25 BUT: Agriculture still the main source of primary employment Non-farm occupations 29% Own farm 42% Agriculture provides >70% of primary employment, plus indirect non-farm employment in value chains Agri-labor 29% Agricultural labor is 80% of off-farm employment in Dry Zone Share of individual primary employment, by type (MAAS)
26 Gender wage gap smaller for non-farm work Men Women Salaried work Non-farm casual labor Farm casual labor Average daily incomes for men and women worker, by type of work, 2017 (READZ)

27 Agricultural performance lagging
28 Only (post-monsoon) rice yields are improving years ago 5 years ago Rice Groundnut Sesame Greengram Reported average yields for selected crops (baskets/acre) in 2016, 2011, 2007 (READZ)
29 Use of Improved Varieties

30 Age of variety and seed planted in 2018
31 Agricultural productivity and profitability remain low Gross margin/acre (USD) Gross Margin/acre (USD) Green gram Monsoon Paddy Median = $200/acre Median = $100/acre Median agricultural land = 5.5 acres; Typical annual agricultural income = $1650/HH, or $330/capita
32 Returns in the Dry Zone are even lower, especially for upland crops Mean gross margin/acre (USD) Dry season paddy Monsoon paddy Groundnut Sesame Green gram Mean gross margins (USD/acre) for selected crops (READZ)
33 Yields very strongly affected by climatic conditions 2500 Average crop yield (kg/acre) Good year Average year Bad year Average crop yields (kg/acre) in years with good, average and poor climatic conditions (READZ)
34 Transformation outcomes: rural household incomes
35 Household Income Components (HHs with ag land) Crops Livestock Fishing/aquaculture Ag wages Non-ag wages Salaried employment Resource extraction Non-farm business Remittances 7% 12% 23% 10% 4% 1% 8% 44% 2% 5% 14% 6% 52% 3% 11% 17% 1% 5% 5% 7% 7% 3% 2% Mon State 2% 1% Delta Dry Zone $1,020 / $617 $794 / $373 $387 / $287 48%
36 Household Income Components (landless HHs) Crops Livestock Fishing/aquaculture Ag wages Non-ag wages Salaried employment Resource extraction Non-farm business 2% 2% Remittances 2% 3% 6% 2% 8% 13% 25% 9% 16% 13% 18% 7% 44% 19% 1% 19% 5% 5% 5% 17% 13% 2% Mon State Delta Dry Zone $690 / $475 $331 / $259 $414 / $280 45%
37 Household Income Components (land terciles) Dry Zone Crops Livestock Aquaculture Ag wages Non-ag wages Salaried employment Resource extraction Non-farm business Remittances 12% 1% 9% 5% 5% 32% 7% 1% 7% 5% 2% 15% 13% 49% 7% 1% 5% 5% 5% 11% 66% 29% 8% Tercile 1 (low) Tercile 2 Tercile 3 (high) $347 / $257 $366 / $290 $450 / $322

38 Thanks to our CESD research team
39 ADS case study: Decentralization of Agricultural Research
40 Is Myanmar s Agricultural Research and Extension System equipped to support ADS? 1. Scientists are well trained and highly dedicated important successes achieved despite obstacles 2. Research human resources extremely limited One tenth the size of neighboring countries Critical capacity gaps in almost all disciplines 3. Research is organizationally fragmented Limited research capacity spread across multiple units (DOA, DAR, YAU) Very limited collaboration between research and extension 4. Research staff geographically over-centralized 80% of DAR PhD and MS level staff at Yezin 5. Slow research career progression discourages talent
41 Consequences for Research Effectiveness? 1. Discipline-focused rather than production system focused 2. Laboratory and research station focused rather than farmer focused 3. Limited capacity to take advantage of global science 4. Limited capacity to translate research findings into improved farmer production and income increases 5. Limited talent acquisition and retention Potential impact of research on farmer welfare and economic growth not fully realized
42 ADS Opportunity for Research and Extension System Reform: Harvesting the Future 1. Large-scale research human resource recruitment and graduate training to address capacity gaps 2. Re-organize existing units to achieve critical mass in shortterm (e.g., Biotechnology) 3. Decentralize research and extension: joint regional, multidisciplinary teams to address farming system problems 4. Expand long-term international partnerships linking capacity building and farmer problem solving 5. Increase amount and flexibility of funding High impact of research on farmer welfare and growth
43 Potential areas for engagement Linkages between USAID funded projects and regional research centers Facilitating farmer visits and participation in variety evaluation on research or seed multiplication farms Expansion of on-farm evaluation of varieties and management practices Models of local commercial seed multiplication by farmers Training of farm service providers Regional commercial tissue culture labs