Achieving Irrigation 2.0 and 3.0 Efficiencies. December 9, 2015
|
|
|
- Roy Flynn
- 5 years ago
- Views:
Transcription

1 Achieving Irrigation 2.0 and 3.0 Efficiencies December 9, 2015

2 Speakers Gabriele Ludwig, Almond Board (Moderator) Terry Prichard, UCCE Irrigation and Water Management Specialist Emeritus Allan Fulton, UCCE Tehama County
3 Water Management and Efficiency Gabriele Ludwig, Almond Board Almond Irrigation Improvement Continuunm
4 Water Management and Efficiency Almond Irrigation Improvement Continuum Water Management and Efficiency One of four key components of the Accelerated Innovation Management (AIM) program adopted by Almond Board of California s (ABC) Board of Directors. California experts have noted there are a range of tools growers could be implementing without wholly new technologies. Focuses on accelerating almond grower transition and adoption of research based, commercially available, and increasingly water efficient irrigation management and scheduling tools. An Almond Irrigation Improvement Continuum has been developed to describe the steps of this transition.
5 Almond Irrigation Improvement Continuum Three proficiency levels Level 1.0 (minimum) outlines research-based irrigation management practices that are within reach for all California Almond growers. (Room ) Level 2.0 (intermediate) and level 3.0 (advanced) advance practices to more sophisticated levels that attain even more crop per drop. (Room 307) Comprehensive program of irrigation management and scheduling practices in five key areas Assessing irrigation system performance and efficiency regularly Estimating orchard water requirements based on evapotranspiration Determining the water applied Evaluating soil moisture Evaluating plant water status Guidance on how to effectively integrate the practices at each level
6 Almond Irrigation Improvement Continuum Measurement 1.0 Minimum 2.0 Intermediate 3.0 Advanced Irrigation System Performance Evaluate irrigation system for pressure variation and average application rate at least once every 3 years. Correct any diagnosed system performance problems. Assess distribution uniformity and average application rate by measuring water volume at least every 3 years. Correct any diagnosed system performance problems. Assess distribution uniformity and average application rate by measuring water volume at least every 2 years. Correct any diagnosed system performance problems. Applied water Use application rate and duration of irrigation to determine water applied. Use water meters to determine flow rate and water applied. Use water meters to determine applied water and compare to crop water use (ETc, evapotranspiration) to determine irrigation efficiency. Orchard Water Requirements Estimate orchard water requirements using normal year regional ETc to estimate irrigation demand on a monthly time step. Estimate orchard water requirements using normal year regional ETc adjusting for current weather and cover crop use on a biweekly time step. Estimate orchard water requirements using normal year regional ETc to plan irrigations then use real time ETc data to correct the schedule on a weekly time step. Soil Moisture Evaluate soil moisture based upon feel and appearance by augering to at least 3-5 feet. Monitor on a monthly time step. Use manually operated soil moisture sensors to at least 3-5 feet and monitor on a bi-weekly time step. Use information to ensure calculated water is not over/under irrigating trees. Use automated moisture sensors that store data over time. Review weekly to ensure calculated water is not over/under irrigating trees. Plant Water Status Evaluate orchard water status using visual plant cues just prior to irrigation or on a biweekly time step. Use pressure chamber to measure midday stem water potential just prior to irrigation on a monthly time step. Ensure calculated water applications are not over/under irrigating trees. Use pressure chamber to measure midday stem water potential prior to irrigation on a weekly time step. Ensure calculated water applications are not over/under irrigating trees. Use it to assess when to start irrigating. Management Integrating Approaches Combine irrigation system performance data with normal year regional ETc estimates to schedule irrigations. Check soil moisture status with auger occasionally. Use irrigation system performance data with regional estimates of normal year ETc to schedule irrigations and adjust based on feedback from monitoring soil moisture or crop water status. Develop an irrigation schedule based on predicted normal year demand, monitor status using soil and plant based methods. Adjust irrigation schedule with real-time ETc as the season progresses. *The web version of this continuum, available on Almonds.com/Growers after Mar. 1, 2016, will feature a More Information and Guidance link in each square explaining how that step can be achieved.
7 Almond Irrigation Improvement Continuum Outreach The Almond Board s objective is to assist all almond growers in meeting level 1.0 proficiency Beyond this, to work with growers to progress along the continuum to levels 2.0 and 3.0 proficiency This will be done in partnership with the many trusted and respected technical experts and resources available to California Almonds University of California Cooperative Extension USDA NRCS CSU Fresno, Cal Poly SLO CDFA SWEEP Program Private companies and services, irrigation districts, and others Adoption will be assessed via the Almond Sustainability Program Web version of Continuum will be available on Almonds.com/Growers after March 1, 2016 and will feature a More information and Guidance link in each square explaining how that step can be achieved, answering: What do I need to know? What are the key resources I need? How do I execute?


8 Terry Prichard, UCCE Irrigation and Water Management Specialist Emeritus
9 Achieving Irrigation Proficiency levels 2.0 & 3.0 (Moving forward on ABC s Irrigation Improvement Continuum) Terry Prichard UCCE Water Management Specialist Emeritus Allan Fulton Irrigation and Water Resources Farm Advisor Tehama, Glenn, Colusa, and Shasta Counties 9
10 Big Picture: Good Irrigation Water Management 1. Estimate how much water needs to be applied Tree water use plus some for irrigation inefficiency 2. Know your irrigation system Application rate in/hr, how long to apply an inch of water, gph/tree 3. Check if you are on target Soil moisture monitoring Plant water status 4. Correct irrigations as needed 5. Repeat through the irrigation season How to do this will be on the ABC web site 10
11 Effective Water Management Should: Support high yield potential Favor desirable nut quality Extend orchard life Assist pest management Use water and energy efficiently Contribute to efficient N management Include salinity management 11
12 Almond Irrigation Improvement Continuum Measurement 1.0 Minimum 2.0 Intermediate 3.0 Advanced Irrigation System Performance Evaluate irrigation system for pressure variation and average application rate at least once every 3 years. Correct any diagnosed system performance problems. Assess distribution uniformity and average application rate by measuring water volume at least every 3 years. Correct any diagnosed system performance problems. Assess distribution uniformity and average application rate by measuring water volume at least every 2 years. Correct any diagnosed system performance problems. Applied water Use application rate and duration of irrigation to determine water applied. Use water meters to determine flow rate and water applied. Use water meters to determine applied water and compare to crop water use (ETc, evapotranspiration) to determine irrigation efficiency. Orchard Water Requirements Estimate orchard water requirements using normal year regional ETc to estimate irrigation demand on a monthly time step. Estimate orchard water requirements using normal year regional ETc adjusting for current weather and cover crop use on a biweekly time step. Estimate orchard water requirements using normal year regional ETc to plan irrigations then use real time ETc data to correct the schedule on a weekly time step. Soil Moisture Evaluate soil moisture based upon feel and appearance by augering to at least 3-5 feet. Monitor on a monthly time step. Use manually operated soil moisture sensors to at least 3-5 feet and monitor on a bi-weekly time step. Use information to ensure calculated water is not over/under irrigating trees. Use automated moisture sensors that store data over time. Review weekly to ensure calculated water is not over/under irrigating trees. Plant Water Status Evaluate orchard water status using visual plant cues just prior to irrigation or on a biweekly time step. Use pressure chamber to measure midday stem water potential just prior to irrigation on a monthly time step. Ensure calculated water applications are not over/under irrigating trees. Use pressure chamber to measure midday stem water potential prior to irrigation on a weekly time step. Ensure calculated water applications are not over/under irrigating trees. Use it to assess when to start irrigating. Management Integrating Approaches Combine irrigation system performance data with normal year regional ETc estimates to schedule irrigations. Check soil moisture status with auger occasionally. Use irrigation system performance data with regional estimates of normal year ETc to schedule irrigations and adjust based on feedback from monitoring soil moisture or crop water status. Develop an irrigation schedule based on predicted normal year demand, monitor status using soil and plant based methods. Adjust irrigation schedule with real-time ETc as the season progresses. 12 *The web version of this continuum, available on Almonds.com/Growers after Mar. 1, 2016, will feature a More Information and Guidance link in each square explaining how that step can be achieved.
13 Almond Irrigation Improvement Continuum Measurement 2.0 Intermediate 3.0 Advanced Irrigation System Performance Assess distribution uniformity and average application rate by measuring water volume at least every 3 years. Correct any diagnosed system performance problems. Assess distribution uniformity and average application rate by measuring water volume at least every 2 years. Correct any diagnosed system performance problems. Applied water Use water meters to determine flow rate and water applied. Use water meters to determine applied water and compare to crop water use (ETc, evapotranspiration) to determine irrigation efficiency. Orchard Water Requirements Estimate orchard water requirements using normal year regional ETc adjusting for current weather and cover crop use on a bi-weekly time step. Estimate orchard water requirements using normal year regional ETc to plan irrigations then use real time ETc data to correct the schedule on a weekly time step. 13


14 Orchard Water Requirements A good way to estimate the orchard water use is to estimate the Evapotranspiration (ET). The sum of evaporation and plant transpiration Measuring the weather and then estimating the Evapotranspiration 14
15 Estimating Orchard Water Requirements Two types of ET information are available: Normal Year, Historic ET almond Information will be on the web site Uses ET averages over past years e.g. last 30 years. Good place to start with ET scheduling Very good for planning ahead for irrigations Real-time or ET Current year -- Currently available from CIMIS soon on web site More advanced ET scheduling Accounts for this year weather which may be different from long-term average Often used by planning irrigations using normal year ET, then check with real-time ET to correct if needed. 15
 : For the upcoming season For next")
 is the")
16 ET Information How do you use it? Estimate how much ET (water use) : For the upcoming season For next irrigation cycle For the time since the last irrigation. That amount (plus a little extra for irrigation inefficiency) is the amount of irrigation water you need to apply. ET = ETo X Kc 16

17 ET Information Almond Historical ET (inches per month) No cover in orchard middles From: Drought Management for CA Almonds by Doll & Shackel UC ANR Pub Will be on ABC web site 17

18 ET Information Historical ET (in/day during period) No cover in orchard middles Based on: Drought Management for CA Almonds by Doll & Shackel UC ANR Pub Will be on ABC web site 18

19 Cover Crop Can Use Up to 30% More Water than Clean Middles Cover surface coverage If cover has access to water 19
20 Estimate Orchard Water Requirements Using: 1. normal year regional ETc to plan irrigations 2. then use real time ETc data for that period to correct the schedule on the up coming period ET almond, inches Historical Real Time 2015 "Real Time" ET Data Inches Plan: June Irrigation = 3.8 inches Modesto Normal year Date Station Location Eto Kc ET almond Difference 6/1/ Modesto June /2/ Modesto /3/ Modesto /4/ Modesto /5/ Modesto /6/ Modesto /7/ Modesto /8/ Modesto /9/ Modesto /10/ Modesto /11/ Modesto /12/ Modesto /13/ Modesto /14/ Modesto /15/ Modesto Sum Time Step
21 Almond Irrigation Improvement Continuum Measurement 2.0 Intermediate 3.0 Advanced Irrigation System Performance Assess distribution uniformity and average application rate by measuring water volume at least every 3 years. Correct any diagnosed system performance problems. Assess distribution uniformity and average application rate by measuring water volume at least every 2 years. Correct any diagnosed system performance problems. Applied water Use water meters to determine flow rate and water applied. Use water meters to determine applied water and compare to crop water use (ETc, evapotranspiration) to determine irrigation efficiency. 21
22 Monitor Irrigation System Performance In field evaluation Why is this important? Determine Average Application Rate and how evenly (Uniformity) water is applied across the orchard. If you know how much you want to apply, you need to know the application rate in order to apply the correct amount of water. 22


23 Application Rate Impact Sprinklers First step can be to measure the pressure Measure the pressure and use the chart to get the sprinkler discharge Measure volume directly (gal/ min) Sprinklers: application rate is measured in in/hr 23


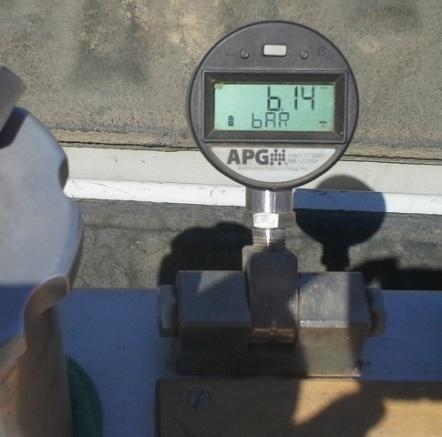
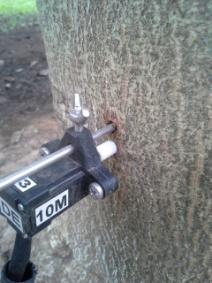
24 Application Rate Nelson Rotator Sprinklers First step can be to measure the pressure -- use chart Sprinklers: application rate is measured in in/hr To measure pressure: Remove the head and replace with pressure gauge 24
 drip emitters")


25 Application Rate Drip Emitters Non-pressure-compensating (NPC) drip emitters First step can be to measure the pressure use chart Measure discharge volume directly Microirrigation: application rate can be measured in in/hr Measure pressure with: Pressure gauge with drip fitting Pitot tube on pressure gauge punch hole in tubing, fix with goof plug Pressure-compensating (PC) drip emitters End of laterals Punch hole & measure Measure emitter volume 25

 microsprinklers Measure pressure with: Pressure gauge with drip fitting")
26 Application Rate - Microsprinklers Non-pressure-compensating (NPC) microsprinklers First step can be to measure the pressure Use chart Measure volume directly MS head in bucket Microirrigation: application rate can be measured in in/hr This is easier than converting all ET (in) info. into gal/tree Pressure-compensating (PC) microsprinklers Measure pressure with: Pressure gauge with drip fitting Pitot tube on pressure gauge punch hole in tubing, fix with goof plug 26

27 Irrigation Uniformity Why is it important? Poor uniformity means that some areas of the orchard receive less water than others. To adequately irrigate most areas of the orchard, non-uniformity means you end up over-irrigating much of the orchard. Over-irrigating much of the orchard leads to irrigation inefficiency and leaching of water and chemicals (e.g. nitrates) present in the root zone. Target Application = DU = 90% 1.12 DU = 70%

28 Irrigation Uniformities of Various Irrigation Systems 140 Average DUs by Irrigation Method MIL Micro- Sprinkler Micro-Drip Impact Rotator Flood Hand Move Wheel Line Center Pivot # of Evals Average DU 28
29 Distribution Uniformity Measuring the volume of water at strategic points throughout the orchard. Close to the head of the system through the tail of the system. Determining: The amount of water necessary to ensure only 1/8 of the field is under irrigated. Acceptable DU range from % If a planned irrigation of 3.5 inches was needed. DU 70% 3.5 /.7 = 5.0 in DU 90% 3.5 /.9 = 3.9 in 29


30 Improving Distribution Uniformity The Problem: Pressure variation Too high flow rate for design Too small main, sub main, or lateral pipe size friction loss Elevation differences Emitter/sprinkler variation Clogging Physical, Biological, Chemical Various size emitters/nozzles 30
 2.")
 Gallons / 27154 gal per acin /")
31 Monitor the Water Applied Know the applied water volume 1. Keep good records of irrigation set times (hrs) 2. Use a good flow meter easier and more accurate. Know the Application Rate (in/hr) Gallons / gal per acin / acres irrigated = acre inches applied 31


32 Water Meter Installation Turbulence in the area of measurement influences accuracy 32
33 Almond Irrigation Improvement Continuum Measurement 1.0 Minimum 2.0 Intermediate 3.0 Advanced Irrigation System Performance Evaluate irrigation system for pressure variation and average application rate at least once every 3 years. Correct any diagnosed system performance problems. Assess distribution uniformity and average application rate by measuring water volume at least every 3 years. Correct any diagnosed system performance problems. Assess distribution uniformity and average application rate by measuring water volume at least every 2 years. Correct any diagnosed system performance problems. Applied Water Use application rate and duration of irrigation to determine water applied. Use water meters to determine flow rate and water applied. Use water meters to determine applied water and compare to crop water use (ETc, evapotranspiration) to determine irrigation efficiency. Orchard Water Requirements Estimate orchard water requirements using normal year regional ETc to estimate irrigation demand on a monthly time step. Estimate orchard water requirements using normal year regional ETc adjusting for current weather and cover crop use on a biweekly time step. Estimate orchard water requirements using normal year regional ETc to plan irrigations then use real time ETc data to correct the schedule on a weekly time step. Soil Moisture Evaluate soil moisture based upon feel and appearance by augering to at least 3-5 feet. Monitor on a monthly time step. Use manually operated soil moisture sensors to at least 3-5 feet and monitor on a bi-weekly time step. Use information to ensure calculated water is not over/under irrigating trees. Use automated moisture sensors that store data over time. Review weekly to ensure calculated water is not over/under irrigating trees. Plant Water Status Evaluate orchard water status using visual plant cues just prior to irrigation or on a biweekly time step. Use pressure chamber to measure midday stem water potential just prior to irrigation on a monthly time step. Ensure calculated water applications are not over/under irrigating trees. Use pressure chamber to measure midday stem water potential prior to irrigation on a weekly time step. Ensure calculated water applications are not over/under irrigating trees. Use it to assess when to start irrigating. Management Integrating Approaches 33 Combine irrigation system performance data with normal year regional ETc estimates to schedule irrigations. Check soil moisture status with auger occasionally. Use irrigation system performance data with regional estimates of normal year ETc to schedule irrigations and adjust based on feedback from monitoring soil moisture or crop water status. *The web version of this continuum, available on Almonds.com/Growers after Mar. 1, 2016, will feature a More Information and Guidance link in each square explaining how that step can be achieved. Develop an irrigation schedule based on predicted normal year demand, monitor status using soil and plant based methods. Adjust irrigation schedule with real-time ETc as the season progresses.


34 34


35 Allan Fulton, UCCE Tehama County

 Allan Fulton")

36 Achieving Irrigation Efficiencies (Moving forward on ABC s Irrigation Improvement Continuum) Allan Fulton Irrigation and Water Resources Farm Advisor Tehama, Glenn, Colusa, and Shasta Counties
37 ABC s Irrigation Improvement Continuum Level of engagement on continuum Minimum In transition Advanced Types of measurement Irrigation system performance Applied water Orchard water requirements (ET) Soil moisture Plant water status Putting pieces of the irrigation improvement continuum together 37


38 Advanced Soil Moisture Monitoring Tools Soil Moisture Tension Sensors Volumetric Soil Moisture Sensors Remote and Rapid Data Acquisition 38
39 Soil Moisture Tension Sensors Soil Moisture Tension A measure of surface tension or force that retains water to soil The tension increases as a soil dries, plants spend more energy to transpire water Unit of measure is usually centibars (cb) 0 cb saturation, no tension 200 cb low plant water availability, maximum detection level 39

40 Applying Soil Moisture Tension Measurements Sandy Loam - May % Depletion 40
41 Advanced Volumetric Soil Moisture Monitoring Sensors Dielectric Sensors Calibrated to measure moisture in percent by volume, inches, or mm Measure ability of material to establish an electrical field dielectric constant More moisture increases ability of soil to concentrate electrical charge Air Dielectric constant of 1.0 Dry soil constant 3.0 to 5.0 Water constant of 80.0 Constant for moist soil will fluctuate between that of dry soil and water Two Dielectric Methods Frequency domain-reflectometry (FDR) capacitance probes two electrodes separated by an insulator. When installed the soil bridges the electrodes and enables the concentration of the electrical field to be measured. Time domain-reflectometry (TDR) Waveguides are installed parallel to each other into soil. An electrical signal is applied to the waveguides and travels their length and is reflected back. The travel time is related to the dielectric constant of the soil and its moisture content. 41
42 Applying Manual Volumetric Soil Moisture Measurements Soil Texture Field capacity Wilting Point (Inches/ft of soil) Available Water Capacity Field Capacity Sandy loam Fine sandy loam Loam Silt loam Clay loam Clay Soil water content (inches per 10 feet) % Depletion Wilting Point 2/11 3/4 3/25 4/15 5/6 5/27 6/17 7/8 7/29 8/19 9/9 9/30 10/21 42
43 43 Applications of High Frequency Soil Moisture Sensors
44 Concept of Detecting Crop ET and Water Stress with High Frequency Soil Moisture Monitoring Irrigation DAILY EVAPOTRANSPIRATION Onset of Crop Water Stress 44

45 45 Concept of Evaluating Soil Moisture Availability with Depth
46 Applications of High Frequency Soil Moisture Sensors Never see inflection (flattening of slope) from the lack of moisture availability at any of the sensor depths. Opportunity to stretch out irrigation frequency? Soil moisture levels at 3 rd, 4 th, and 5 th depths trending upward during first half of July. Possibility to decrease irrigation duration? Soil moisture levels at 3 rd and 4 th depths do not decline until later July. Moisture levels at 5 th depth do not change during the entire 60 day period. Possibility to decrease frequency and irrigation duration? 46
47 Soil Moisture Monitoring Talking Points 1. Soil moisture monitoring can lead to improved irrigation decisions on frequency and duration. 2. Soil moisture sensors coupled with radio telemetry are state of the art. Excel at convenient, timely delivery of information Deliver more detailed information than manual measurements Useful for measuring effective rainfall during dormant season 3. Sometimes acquiring representative data can be a challenge Calibration questions Soil and orchard variability Root distribution, density, and depth of soil profile Distribution of applied water Small volumes of soil monitored Gravelly soils and soils with shrinking and swelling characteristics 47


48 Advanced Monitoring of Plant Water Status Pressure Chamber Various Styles and Manufacturers of Pressure Chambers Basic Operation Requirement for Calibration Monitoring Frequency Zone of Measurement Replacement, Maintenance Major Challenges Measures Water Potential Varies by crop species Manual Points in time Single to few trees Minimal Time involved. Midday heat. 48


49 49 Measuring Midday Stem Water Potential (SWP)
50 Applying Midday Stem Water Potential (SWP) Water in plants is under tension, or negative pressure, so the scientific convention is to express SWP in negative values. An almond tree under -6 bars tension is under less stress than an almond tree under -15 bars tension. The gauge on a pressure chamber does not usually indicate negative numbers, so a larger number on the pressure gauge indicates more tree stress. 50
 Extent of crop stress and types of crop responses associated with different SWP levels in almond 0 to -6.0 Not commonly observed in almond. -6.0 to -10.")
51 Google UC ANR Publication 8503 Table 7. Guidelines for interpreting SWP measurements in almond. Pressure chamber reading or SWP measurement (- bars) Extent of crop stress and types of crop responses associated with different SWP levels in almond 0 to -6.0 Not commonly observed in almond to Low stress (when fully irrigated). Stimulates shoot growth, especially in developing orchards. Higher yield potential may be possible if these levels of crop stress are sustained over a season, barring no other limitations related to frost, pollination, diseases, or nutrition. Sustaining these levels may result in higher incidence of disease and reduced life span to Mild stress. Suitable from mid-june until the onset of hull split (July). Still able to produce competitively. Recommended crop stress level after harvest. May reduce energy costs or help cope with drought conditions to Moderate stress. Stops shoot growth in young orchards. Mature almonds can tolerate this level of crop stress during hull split (July/August) and still yield competitively. May help control diseases such as hull rot and alternaria, if present. May expedite hull split and lead to more uniform nut maturity. Also may help reduce energy costs and cope with drought conditions to Moderate to high stress. Should be avoided for extended periods. Likely to reduce yield potential, and may contribute to lower limb dieback to High stress. Wilting observed. Some defoliation. Impacts yield potential to Very high to severe stress. Extensive or complete defoliation is common. Trees may survive despite severe defoliation and may be rejuvenated. less than Trees are likely to die. 51
52 Monitoring Plant Water Status Talking Points 1. Applying midday SWP is better understood than other methods at this point. It uniquely integrates and quantifies how an orchard is responding to soil, water, and climatic conditions. 2. SWP can help confirm and adjust assumptions that are used with soil moisture monitoring or when using ET and a water budget. 3. Must go into the orchard routinely on potentially hot afternoons. Labor intensive a negative for some Encourages routine observation of an orchard, a positive for others Limited acreage that can be monitored in a day and with one instrument 4. Concern: by the time SWP responds, deep soil moisture is gone and you can t get it back. Use SWP in combination with ET and water budget or soil moisture monitoring (preferred) Resolve this through trial and error (not preferred) 5. Coping with orchard variability and achieving representative monitoring can be a challenge, usually less than for soil moisture monitoring. 6. Comment: Currently use midday SWP to make irrigation decisions but foresee even greater management potential if there was a way to acquire high frequency crop water stress indicators. 52


53 Some Alternative Sensors for Monitoring of Plant Water Status Dendrometers Leaf Monitors Aerial Imaging 53
54 Objective of Alternative Methods of Plant Water Status Monitoring Equivalent Stem Water Potential (bars) Based on Maximum Daily Shrinkage /1/2015 6/2/2015 6/3/2015 6/4/2015 6/5/2015 6/6/2015 6/7/2015 6/8/2015 6/9/2015 6/10/2015 6/11/2015 6/12/2015 6/13/2015 6/14/2015 6/15/2015 6/16/2015 6/17/2015 6/18/2015 6/19/2015 6/20/2015 SWP-mds SWP 6/21/2015 6/22/2015 6/23/2015 6/24/2015 6/25/2015 6/26/2015 6/27/2015 6/28/2015 6/29/2015 6/30/ Measured Stem Water Potential (bars) 54


55 Putting Pieces of ABC s Irrigation Improvement Continuum Together People and Time Intensive Irrigation Tools More easily automated irrigation Tools to Reduce Time and Labor and Improve Execution of Irrigation Management Telemetry Equipment to Reduce the Cost and Increase the Ease of Data Acquisition, Analysis, and Decision Making 55
56 Putting Pieces of ABC s Irrigation Improvement Continuum Together Examine Motivations Higher production potential and nut quality, more consistent production, and extended orchard longevity Environmental stewardship and being positioned as well as possible to engage public concerns Farming is inherently risky so taking informed risks should help sustain the farm operation Reality Check Can t try or do it all Exercise preferences that reflect individual farming operations The almond growing environment is amazing and transcends our technology and know how Just Do It Attention first to measuring applied water and irrigation system performance Suggest an approach that includes ET and a water budget and adapts based upon feedback Frequency of monitoring is a key to progressing along the irrigation improvement continuum Determination, Resilience, and Reward 56

57 Thank You! 57