FAO perspectives: From climate information to climate impacts on agriculture and food security
|
|
|
- Louise Hicks
- 5 years ago
- Views:
Transcription
1 Agrometeorologists for farmers in hotter, drier, wetter future Nov. 9, 2016, Ljubljana FAO perspectives: From climate information to climate impacts on agriculture and food security Mariko Fujisawa FAO - Climate and Environment Division (Mariko.Fujisawa@fao.org)
2 Some examples of FAO Works in Agrometeorology Supporting countries by Analysis and tools for the longer term: (policy making) 1. Investigating the weather indices which define agricultural practices (seeing the past towards future) 2. Longer term impact assessment of climate change on agriculture (seeing towards future) Practical Operations: (technical operation on ground) 3. Drought monitoring (seeing the current) 4. Support to produce the information for farming practices (e.g. agricultural bulletin)
3 LONGER TERM ANALYSIS: 1. WEATHER INDEX 2. IMPACT ASSESSMENT
4 1 &2 Weather Indices and Impact Assessment on Agriculture Used for implementing the projects for CSA (Climate Smart Agriculture) and NAP (National Adaptation Plans) Any CSA projects should be supported by robust evidences. Evidence about what have been happening to climate and agriculture in the country Evidence about what is expected to happen in the future: Support to strengthen the evidence-base Different methodologies/approaches/models for strengthening each evidence by country ownership We support their capacity building
5 1. Some examples of Weather Indices In the context where water usage is the main limiting factor for plant growing General Agriculture-centric Crop specific Annual average rainfall Monthly average rainfall Monthly average temperature Monthly average T max / T min Length of potential growing season Number of rain events in season Temperature requirement fulfilled Occurrence of extreme temperature Planting date Dry spells during reproductive period Growing stage of a crop Temperature (hot/ cold) damage on crop

6 1. Weather Indices: Dry spells during Maize production period in Malawi
7 3 Dry-spell in Chitedze, Malawi Number of dry-spells during the reproductive period of the 120-day Number of dry spells in reproductive (120) period (trend=0.02, pval=0.01) and 90-day Maize 3 Number of dry spells in reproductive (90) period (trend= 0.02, pval=0.02) day Maize 90-day Maize
8 Some examples of Indices defined In the context where water usage is the main limiting factor for plant growing Index Name Initial Planting date (Maize) Dry-spells during reproductive period Definition Date of start of any period (between 01-Oct and 15- Mar) when crop-specific planting conditions are met (a first day with Pr > 20mm) Any period of 5 or more days with Pr < 2.5mm per day between days 61 and 90 after final planting date Hot Tmax days during reproductive period Number of days with Tmax > 30 degree C between days 61 and 90 after final planting date Try to get better understanding of Weather-Agriculture relationship and trend in the past
 Simulation of the country s hydrology and estimation of water resources Crop yield projections Forest productivity changes under climate scenarios Integrated modeling")
9 2. Impact Assessment : MOSAICC (Modelling System for Agricultural Impacts of Climate Change) Downscaled climate projections (Statistical Downscaling) Temp/ Prec A capacity development tool (robust rather than sophisticated) Simulation of the country s hydrology and estimation of water resources Crop yield projections Forest productivity changes under climate scenarios Integrated modeling system for inter-disciplinary assessments National and sub-national scales, medium- to long-term Economic impact and analysis of policy response at national level
10 2. MOSAICC portal
11 Rainfall projection: vs (Dec to Feb) National scale with sub-national disaggregation
12 WABAL Crop specific water balance model (=Agrometshell) the FAO crop forecasting tool Used to produce crop water balance variables Need to get the historical yield data Make the yield function (correlation with historical yield data) MOSAICC: Crop Models

13 AQUACROP: FAO crop-model to simulate yield response to water Used to produce crop yield projections under climate scenarios Main Crops: wheat, maize, rice, sugarbeet, soybean, cotton, potato, quinoa, sunflower, bambara groundnut, sugarcane, Tomato, teff, barley, sorghum MOSAICC: Crop Models

14 Rainfed rice yield change: vs

15 Maize yield change in Peru: vs
16 PRACTICAL OPERATION: 3. DROUGHT MONITORING 4. OTHER SUPPORTS

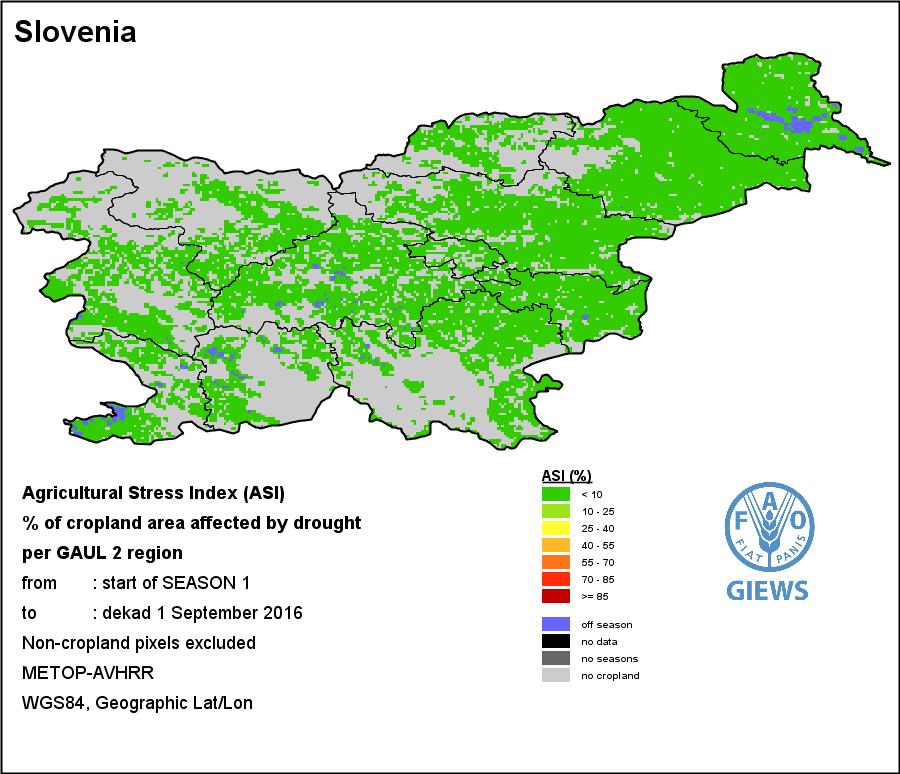
17 3. Drought monitoring tool: ASIS ASIS: Agriculture Stress Index System Main agricultural drought hot spots in 2011 United States, Mexico and the Horn of Africa.
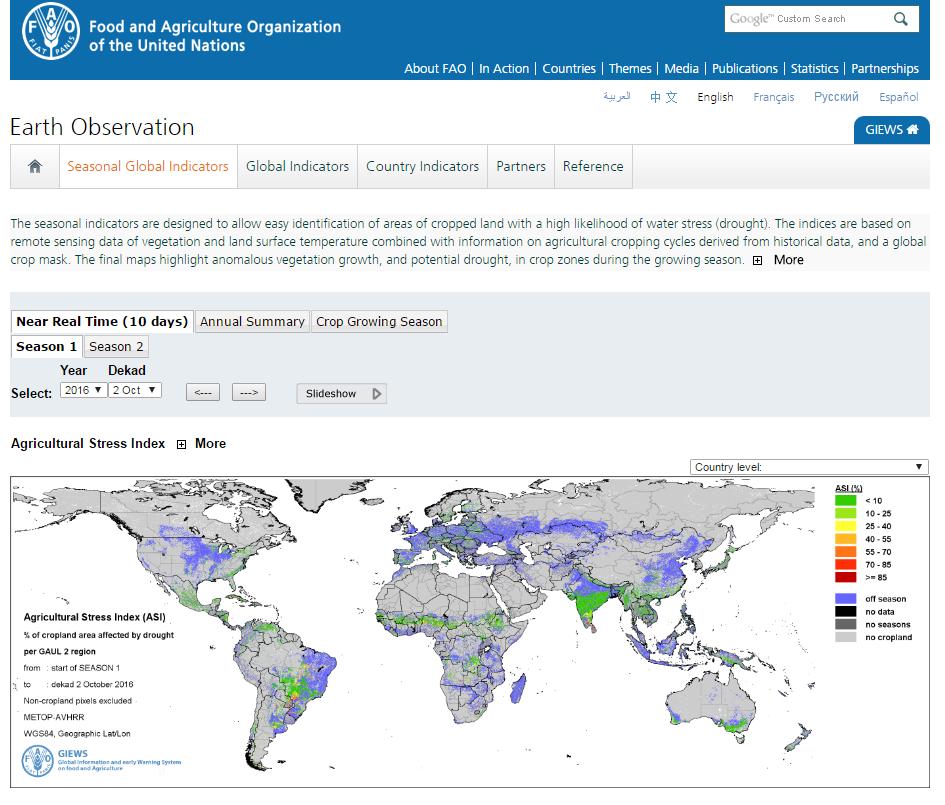
18
 Vegetation condition index (VCI)")
 VHI = a*vci + (1-a)* TCI high VHI")
19 ASIS (Agricultural Stress Index System) is based on VHI (Vegetation Health Index) Vegetation condition index (VCI) Temperature condition index (TCI) low VHI Vegetation Health Index (VHI) VHI = a*vci + (1-a)* TCI high VHI VHI<35 Drought
20 Agricultural Stress Index (ASI) Mean VHI image over the crop season 0,07 0,24 0,33 0,18 0,34 0,10 0,34 0,54 0,06 0,66 0,29 0,23 0,01 0,27 0,34 0,32 0,57 0,6 0,25 0,05 0,24 0,30 0,21 0,21 0,22 0,17 0,52 0,43 0,16 0,45 0,31 0,16 0,03 0,07 0,03 0,06 0,37 0,46 0,25 0,76 0,26 0,19 0,34 0,16 0,09 0,03 0,44 0,50 0,50 0,42 0,39 0,27 0,34 0,07 0,07 0,35 0,26 0,50 0,45 0,60 0,38 0,48 0,30 0,26 0,21 0,28 0,69 0,44 0,51 0,58 0,40 0,60 0,41 0,48 0,57 0,43 0,54 0,59 0,50 0,46 0,50 0,52 0,51 0,57 0,52 0,51 0,45 0,54 0,58 0,54 0,43 0,44 0,56 0,46 0,52 0,46 0,46 0,48 0,56 0,55 (1) THRESHOLD PIXELS with MEAN VHI < 35% 0,07 0,24 0,33 0,18 0,34 0,10 0,34 0,54 0,06 0,66 DROUGHT 0,29 0,23 0,01 0,27 0,34 0,32 0,57 0,60 0,25 0,05 0,24 0,3 0,21 0,21 0,22 0,17 0,52 0,43 0,16 0,45 0,31 0,16 0,03 0,07 0,03 0,06 0,37 0,46 0,25 0,76 0,26 0,19 0,34 0,16 0,29 0,03 0,44 0,50 0,50 0,42 0,39 0,27 0,34 0,07 0,07 0,34 0,26 0,50 0,45 0,60 0,38 0,48 0,3 0,26 0,21 0,28 0,69 0,44 0,51 0,58 0,40 0,60 0,41 0,48 0,57 0,43 0,54 0,59 0,50 0,46 0,50 0,52 0,51 0,57 0,52 0,51 0,45 0,54 0,58 0,54 0,43 0,44 0,56 0,46 0,52 0,46 0,46 0,48 0,56 0,55 (2) ONLY CROP AREA (3) PIXEL COUNTING CROP DROUGHT ASI % of crop area affected by drought NO CROP NO CROP #drought pixels (38) #total crop pixels (55) = ± 70%
21
22
23 4. Support for practical operations Case: Macedonia Support Hydrometeorological Division to produce climatic information for farmers Install AWSs to strengthen climate data collection (cover the whole country) for forecast Set up the database for climate and phenology Develop pest/ disease model base on the climate data -> Produce agromet bulletin to support farmers (climate, phenology, pest/disease) Calculate crop-specific soil-water balance (Agrometshell) Crop Yield forecasting (Agrometshell) Estimate crop yield (Aquacrop) Crop insurance (ASIS) Seasonal forecast/ pest and disease information (outside source)
24 Conclusion Identify the country s needs and capacity/ information gaps Choose methodology that can fill the gaps Data availability and quality lack of data can be complemented by global dataset (to some extent) MOSAICC and Weather Index: CSA, NAP etc., implemented in Morocco, the Philippines, Peru, (ongoing) Malawi, Zambia, Paraguay, Indonesia ASIS: Vietnam, Lao PDR, etc. Practical operations: Georgia, Macedonia, Namibia, Tajikistan, (Central Asia)
25 Conclusion We are open to support countries with other requests We are open to develop other new methods If you are interested in working with us, let us know! Thank you!