MESA IGAD THEMA SERVICES. Region. Mr Zachary K.K. Atheru RIC Manager
|
|
|
- Constance Barker
- 5 years ago
- Views:
Transcription
1 MESA IGAD THEMA SERVICES MESA main successes in the IGAD Region By Mr Zachary K.K. Atheru RIC Manager


2 INTRODUCTION Associated countries Djibouti, Eritrea, Ethiopia, Kenya, Somalia, South Sudan, Sudan, Uganda, Rwanda, Burundi Regional Implementation Centre ICPAC (Kenya) 4 years implementation period (Sep 2013 to Sep 2017) 2


3 THEMATIC ENVIRONMENTAL CHALLENGES OF THE REGION 60% of IGAD under Arid and Semi Arid Lands More than 40 percent of the IGAD population lives in semi-arid to hyper- arid zones. highly vulnerable to land degradation 3


4 THEMATIC ENVIRONMENTAL CHALLENGES OF THE REGION Longer and more frequent droughts Extreme climate in the region due to ENSO and IOD among other climate systems 4


5 Uncontrolled fires under favourable conditions fires can spread rapidly, destroying property, crops, shelter, forests and the associated flora and fauna, as well as leaving the land vulnerable to erosion THEMATIC ENVIRONMENTAL CHALLENGES OF THE REGION 5


6 THEMATIC ENVIRONMENTAL CHALLENGES OF THE REGION Loss of biodiversity Degradation of natural habitats Deforestation Environmental pollution Population pressures, and high poverty levels Lack of policies, legislation and support for environmental protection 6


7 THEMATIC ENVIRONMENTAL CHALLENGES OF THE REGION Charcoal & Timber markets are extensive Transportation: vehicles Illegal charcoal and timber confiscated
8 THEMATIC ENVIRONMENTAL CHALLENGES OF THE REGION Limited up-to-date and accurate information for the whole region Fragmentation of information which is spread over a number of institutions and thematic areas Lack of a regional infrastructure for storing, processing, presenting and disseminating data Inadequate mechanisms for tracking existing information 8
9 GENERAL OBJECTIVE To enhance land degradation, natural habitats assessments and forest monitoring for sustainable management of environmental resources By developing operational geo-information services By strengthening g the information management capacity of regional and national institutions in order to support decision i and policy making processes. To allow Informed decision i 9
10 Expected results Improved access by African stakeholders in IGAD region to Earth Observation (EO) and GIS data and information; Operational information services on LD, NH and FM are established to better manage environmental resources and improve policy and decision-making processes; Services developed by other RICs adopted in IGAD through cross-fertilization of services and products and cooperation among regions within the African continent; Strengthened political and policy development frameworks; Increased knowledge of stakeholders in the IGAD region with regard to EO information. 10
11 Result area 1: Data access Upgrade of the AMESD and PUMA 2010 stations : 9 AMESD stations to MESA stations; 9 PUMA 2010 Stations to PUMA 2015; Upgrade of computers and software for the regional training centre (IMTR Nairobi). Additional stations: South Sudan: MESA and PUMA stations Somalia: MESA and PUMA stations Universities (Djibouti andmakerere) Makerere): MESA stations NEMA Kenya: MESA station RCMRD: MESA station 11


12 Result area 2: MESA IGAD THEMA SERVICES 9/26/2016 EUMETSAT Forum; Kigali, Rwanda 12
13 LAND DEGRADATION ASSESSMENT SERVICE
14 Scope of Land Degradation Service Objectives of Land Degradation: Enhance assessment of extent and severity of land degradation at the regional and national levels Consolidate and enhance local hotspots for comprehensive assessment. 9/26/2016 EUMETSAT Forum; Kigali, Rwanda 14


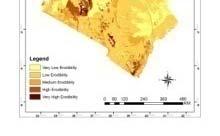

15 National Land Degradation Index Map Vegetation Index 40 WEIGHTS Rainfall Erosivity 20 Pop. Density 10 Soil Erodibility 30 Slope LS Factor 9/26/2016 EUMETSAT Forum; Kigali, Rwanda 15 50
16 Regional Land Degradation Index Map


17 LAND DEGRADATION BULLETIN
18 Use of Land Degradation Service Institution Land Degradation Impact generated Product Ministry of Land Degradation Land Reclamation Environment, Directorate of Land Reclamation, Kenya Index Map recommendations and policy review NEMA, Uganda Land Degradation Awareness of Natural resource Index Map management and generation of Atlas NEMA, Uganda Land Degradation Support to development of Index Map state of the Environment report. WRI Land Degradation Awareness of land degradation Index Map in Kenya and Ethiopia CETRAD Land Degradation Awareness of land degradation Index Map in Kenya
19 NATURAL HABITATS CONSERVATION SERVICE
20 NHC Service Objective of Natural habitat service: To provide an assessment tool on the state t of natural habitats t to support conservation policies in IGAD


21 Eco-climatic conditions
22 Vegetation conditions
23 NDVI Cluster analysis 23
24 Rainfall Analysis


25 Superimposing NDVI and Rainfall
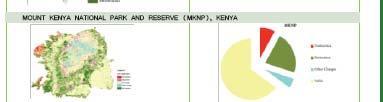
26 Land Cover Change Forest loss within the National Park (inner area on map above) approx. 18,000 ha. Forest


27 Fire products


28 PAs VULNERABILITY In order to conserve the protected areas and Natural Habitats, wildlife managers need information concerning the location and extent of the potential threat on the protected areas. Factors into the model: - Agriculture pressure - Population pressure - Accessibility pressure - Road - Land Cover - slope 28


29 NHC Bulletins
30 The service allows: Protected areas Authorities to: NHC Service Usage Assess the status of vegetation in and around the PAs Assess forage availability for wildlife in PAs and livestock around PAs Predict potential areas of human-wildlife conflicts Status of climatic conditions in the PA and its influence on the vegetation status Trans-boundary issues Pressure on the protected areas (rate of deforestation, agricultural expansion, etc) Crop and livestock farmers Assess the rangeland conditions and predict migration routes and areas
31 FOREST MONITORING SERVICE
32 Objectives The Forest Monitoring Service is a new service for IGAD. The objective of the Forest Monitoring service is to set up an operational system for monitoring forest cover, forest changes and forest vulnerability modeling. The main goal is to obtain information on forest degradation and deforestation at hotspot, national and regional levels.


33 Humid forest: timber and charcoal Drivers of Deforestation


34 The use of mangroves for charcoal Drivers of Deforestation


35 Drivers of Deforestation Mangrove Forests drying up due to effects of Climate Change


36 Deforestation for Agriculture Drivers of Deforestation


37 FOREST COVER CHANGE Mabira Forest in Uganda Provision of forest cover and forest cover change maps for the different periods for two forest ecosystems per country each covering a minimum area of 150km 2. The selection criteria process for these forests was based on importance, location and size.


38 Region Deforestation Statistics From 1990 to 2015 the region has lost approximately 63,000 sq km of forest cover, which corresponds to around 25,000 ha per year. The information constitutes the wider environmental monitoring activities and provides an important tool for environmental policy making.
39 Forest Service Usage Projection of deforestation under business as usual and with REDD+ action scenarios will set the Forest Reference Emissions i Levels at national levell for use as the basis for performance payments under REDD+. To support national and regional policy and decision makers engaged in Forest monitoring and conservation management by delivering i a regional forest monitoring i capability that reports on forest statistics. The vulnerability index model products will be the bases of decision making process that improve the preservation of forests and determines the risk levels. l
40 RESULT AREA 3: CROSS-FERTILIZATION AND CONTINENTALISATION Cross-fertilisation Services transferred: Land degradation to AGRHYMET and SADC Services imported Agricultural service from SADC Continentalisation Participation in the continental environmental bulletin 9/26/2016 EUMETSAT Forum; Kigali, Rwanda 40
41 RESULT AREA 4: POLICY AND POLITICAL FRAMEWORK Strengthen IGAD Policy & actions on environment management; Sensitizing decision & policy makers; Regional steering committee operational; National networks strengthened in 5 countries (Ethiopia, Djibouti, Sudan, Uganda and Kenya); Communication & networking strategy; Visibility. 9/26/2016 EUMETSAT Forum; Kigali, Rwanda 41
42 Training under the grant contract RESULT AREA 5: CAPACITY DEVELOPMENT Training on MESA IGAD Thema services at regional & national levels On-the-job training: For RIC and partners staff For national focal points Onsite training (attachments) Training under the Training service contract Distance Education Member States participated in these trainings Onsite training (ongoing) MESA System administration MESA system Applications PUMA System Administration PUMA System Applications 9/26/2016 EUMETSAT Forum; Kigali, Rwanda 42
43 Key Success Stories Integration of MESA products in national environmental documents and project MESA Products and e-station data used in the State of Environment Report in Uganda; Kenya s Ministry of Environment Land Reclamation Project using MESA Land degradation index maps and NDVI; Kenya Wildlife Service used MESA products as an input in identifying biodiversity hotspots and critical water catchment areas in Kenya in collaboration with Kenya Water Towers Agency and National Museum of Kenya; KWS uses data from the e-station for habitats monitoring (using SPIRITS software) 9/26/2016 EUMETSAT Forum; Kigali, Rwanda 43


44 Key Success Stories Cont d The LCC product of Mt Kenya was one of the factors considered in the fencing of the Park.
45 Related to result areas Key Success Stories Cont d Installation of MESA stations Creation of national networks and technical working groups in MS for EO data sharing and development of national level products Capacity development of MS 9/26/2016 EUMETSAT Forum; Kigali, Rwanda 45
46 THANK YOU