Livestock sector in the region, policy in relation to food production and efficiency (Slovenia, Croatia, Serbia & Macedonia)
|
|
|
- Morgan Parrish
- 5 years ago
- Views:
Transcription
1 Livestock sector in the region, policy in relation to food production and efficiency (Slovenia, Croatia, Serbia & Macedonia) Marija Klopčič 1, Marija Špehar 2, Ante Ivanković 3 Vladan Bogdanović 4, Dobrila Janković 5, Gjoko Bunevski 6 1 University of Ljubljana, Biotechnical Faculty, Department of Animal Science, Slovenia 2 HPA Croatian Agricultural Agency, Zagreb, Croatia 3 University of Zagreb, Faculty of Agriculture, Zagreb, Croatia 4 University of Belgrade, Faculty of Agriculture, Institute of Animal Science, Belgrade, Serbia 5 Faculty of Agriculture, Animal Science Dept., Novi Sad, Serbia 6 Faculty of agriculture and food, University Ss Cyril and Methodius in Skopje, R. of Macedonia Budapest,

2 Introduction of Slovenia (in 2014) Surface area: 20,273 km 2 Population: 2,062,455 Population density: per km 2 Length of borders: 1,370 km Length of rivers/streams: 26,600 km Altitude - average: m Share of forest land: 63.3 % Arable land: 8.6 % Share of utilized agricultural area: 25.5 % Average size of farms: 6.3 ha of agric. land

3 Livestock production Livestock production is the most important agricultural branch in terms of value. The total value of agricultural output is 959 million, in which livestock production contributes 511 million.
4 Animal stock in Slovenia ( ) No of cattle No of cows and pregnant heifers No of dairy cows No of farms with dairy cows Average no of dairy cows/ farm 7,0 14,3 No of dairy cows in milk recording No of farms in milk recording Average no of cows in MR / farm ,7 No of suckler cows No of farms with suckler cows Aver. No of suckler cows / farm 2,6 3,1 No of pigs No of sheep Poultry (x 1000) Horses
5 The importance of livestock production for the agricultural area in Slovenia National indicator GDP of total national economy (m )¹ 34,594 37,244 35,556 35,607 36,172 35,466 GDP of agricultural sector (m ) 1,625 1,687 1,542 1,575 1,702 1,725 Rural population as % of total population ,1 52,0 Labour force in agriculture as % of overall labour force Structure of gross agricultural output (%)² - animal production milk production beef production pig production sheep meat and milk production ,7 - poultry meat and eggs production ,5 ¹BDP Bruto domači proizvod; ²Vir: Statistični letopis Republike Slovenije
6 The importance of livestock production for the agricultural area in Slovenia National indicators Indicators of milk production - number of farms delivering milk to processing plants average milk production/cow/year in milk recorded herds (kg) average milk purchase price at farm gate ( /100kg) 28,05 32,97 25,87 26,83 30,45 30,13 Indicators of beef production - Daily gain of all cattle (1000 t) (87,1)* - Beef production in slaughter houses (1000 t) (43,3)* 77,8 77,2 74,7 77,6 80,2 38,4 37,2 35,6 35,7 35,8 - Domestic beef production (1000 t) 43,0 44,5 41,0 43,2 44,7
7 No of herds Cows per herd Changes in numbers of milk suppliers (number of dairy herds) and average number of dairy cows per herd No of herds cows/herd
8 Overview of the dairy food chain


9 Diversification Agricultural activities Suckler cows Beef/pigs/sheep/goats Horses / bees Vineyards/horticulture Forestry Non-agricultural activities Special local products Milk & meat products Oil, honey, Energy production Machinery services Agro-tourism Cottage industry.
10 Trends in production, consumption and trade Production stil increased; share of production for processing increased importantly; in 2006 intake by Slovenian dairies declined significantly due to raw milk sold to Italy (25 to 40 %) Consumption much higher than in EU-15 remains rather stable ( kg/capita) Country is an net-exporter of dairy products (including raw milk)
11 Milk and meat consumption per capita (in Slovenia - Butter Product in kg/capita/year /13 EU-27 (2010) Meat and entrails Beef meat Pork meat Poultry meat Sheep/lamb and goat meat Horse meat Fish Eggs Honey Milk and milk products Milk fresh milk and fermented d. products * - Cheese and cottage cheese *
12 Government actions preparing sector for challenges ahead in Slovenia Land policy encourage land consolidation Technical and institutional modernization, aimed at increasing productivity and efficiency in the chain; Regional policy support farming in less-favored areas by encouraging farming with nature conservation and/or tourism; Rural development programs aimed at creating nonagricultural employment in rural areas

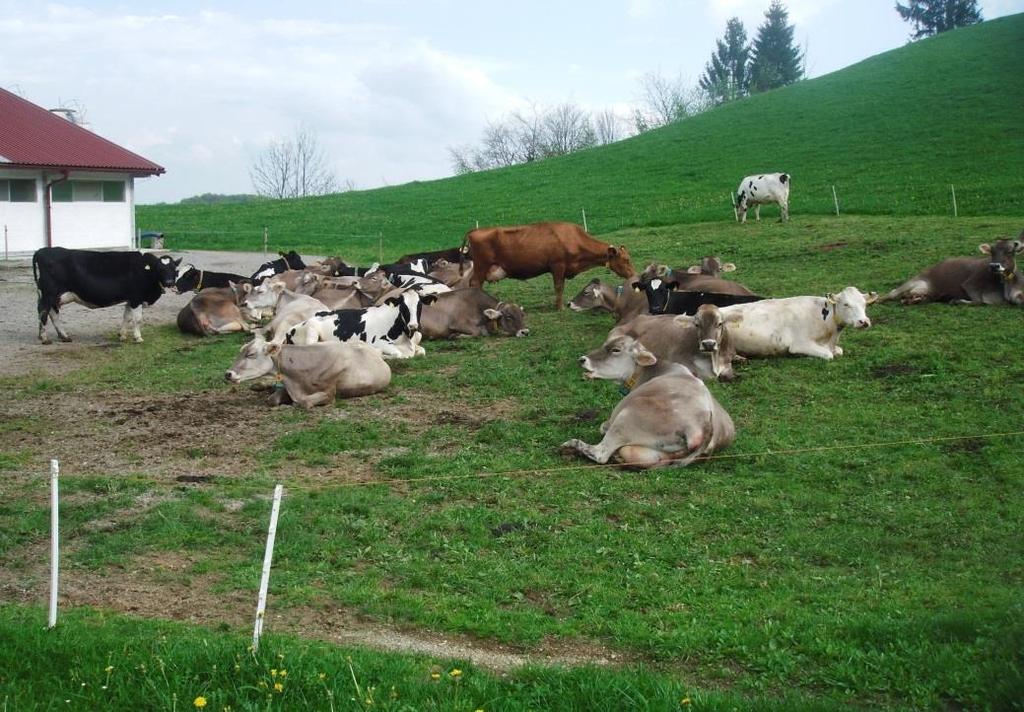
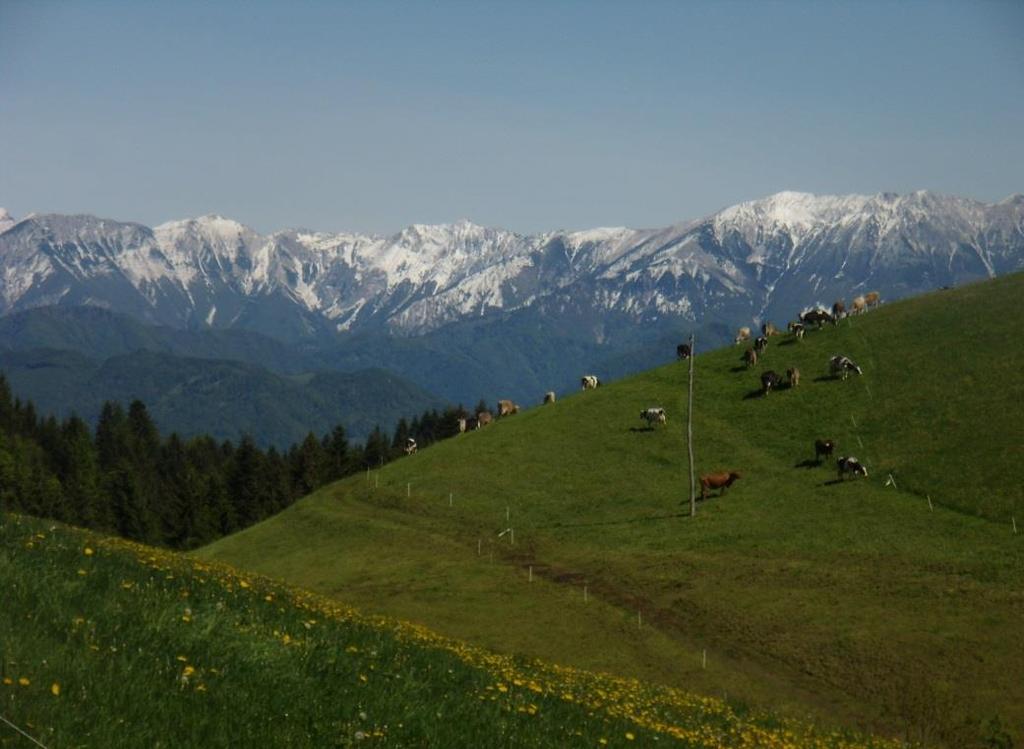
13 Sustainable development of livestock production in Slovenia

14 Introduction of Croatia (in 2014) Land area: 56,610 km 2 Sea surface area: 31,067 km 2 Population: 4,284,889 Population density: 78.4 per km 2 Length of borders: 2,375 km Share of forest land: 47 % Agricultural area: 3,2 mio ha Average size of farms: 5.6 ha of agric. land
15 Livestock production in Croatia to the nineties of the twentieth century animal production was largely covered needs of food industry and domestic consumption during the last two decades, significant changes in primary animal production, processing and animal product markets happened: specialization and intensification of production, improving of active technologies, enlargement of production units, through new quality standard, liberalization of market, through creating recognizable trademarks, traceability, liberalisation of the food product market increased the demand for competitiveness and distinctiveness of national animal production consumers attitudes have changed significantly during the last two decades, and today, the hygienic safety, traceability and origin of the product have become essential criteria
16 General about livestock production in Croatia Cattle and sheep production in 2011 Cattle population 444,000 cattle; 191,000 dairy cows; 110,000 in milk recording milk production 624 mil. kg 17,400 milk suppliers 36,050 kg milk / producers 140 kg milk / capita beef production t kg / capita Sheep population 630,000 heads sheep milk production 2.79 mil. kg 6,100 kg / producers 0.63 kg / capita sheep meat production (lamb and sheep meat) * t 2.27 kg / capita
17 Processing and consumption Changes are noticeable in the primary processing of animal products. Cow's milk is processed in 42 dairies 7 of them taking 84% of supplied milk part of their needs are met by importing milk Sheep milk is processed in 16 dairies 5 of them taking 94.5% of supplied milk Consumption cow's milk is 77.4 kg kg of milk products = 165 kg milk beef meat: 9.9 kg per capita pork meat: 16.5 kg per capita poultry meat: 18.8 kg per capita sheep/lamb meat: 2.3 kg per capita
18 Cattle population Reason for change 1. war 2. liberalization of market, trade with genetic material 3. depopulation of rural area, loose of interest for animal production 4. change of organizational structure of farm 5. relationship between prices input (fuel, feed) : output (milk) Number of animals ( 000) , Source: Annual Reports of the Croatian Agricultural Agency ( ) Year
 optimize level of production per animal adjustment of production technology to genotype using specific models crossing in the production")
19 Cattle production Adjustment to the actual economic and market environment develop of farmers competitiveness increase the size of cattle population increase interest in livestock production help in managing of market relations (production: processing: market) optimize level of production per animal adjustment of production technology to genotype using specific models crossing in the production maintaining of native breeds such recognizable of marketable brands
20 Production system Traditional system of milk production traditional technology, low investment, low production produce milk and meat mainly for their own purposes Modernized traditional system of milk production improved technology, medium level of investment modernized traditional system involves small dairy farms, up to 15 cows The system of small conventional dairy farms Harmonized technology, medium to high levels of investment, a market-oriented commodity production Specialized system of large dairy farms larger herds, modern technology, high investment, production >7000 kg lactation Holstein, Brown Swiss competitive milk production milking, feeding and other working operations are automated
21 Sheep production: Population sheep population animals 93% sheep for meat production 7% sheep for milk production Number of animals ( 000) Year
22 Sheep production: Technologies traditional technologies Mediterranean and mountain part of the Croatian dominant technologies mainly use autochthonous breeds less investment in the production process intensive production technologies in the continental part mainly use allochthonous breeds higher investments in the production process

23 CONCLUSION decrease of dairy cattle number had no significant effect on produced milk quantity, while had negative effect on quality beef calf number sheep milk is processed in quality cheeses, and as valuedadded product is placed on market standard models of sheep and beef meat production are recognisable on national level, but they need to undergo quality standardization due to appropriate market approach

24 Introduction of the Republic of Serbia (in 2011) Surface area: 88,361km 2 Population: 7,186,862 Population density: 95.5 per km 2 Share of forest land: 35 % 5.1 mil ha of agricultural land 3.3 mil ha of arable land 0.84 mil ha of pastures 0.61 mil ha of meadows Arable land: 36.2 % Share of utilized agricultural area: 66 % Average size of farms: 5.63 ha of agric. land
25 Basic National Indicator ( Year GDP (Gross Domestic Product) Agricultural sector (mil ) 2,380 (8.4% of GDP) 2,850 (8.7% of GDP) 2,254 (7. 8% of GDP) 2,180 (7.8% of GDP) 2,630 (9.2% of GDP) GDP Total national economy (mil ) 28,470 32,670 28,960 28,010 28,650 Gross output milk production in % of Gross Agricultural Output (GAO) Not available yet Not available yet Gross output beef production in % of GAO Not available yet Not available yet

26 In Serbian agricultural production 70% comes from plant and 30% from livestock production; Within livestock production, the share of cattle sectors is about 43%; The share of cow s milk in the total value of livestock production is 25%, while share of beef production is 17.6%.

27 Number of cattle Cattle Cows + Heifers Slaughtered 2250 Number of head, in Year
28 PROSPECTS FOR FUTURE SECTOR DEVELOPMENT FARMERS PERSPECTIVE / RESOURCE AVAILABILITY About 149,000 farms are more or less involved in dairy production; For future sector development very important are: - the age of owner, - contact with Agricultural Extension Services, - willingness for applying new technological solutions, - Ministry support, - availability of bank credits or other financial sources.
29 PROSPECTS FOR FUTURE SECTOR DEVELOPMENT FARMERS PERSPECTIVE / RESOURCE AVAILABILITY About 71% of farmers have regular contact with Agricultural Extension Service, while 23% of farmers have time-to-time contact; 75% of farmers have expressed a positive expectation from the future membership of Serbia in EU, although these expectations are not clearly defined; Over 86% farmers intend to expand or improve cattle production in the short term, while about 6.5% had no such intention;
30 PROSPECTS FOR FUTURE SECTOR DEVELOPMENT FARMERS PERSPECTIVE / RESOURCE AVAILABILITY The farmers ways for the improvement of production: increase in the number of animals / increase of the farm capacities, adaptation of farm facilities and improvement in the conditions of nutrition, housing and care, animals genetic improvement, more favourable bank credit terms and regulation of the situation on the market;
31 HOW DO FARMS NEED TO CHANGE Become bigger: implies more effective livestock farms. Increase yields: implies changes in genetic value, breed structure, feeding, overall management. Increase milk and gain production per kg concentrate: implies improvement in forage management & better ration formulation as well as better feed conversion.
32 HOW DO FARMS NEED TO CHANGE Improve hygiene: implies not just housing & hygiene, but also health care, welfare, milking conditions, cooling. Improve environment: implies more effective management and utilisation of manure and silage effluent.
33 HOW DO FARMS NEED TO CHANGE What investments are needed: More animal of appropriate genetic value / potential; Bigger and better buildings & equipment for animals, milking and milk storage; Better farm, forage & feeding machinery; Better storage for manure & silage.
34 Objectives and visions of future agricultural and rural development in Serbia dynamic and competitive agricultural farms, operating according to modern and environmentfriendly standards; a profitable processing industry, capable of manufacturing products of high demand for domestic and international markets; rural areas to maintain its attraction for people to live and work in, and at the same time evolve their own identity.
 Rains: 680 mm/year; Sunshine annual quantity: 2100-2450 h; Altitude: average = 829 m")
35 Introduction of the former Yugoslav Republic of Macedonia (in 2013) Surface area: 25,713 km 2 Population: 2,107,000 Population density: 83.4 per km 2 Climate: 3 type (mediterranean, continental, high mountain) Rains: 680 mm/year; Sunshine annual quantity: h; Altitude: average = 829 m (70% up to 1000 m);
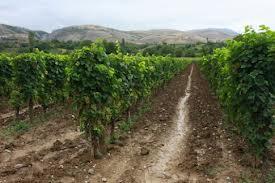
36 Farming conditions of the R. of Macedonia Good climate and relatively good soils offer comparative advantage for accomplishing high yields in agricultural production Half of the territory (50.8%) is used for agriculture, split almost equally between arable and pastures A cattle breeding is in very strong competition with vineyard, vegetable and fruit production, from one side, and with small ruminant production on hill-mountain area, in the other side Facing with the development of other agricultural branches in the present situation, dairy and beef production is in a difficult situation, with the tendency of decreasing of the number of farmers with cattle
37 Basic National Indicator ( Year GDP (Gross Domestic Product) Agricultural sector (mil ) 1,066 (18% of GDP) 1,269 (19% of GDP) 1,131 (17% of GDP) GDP Total national economy (mil ) 5,965 6,720 6,677 Gross output milk production in % of Gross Agricultural Output (GAO) Gross output beef production in % of GAO
38 Macedonian surface area and population Agricultural land ha 49,2% Pastures ha 50,8% Areable land ha 49.2% Woodland ha 38,8% Swapland ha 12,0% Population employed in agricult ,6% Population in rural area 39%
39 Livestock The livestock number in Macedonia is relatively small: cattle heads heads of sheep heads of pigs heads of horses heads of goats heads of poultry Cattle production is still the leader livestock branch in the state From livestock production, traditionally only lamb meat production is export oriented
40 Milk production In the R. of Macedonia there are 87 registered dairy plants Annually processed around tons of milk From totally dairy farmers, only farmers (24,33 % i.e. one of four farmers) has delivered his milk to the milking plant The larger dairy farms with more than 200 cows per farm, are still the nucleus of high-performance cattle, mainly for Holstein breed of cows
41 Types of cattle farmers in the R. of Macedonia According to the number of cows per farm and the level of production, there are three basic types of cattle farmers: Small farmers, with traditionally rearing of low productive breeds of cattle, with low input, keeping 1-3 cows with the annual production od 2,000-2,500 kg milk per cow. They are not a market oriented farmers. Family farming, with the average of cows per farm and the annual production of 4,000-5,000 kg milk per cow. They have a medium input in farming. Mainly they are mixed farmers, with a different agricultural production and different sources of income. Specialized dairy and beef farmers, with the capacity more than 50 cows per farm, with high input, higher milk production with more than 7,000 kg per cow. Their number in R.Macedonia is small, but they have to be stimulated by the state in future.
42 Consumption According to the average milk and meat consumption per household in RM in 2010 the average was: 156,9 kg of cows milk and 33 kg beef per household i.e. approximately 39 kg milk per head and 10 kg beef per citizen
43 Perspectives of Macedonian agriculture Ecological clean land for organic agriculture; Mxture of nations, religions, climate, cultures, etc. Organizing of farmers in Associations; Growing domestic market and consumption level for milk and meat products Use of domestic products: cheese, meat, fruit, vegetable, grape, wine, rakija, Development niche products for both domestic and export market Ability to create new EU approved slaughtering/processing facilities
44
45 Constraints, challenges and opportunities in WBC Constrains and challenges o o o o Structure: many small farms and small plots Strong decline during last years in cattle, sheep and goats population Milk and meat processing industry are in several locations not very well developed which has impact on farm gate prices (low capacities of processors) Livestock farmer organizations and services need further development Opportunities o o o o o o Livestock sector has long tradition, particularly rearing of ruminants EU accession perspective / IPARD / Agri-Environmental Measures Programmes to preserve traditional animal breeds Domestic and export markets for products from ruminants Serbia and Croatia beef production with maize Grassland-based ruminant production system in Slovenia 45
46