BIODIVERSITY AND ECOSYSTEM SERVICES DATA TO SUPPORT GLOBAL INITIATIVES: EXPERIENCE FROM IPBES SOUTHERN AFRICAN REGION
|
|
|
- Hugo Stafford
- 5 years ago
- Views:
Transcription
1 BIODIVERSITY AND ECOSYSTEM SERVICES DATA TO SUPPORT GLOBAL INITIATIVES: EXPERIENCE FROM IPBES SOUTHERN AFRICAN REGION Benis Egoh Senior Scientist Council for Scientific and Industrial research (CSIR), 11 Jan Cellier Road, Stellenbosch

2 GLOBAL INITIATIVES Target 15 By 2020, ecosystem resilience and the contribution of biodiversity to carbon stocks has been enhanced, through conservation and restoration, including restoration of at least 15 per cent of degraded ecosystems, thereby contributing to climate change mitigation and adaptation and to combating desertification Aichi Target 14 By 2020, ecosystems that provide essential services, including services related to water, and contribute to health, livelihoods and wellbeing, are restored and safeguarded, taking into account the needs of women, indigenous and local communities, and the poor and vulnerable.

3 RESPONSE TO GLOBAL INITIATIVES

4 Target 15 By 2020, ecosystem resilience and the contribution of biodiversity to carbon stocks has been enhanced, through conservation and restoration, including restoration of at least 15 per cent of degraded ecosystems, thereby contributing to climate change mitigation and adaptation and to combating desertification Aichi Target 14 By 2020, ecosystems that provide essential services, including services related to water, and contribute to health, livelihoods and wellbeing, are restored and safeguarded, taking into account the needs of women, indigenous and local communities, and the poor and vulnerable.

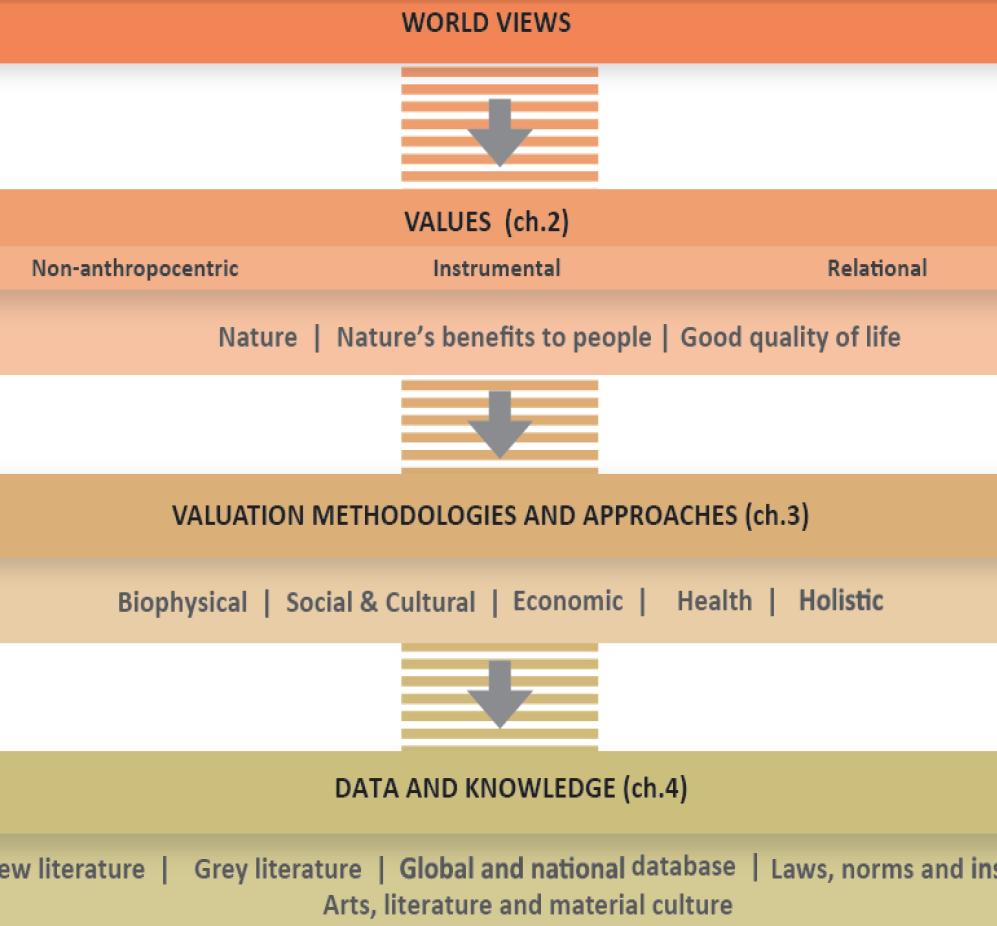
5 BIODIVERSITY AND ECOSYSTEM SERVICES
6

7 LEAD AUTHORS

8 MORE REVIEW LESS DATA


9 % of service area CHAPTER 3: STATUS AND TREND IPBES Range 100% 80% 60% 40% 20% 0% Carbon storage Soil retention Soil accumulation Surface water supply Water flow regulation Ecosystem service Natural Degraded Transformed

10 BIODIVERSITY DATA NEEDS
11 % of Land in Protected Areas BIODIVERSITY STATUS West Africa (298, 30%) Extinct (EX) Red Listing of Ecosystems Southern Africa (765, 20%) North Africa (62, 23%) East Africa and adjacent islands (1457, 37%) Central Africa (345, 33%) Africa Total (5065, 20%) 0.25 Endemic Species 0.2 0% 50% 100% Extinct in the Wild (EW) Critically Endangered (CR) Endangered (EN) Vulnerable (VU) Near Threatened (NT) Data Deficient (DD) Least Concern (LC) Desert Rock & Dune vegetation Temperate Forest EN VU LT Temperate Grassland & Savanna Tropical Forest Tropical Grassland & Savanna Africa Total Central Africa East Africa and adjacent islands North Africa Southern Africa West Africa

12 % IBAS completely protected Important Bird Areas - Africa Africa Total 25 Central Africa 20 East Africa 15 North Africa 10 Southern Africa 5 West Africa Year 35 IBAs in PA Africa Total Central Africa East Africa North Africa Southern Africa West Africa IBAs in PA


13 ECOSYSTEM SERVICES DATA NEEDS


14 % Protected ECOSYSTEM SERVICES DATA NEEDS Carbon Soil retention Soil Accumulation Surface water supply Water flow regulation Ecosystem services Hotspot Range


15 CHAPTER 5: SCENARIOS AND PROJECTIONS
16 Table X: Excel template for the systematic review of scenarios for Chapter 5 Question General information: Reference (hyperlink/ref) 1) What is the aim of the particular study? 2) What is the governing context of the study (who asked for the assessment)? 3) Which are the key themes upon which the study is focused? (E.g. Food-water-energy nexus, land degradation, invasive species, catchment-coast, conservation & sustainable use, environmental health & zoonotic diseases, foreign investment) 4) Spatial scale 4a) What is the spatial extent (if known) 4b) What is the governance scale (e.g. local, national, regional, global) 4c) What is the spatial resolution (if known) 5) On which location(s) is the study focusing? (e.g. which countries) 6) What is the timeframe of the study (the period over which projections are made)? 7) What phases of the policy cycle are addressed? (agenda setting, policy design, policy implementation, policy review) Scenarios (of drivers or policy interventions): 8) What type of scenario, or combination of types, is applied? (exploratory, target seeking, policy screening, policy evaluation- see 3c report) 9) What are the main indirect drivers of change addressed? (see 3c report) 10) What are the main direct drivers of change addressed? (see 3c report) 11) What are the main socio-economic assumptions made? 12) What alternative policy or management interventions are considered (for target-seeking and policy-screening scenarios)? 13) Where scenarios qual or quant or combined? 14) Where scenarios participatory Models (translating scenarios into expected consequences for nature or nature s benefits): 15) Which models of impacts on nature are used? 16) What type of model is used (e.g. empirical, process-based etc see 3c report) 17) What biodiversity or ecosystem variables (indicators) are projected by these models? 18) are values identified? If, yes, what types of values? (e.g. economic, socio-cultural, biophysical, plural) 19) Are critical thresholds (e.g. tipping points) addressed by these models? 20) Are the models of nature or nature s benefits used in this study qualitative or quantitative? 21) Are cross-scale interactions considered in this modelling? 22) Are trade-offs or synergies between different aspects of nature, or nature s benefits, analysed explicitly? 23) Are consequences of changes in nature, or nature s benefits, for human well-being explicitly addressed? 24) What other objectives or values (not directly mediated by nature or nature s benefits) are considered in assessing human well-being, including values dealt with primarily across other sectors (e.g. energy, education). Stakeholder involvement: 25) Which types of stakeholders were involved? 26) Was Indigenous and local knowledge explicitly addressed? Outcomes: 27) What were the outcomes of the study? 28) What are the strengths of the approach 29) What are the weaknesses of the approach? 30) Uncertainties?
17
18 CHALLENGES Lack of expertise Mismatch in expertise Lack of information Mismatch in typologies Lack of clarity/language Time frames Lack of funding Lack of flexibility
19 RESPONSE: CAPACITY BUILDING
20 CAPACITY BUILDING IPBES Values program Society for Conservation Biology IPBES Technical Support Unit CSIR/CST/SRC Collaboration Community of practice in Africa SCB Mentoring Program IPBES Research fellows Training exchanges African Section Regional Meeting Values workshop PhD Students Interns Exchanges GEOBON

21 VALUES WORKSHOP-MOROCCO

22 CAPACITY BUILDING


23 WHAT I DO Mapping ES Identifying indicators Land use impacts on ES Valuing ES Planning for ES Ecosystem services Conservation planning Economic valuation Invasion biology Restoration ecology Planning for biodiversity and ES Including cost in planning Planning for restoration Quantifying restoration success using ES Modelling distributions Impact of invasive species on ES