BANGLADESH FOOD SECURITY MONITORING QUARTERLY BULLETIN
|
|
|
- Lester Hardy
- 5 years ago
- Views:
Transcription
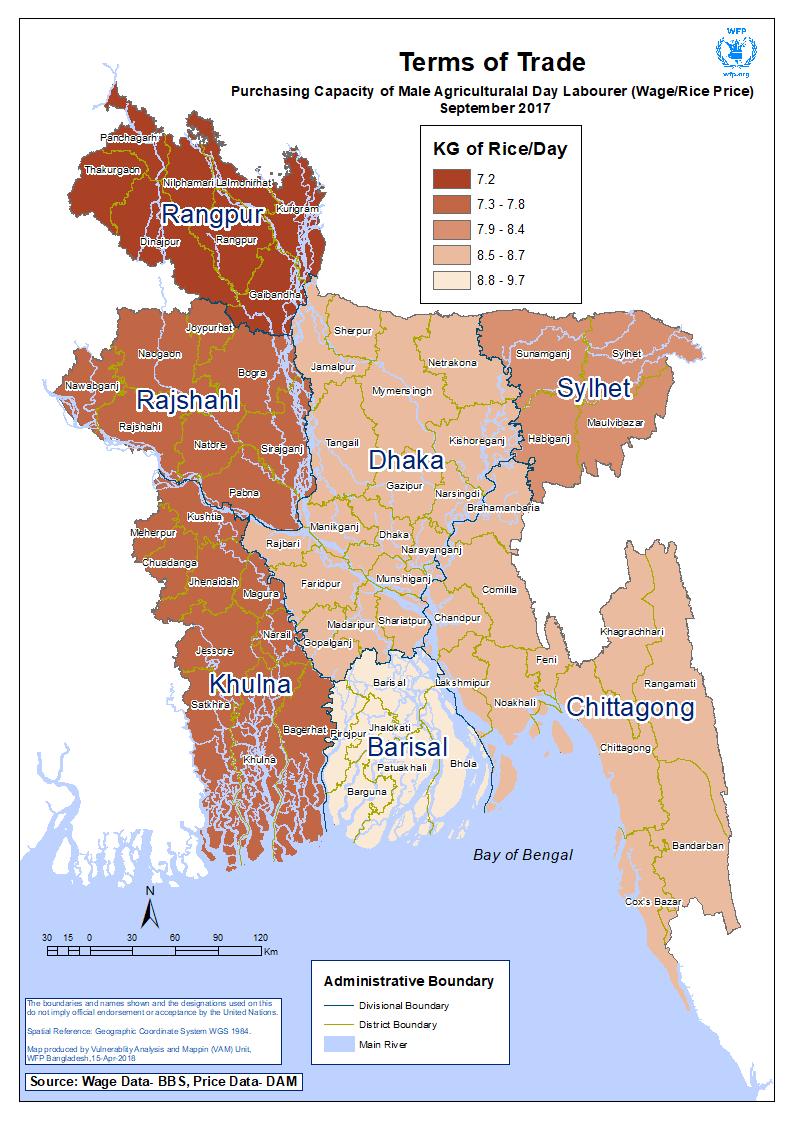
1 Issue No. 30 Oct-Dec 2017 Environmental Conditions (page 1) Economic Conditions Inflation and remittances (page 2,3) BANGLADESH FOOD SECURITY MONITORING QUARTERLY BULLETIN HIGHLIGHTS Retail price of food: The national average retail prices of coarse rice started to decline in the beginning of the reporting quarter after reaching record highs during the previous quarter following flood-induced losses to the main Boro crop coupled with reduced production and imports in Prices of rice for the reporting quarter were however, 16 percent higher year-on-year. Prices of wholemeal wheat flour (atta) showed a stable pattern during the reporting quarter, at around 32 Tk/kg. The price of palm oil was also stable, and that of lentils (masur) decreased during the reporting period. Inflation: General inflation, measured by the point to point variation in the Consumer Price Index (CPI), continued to increase since the last quarter and stood at 5.8 percent in December Food inflation during the reporting quarter was more than 33 percent higher year-on-year. Non-food inflation on the other hand, increased by 8 percent during this period compared to the previous quarter. Food Availability Crop production, food import, public grain stock and distribution (page 4,5) Food Price Monitoring Wholesale and retail prices (page 5-7) Terms of Trade (page 8-9) Shocks Faced by Households Rohingya Refugee Influx Impact in Cox s Bazar since August 2017 (page 9-10) Food Security Outlook (page 10-11) Map ToT for agricultural labourers September 2017 (page 13,14) Remittances: Average month-on-month remittance inflow for the reporting period was 5 percent higher compared to the previous quarter and about 21 percent high yearon-year. The Central Bank referred to the various initiatives taken by the Government to tackle the growing popularity of digital hundi, an illegal transfer of funds from abroad. The rising exchange rate might also have contributed to the jump in remittances. However, remittance inflow in the just concluded calendar year was USD billion, the lowest in six years despite a 35 percent increase in migrant outflow during the period. Food production, import and stock: The Department of Agricultural Extension (DAE) has fixed the target for food grain production at million MT for the FY 2017/18 of which million MT is for rice and 1.47 million MT for wheat. The public stock of food grain was much lower during the FY 2016/17 with the closing stock in July 2017 extremely low at 0.4 million MT. From the beginning of the current FY , the foodgrain stock increased moderately and reached 0.91 million MT in December 2017, resulting from accelerated public import. During the reporting quarter, total foodgrain import was 3.35 million MT which was 31 percent higher compared to the previous quarter, imported by both public and private sectors. Public food procurement and distribution: Foodgrain procurement target for the current FY was initially set at 1.80 million MT which was subsequently revised to 1.10 million MT due to the unpredictably higher market price of Boro rice following the floods in the North. The total foodgrain distribution target was revised to 2.44 million MT from a pre-defined target of 2.74 million MT during the current FY 2017/18. The actual foodgrain distribution during FY 2016/17 was 2.22 million MT, about 9 percent less than the target for the current FY. Wage rate and purchasing capacity: In September 2017, the average wage for a female labourer was 279 Taka/day whereas for a male labourer it was 359 Taka/day a difference of 80 Taka/day. There were better work opportunities for agricultural labourers during the reporting quarter such as Aman harvesting and post-harvest processing. Thus the agricultural wages were also reasonably high through the period. Wage data collected from BBS showed that the average ToT went up in July-August 2017 due to an increase in agricultural wages as compared to the previous month. TOTs however, started decreasing in September and hit 8.2 kg of rice/day. The average ToT during this month was also about 18 percent lower than in the same period last year. As mentioned considerably higher rice prices and lower public stocks during the reporting quarter contributed to the downward ToT in this period -- for both male and female agricultural day labourers.

2 ENVIRONMENTAL CONDITIONS Boro paddy and wheat are two major winter (rabi) crops according to the agricultural calendar. Boro paddy is an irrigation dependent rabi crop planted during December to mid-february. The planting period for wheat is from November to mid-january and it suits better in dry and cold weather. Actual rainfall during the reporting quarter was quite unstable, being about 74 percent lower in November and as much as 419 percent higher in December 2017 from normal. However, the deviations in rainfall during this period did not cause any remarkable damage to the standing crops. The average temperature during the reporting quarter was close to the normal temperature and was favourable for the planting of Boro paddy and wheat. The Bangladesh Meteorological Department (BMD) regularly monitors the precipitation status of the country. The majority of the central and south-western parts experienced moderate to extreme wet conditions (SPI to 2 and more) during the reporting quarter. Central parts of both Chittagong and Cox s Bazar districts faced a moderate state of dryness/drought (SPI to -1.0) over this period. Average Rainfall (mm) Average Temperature (Celsius) Month-Year Actual Normal Deviation (%) Actual Normal Deviation (%) Oct' Nov' Dec' Source: Bangladesh Meteorological Department 1 Standardized Precipitation Index (SPI) refers to the probability of precipitation for any time scale to define drought intensity. The SPI ranges from +2.0 and more referring to extremely wet conditions, to -2.0 and less referring to extremely dry conditions/drought
3 Jan'14 June'14 Nov'14 April'15 Sep'15 Feb'16 July'16 Dec'16 May'17 Oct'17 Inflation (%) ECONOMIC CONDITIONS INFLATION AND REMITTANCES Inflation General inflation, measured Inflation Rate (point to point), Jan 2014-Dec 2017 by the point-to-point 12 Food Inflation/ Rural Food Inflation/ Urban variation in the Consumer Price Index (CPI), increased 10 towards the end of the Non-Food 8 Food previous quarter on the back of a sharp rise in rice prices. General 6 Rice prices rose to record highs in September following reduced production and stocks during Boro 2 season due to floods. General inflation came down 0 slightly in October 2017 with the downward drift of rice Base year: 2005/06 Source: Bangladesh Bureau of Statistics prices and continued to decline during the reporting quarter hitting 5.8 percent in December In the last quarter of the calendar year 2017, the overall inflation edged up about 7 basis points from the previous quarter to 5.9 percent on the back of an increase in non-food inflation. Food inflation started to decrease, with declining rice prices in the local markets, during the reporting quarter after reaching a 38-month high of 7.87 percent in September. It dropped for two consecutive months but in December it increased to 7.13 percent as rice prices went slightly up again. However, food inflation during the reporting quarter was more than 33 percent higher year-on-year. Non-food inflation on the other hand, increased by 8 percent during this period compared to the previous quarter. Inflation in Bangladesh remains stubbornly high at 5-6 percent relative to the global rate range of 2-3 percent. According to a World Bank statement, inflation in Bangladesh is among the highest in the South and South- East Asia region, and significantly higher than for its major trading partners in Europe and America. A substantial fall in global commodity prices opened opportunities to reduce domestic inflation through proper conduct of fiscal and monetary policies. The Bangladesh Bank announced a cautious monetary policy instead of an expansionary one anticipating a rise in inflation in the coming months. Even though food inflation had been following a decreasing trend during the past few years, there continued to be a significant difference between food inflation in rural and urban areas. However, rural food inflation was higher than urban largely on the back of sharp increase in rice prices
4 Jan Feb Mar Apr May Jun Jul Aug Sep Oct Nov Dec million BDT* Remittance inflow The month-on-month remittance Wage Earners Remittances inflow (in USD) started to increase in the previous quarter and reached USD 1.42 billion in August, then 90, dropped to a seven-year low in September 2017 mainly due to 80,000 economic instability in the Middle 70,000 East despite the slight pick-up in oil prices in recent months. The situation started to improve in the beginning of the reporting quarter. In October 2017 there was a USD 1.16 billion remittance inflow which was 36 60,000 50,000 40,000 30,000 percent higher compared to the previous month. The average inflow for the reporting period was 5 percent higher compared to the previous *Converted to BDT Constant 2007 Source: Bangladesh Bank quarter and about 21 percent higher year-on-year. The Central Bank referred to the various initiatives taken by the Government to tackle the growing popularity of digital hundi, an illegal transfer of funds from abroad, to trigger remittance inflow in recent months. The rising exchange rate might also have contributed to the jump in remittances. However, remittance inflow in the just concluded calendar year was USD billion, the lowest in six years despite a 35 percent increase in migrant outflow during the period. Remittance is a major source of foreign currency and significantly contributes to the GDP of Bangladesh. Thus the declining trend has progressively become a matter of concern for the Government. The Central Bank considers low global oil prices; use of non-banking channels for sending remittance (hundi); slower manpower export and slowdown in global economy as the causes of this decline. Remittance inflow from the Middle Eastern countries declined by 5.2 percent year-on-year in the last FY. As stated by the Ministry of Finance, the Government has taken a number of initiatives to resume remittance inflows. Some of such initiatives are bringing down the cost of remittance transfer; improving the efficiency of overseas banking units and exchange houses; extending incentives to Bangladeshi migrants and encouraging them to send money through official channels. The Government would also make efforts to explore new labour markets and send workers abroad at low cost; and to develop training infrastructure and facilities to migrant workers to better meet the job requirements of the host countries (newspaper sources). Remittances are expected to play a vital role in achieving the country s 7 th Five-year Plan and ultimately the Sustainable Development Goals (SDGs). Every year a substantial number of Bangladeshi workers go abroad for work. According to the Cabinet Division, manpower export rose by 31 percent in the FY compared to a year ago. But it could not demonstrate positive effects on the remittance inflow as workers are mostly little trained and lowly educated and therefore, have to face unemployment and/or lower wages. About 88 percent of migrant workers move abroad without receiving any formal training (newspaper source). However, a sign of hope is the increased female migration in the international labour market with a yearly growth of 14 percent in the just concluded FY 2016/17. But safety and security for the migrant women workers are yet to be ensured. Human trafficking remains a crucial challenge
5 Million metric tons (MT) FOOD AVAILABILITY CROP PRODUCTION, FOOD GRAIN IMPORT AND PUBLIC GRAIN STOCK Food grain production The Department of Agricultural Extension (DAE) has fixed the food grain production target for 2017/18 at million MT against the actual production of million MT in the preceding year. The production target was set at million MT for rice and 1.47 million MT for wheat (FPMU, FSR 111). The latest DAE monitoring report revealed that the area cultivated for Aus slightly exceeded the target because of various incentive packages given for Aus production; and that of Aman marginally fell short of target due to damage caused by floods in the north-western region. The total production was estimated at 2.71 million MT for Aus and million MT for Aman. Food grain stocks The public stock of food grain was much lower during the FY 2016/17 as compared to the previous FY. The closing public stock in July 2017 stood extremely low at 0.4 million MT which was 125 percent lower yearon-year. The Ministry of Food refers to lack of domestic supply for the domestic rice procurement programme from Boro crop as the reason for shortage in public stock. From the beginning of the current FY , foodgrain stocks increased moderately and reached 0.91 million MT in December 2017, resulting from accelerated public import. The gradual fall in rice stock in the preceding FY had an impact on the market price of rice. Food grain import Total food grain import in the preceding FY 2016/17 was 5.82 million MT. The revised budget for foodgrain import in the current FY 2017/18 has been fixed at 9 million MT of which rice and wheat would be 3.50 and 5.50 million MT respectively. During the reporting quarter, total foodgrain import was 3.35 million MT Food Grain Import in the current FY 2017/ Budgeted and Projection Private which was 31 percent higher compared to the previous quarter, imported by both public and private sectors (FPMU, FSR 111). Rice imports scaled a two-decade high in the first half of the current FY. The Government decided to import rice on the back of crop losses during Aman and Boro seasons due to floods. Two consecutive cuts in import duty, from 20 to 10 percent in June and to 2 percent in August 2017, gave a boost to imports (newspaper source). Total rice import for the reporting quarter was 1.26 million MT, 82 percent undertaken by the private sector. Wheat import for the reporting quarter was about 2.09 million MT as of December 2017 which was about 27 percent higher compared to the previous quarter and 7 percent higher year-on-year. Almost 88 percent of the total wheat import was undertaken by the private sector with negligible public commercial import and a little food aid (FPMU, FSR 111) st Qtr 2nd Qtr Budgeted and Projection Rice Public st Qtr 2nd Qtr Wheat Source: FPMU

6 million metric tons (MT) Food grain procurement Actual procurement during the previous FY was about 1.38 million MT of rice against the target of 2.05 million MT. For the current FY 2017/18, procurement target was initially set at 1.80 million MT which was subsequently revised to 1.10 million MT due to the unpredictably high market price of Boro rice followed by floods. The Aman procurement target was initially set at 0.30 million MT. However, as of 30 th December 2017, only 0.15 million MT of Aman rice has been procured (FPMU, FSR 111). Food grain distribution through PFDS The total foodgrain distribution target was revised to 2.44 million MT from a pre-defined target of 2.74 million MT during the current FY 2017/18. Actual foodgrain distribution during FY was 2.22 million MT, about 9 percent less than the target for the current FY (Ministry of Food). Total rice distribution during the first half of the current FY was 0.56 million MT, as much as 32 percent less compared to Food Grain Distribution (Cumulative) through PFDS FY 16/17 Actual Source: Ministry of Food the same period last year. Lower rice stock in the Government warehouses, on the back of crop losses due to floods, might have led to lower public food grain distribution. Wheat distribution also showed a downward shift during this period, about 35 percent less than in the previous year million MT of foodgrains were distributed up to December 2017 which is only 29 percent of the total distribution target. About 48 percent of the distribution during the first half of the current FY 2017/18 was through financial channels with Khadda Bandhob Karmosuchi (Food Friendly Programme for the poor, rice at Tk 10/kg) having the largest share, about 0.7 million MT, followed by Open Market Sales (OMS). Among nonfinancial channels the Vulnerable Group Development (VGD) and the Vulnerable Group Feeding (VGF) programmes dominated with higher shares of distribution FY 17/18 Budgeted Rice Dec-17 FY 16/17 Actual Non-Financial FY 17/18 Budgeted Wheat Financial Dec-17 FOOD PRICE MONITORING WHOLESALE AND RETAIL PRICES AND TERMS OF TRADE International wholesale prices of rice and wheat International rice prices, as per FAO rice price index which is based on 16 rice export quotations, showed an increasing trend during the reporting quarter. It was 216 points in October 2017, up by 2 percent from the previous month, and continued rising up to 220 points in December The average rice price for the - 5 -
7 Nov-08 Nov-09 Nov-10 Nov-11 Nov-12 Nov-13 Nov-14 Nov-15 Nov-16 Nov-17 USD/ MT Jan'08 Oct'08 Jul'09 Apr,10 Jan'11 Oct'11 July'12 April'13 Jan'14 Oct'14 July'15 April'16 Jan'17 Oct'17 USD/MT reporting quarter was about 3 percent higher than in the previous quarter, and 17 percent higher yearon-year. The average coarse rice prices in Kolkata showed a similar increasing pattern during this period. It hit 417 USD/MT in December from 384 USD/MT in October 2017, 5 percent higher compared to the previous quarter and about 22 percent higher yearon-year. Prices of Thai 5% broken rice also increased significantly through the reporting quarter, though the average price was slightly lower compared to the 1,200 1, Wholesale Price of Rice Dhaka Division coarse rice Kolkata coarse rice Thai 5% broken rice Source: Bangladesh - DAM; Thailand - Index Mundi; Kolkata - Dept. of Consumer Affairs, India previous quarter. Satisfactory production and sustained adequate stock were said to have pushed up the international rice prices. Coarse rice prices in Dhaka division continued to increase since the beginning of the current FY till the previous quarter. Although they showed a slightly declining trend during the reporting quarter, the average price was about 15 percent higher year-on-year. Reduced supply and higher prices of paddy led to a rise in the coarse rice price in the local markets (newspaper sources). Bangladesh is a net importer of wheat and international prices heavily influence the price in the domestic market. The wholesale price of hard red winter wheat in the Gulf of Mexico increased during the reporting quarter, though slightly reduced compared to the previous quarter. It hit 184 USD/MT in December The quarterly average price was 21 percent higher year-on-year. Reduced wheat production around the globe in the last season contributed to the recent upward trend of international wheat prices Wholesale Price of Wheat Gulf of Mexico (No-1 Hard Red Winter Wheat) Source: Bangladesh-DAM; Gulf of Mexico-IndexMundi.com Bangladesh The national average wholesale price of imported white wheat hit 256 USD/MT in the first month of the current FY- about 54 USD/MT more compared to the price in the Gulf of Mexico. It had continued growing during the previous quarter and reached 287 USD/MT in October However, the price decreased marginally during the reporting quarter to 279 USD/MT in December The wheat price during this period was 5 percent higher year-on-year
8 % Change Retail prices for essential food commodities The national average retail prices of coarse rice started to decline in the beginning of the reporting quarter after reaching record highs during the previous quarter following flood-induced losses in the main Boro crop coupled with reduced production and imports in The rice price was about 2-4 Tk/kg less in October 2017 as compared to the previous month hitting Tk/kg with continued downward drift till November 2017 at 40.4 Tk/kg. The Government put considerable efforts including an increased import of rice to stabilize market prices. Rice prices however, slightly rose again in December 2017 and hit 40.6 Tk/kg. Average retail prices during the reporting quarter was about 19 percent higher year-on-year and 22 percent higher than during the high food price year of National average prices of wholemeal wheat flour (atta) on the other hand, showed a stable pattern during the reporting quarter at around 32 Tk/kg, yet 4 percent increased compared to the previous quarter. The price of palm oil was also stable, and that of lentils (masur) decreased during the reporting period. Average national prices of palm oil and lentils were 74 Tk/litre and 69 Tk/kg respectively in December The quarterly average price of lentils decreased by 17 percent compared to the previous quarter and about 30 percent yearon-year. Among the divisional sadar markets, average coarse rice price during the reporting quarter was recorded 43.4 Tk/kg in Dhaka sadar market, highest in history. Average prices were however, lowest in Chittagong division (36.7 Tk/kg) among the divisional sadar markets. The prices of wheat in all the divisional sadar markets fluctuated between 32 to 35 Tk/kg during the reporting quarter. The quarterly average price in Khulna sadar was found to be the highest (35 Tk/kg), and that in Barisal sadar to be the lowest (32 Tk/kg) among the divisional sadar markets. Palm oil is the dominating edible oil in the country, accounting for around 64 percent of the market share among the three major edible oils (the other two being soybean oil and mustard oil). 90 percent of the edible oil requirement is imported. The quarterly average prices of palm oil in all the divisional sadar markets varied between 69.5 Tk/litre in Khulna sadar and 77.5 Tk/litre in Dhaka sadar % Change of Retail Prices (National Average) of Oct-Dec'17 compared to past 2008 (high Last Quarter Last Year Commodities food price Jul-Sep'17 Oct-Dec'16 peak periods) Coarse Rice Wheat Flour (atta) Palm Oil Lentil (masur) Retail prices of essential food commodities (Tk/kg); Dhaka Sadar Market Sep'17 Oct'17 Nov'17 Dec'17 Peak 2008 Coarse Rice Whole w heat flour Palm Oil Lentil (masur) Source: Department of Agricultural Marketing Change in Retail Price of Essential Commodities in Divisional Sadar Markets, Oct-Dec 2017 Compared to 2008 Peak Prices Rice Wheat Flour Edible Oil Source:DAM during the reporting period. For the average lentil prices in the divisional sadar markets, the highest price during the reporting quarter was recorded in Chittagong sadar market with 91 Tk/kg and the lowest in Sylhet sadar with 67 Tk/kg. About 80 percent of the lentil requirement is met by imports. Local production can meet the demand for only 2-3 months. Lentil - 7 -
9 Jan'15 May-15 Sep-15 Jan-16 May-16 Sep-16 Jan-17 May-17 Sep Taka/day Terms of Trade/Food purchasing capacity of agricultural day labourers The average agricultural wages for both male and female labourers continued to increase till August 2017 since it is the peak period for Aman rice harvesting and post-harvest processing. In addition, seedbed preparation for Boro rice and vegetable cultivation are major agricultural activities during this period. However, wage rates slightly fell back in September The year-on-year average daily wage for male labourers during the previous FY grew positively, the growth was about 10 percent in September The scenario was fairly similar for female labourers over the months of the FY 2016/17. Although the wage rate of female labourers was lower than that of their male counterparts, the year-on-year growth was about 13 percent in September However, the wage rate data for the reporting quarter was not available from the Bangladesh Bureau of Statistics (BBS). There continues to be a significant difference 430 between the agricultural daily Male Female Agricultural day labour wage (without food) wages of male and female 380 labourers. In September 2017, the average wage for a 330 female labourer was 279 Taka/day whereas for a male 280 labourer it was 359 Taka/day a difference of 80 Taka/day. 230 There were better work opportunities for agricultural 180 labourers during this period such as Aman harvesting and post-harvest processing. Source: BBS Thus the agricultural wages were also reasonably high through the period. However, the gap between male and female labourers still persists, which means that an increase in work opportunities/availability does not have any positive impact on the wage gap. Households depending on the income of female wage labourers are, therefore, highly disadvantaged and remain more impoverished Trend analysis of the agricultural wage data of male and female labourers in the past three years shows that on average, female labourers receive a wage that is 24 percent less than that of their male counterparts, resulting in a purchasing capacity difference of about 2.5 kg of rice per day. This has significant implications on the food security status of households dependent largely on the wage labour income of female members. The wage gap is higher in the southern divisions of Khulna and Barisal. The average male-female wage gap during July- September 2017 was highest at 92 Taka/day in Barisal division, and lowest at 71 Tk/day in Sylhet division. Bangladesh Rangpur Sylhet Chittagong Khulna Barisal Rajshahi Dhaka ToT difference vs wage gap between male and female agricultural day labour (Oct'14-Sep'17) Source: Wage-BBS, Rice price- DAM Daily Wage Gap (%) - 8 -
10 Jan Feb Mar Apr May June July Aug Sep Oct Nov Dec kg/day The Terms of Trade (ToT) of an agricultural day labourer s wage is an indicator of the quantity of essential food items that the household can buy with his/her daily income. Since rice is the staple food and constitutes the major share in the household food expenditures, rice purchasing capacity is an important indicator of the ToT. Wage data collected from BBS showed that the average ToT went up in July-August 2017 due to an increase in Rice purchasing capacity of male agricultural day labourers ( wage/rice price); National Average Source: Price data-dam, Wage data -BBS agricultural wages as compared to the previous month. It however, started decreasing in September and hit 8.2 kg/day. The average ToT during this month was also about 18 percent lower than in the same period last year. As mentioned earlier considerably higher rice prices and lower public stocks during the reporting quarter contributed to the downward ToT in this period -- for both male and female agricultural day labourers. SHOCKS FACED BY HOUSEHOLDS ROHINGYA REFUGEE INFLUX IMPACT IN COX S BAZAR SINCE AUGUST Situation Overview 2 Since 25 August 2017, Cox s Bazar district of Bangladesh has experienced a large influx of Rohingya refugees fleeing violence that erupted in Rakhine State in Myanmar. Four in five of the new arrivals are fully dependent on external assistance for their survival, while 19 percent can at least partially meet their own needs. The situation is only slightly better among the refugees who arrived prior to August Not only has the pace of new arrivals made this the fastest growing refugee crisis in the world, the concentration of refugees in Cox s Bazar is the highest in the world. Moreover, the area is surrounded by local communities with high poverty rates that have been largely impacted by the new influx. In response, the WFP Vulnerability Analysis and Mapping Unit (VAM) and the Food Security Sector (FSS) have jointly led the Refugee Influx Emergency Vulnerability Assessment (REVA) to better understand the priority needs of the displaced Rohingya and host communities. The objectives were to assess how many people are food insecure and socio-economically vulnerable, what are their characteristics, and what are the actions required to improve their lives and livelihoods. The assessment covered new arrivals since 25 August 2017, unregistered refugees that arrived prior to 25 August 2017, officially registered refugees, as well as local residents in host communities. Registered camps, makeshift camps, new extensions, new settlements and host communities across Ukhia and Teknaf sub-districts were covered in the assessment. A total of 2,046 households were interviewed, including local resident households in host communities. Impact of Rohingya Refugee Influx on food security: The REVA summarizes an overview of the affected population in view of food consumption and food related coping strategies. Among all refugees and local residents surveyed, approximately 70 percent had an acceptable diet. Female headed households in the host communities had significantly higher prevalence of unacceptable food consumption (38 percent) compared to male-headed households (27 percent). 2 REVA Summary Report:
11 Refugee households who are receiving food assistance fare much better than those not assisted. Among the non-assisted new arrivals, 54 percent had a poor or borderline diet, meaning that they were eating less than the minimum required to live a healthy life. Dietary diversity was low for both the refugees and host communities, only reaching three to four food groups per day; access to meat, fish and eggs was extremely limited while fruits and dairy consumption was almost non-existent. Many families were changing their consumption behaviors in order to compensate for food shortfalls. Overall, 7 in 10 households were forced to adopt one or more food-related coping strategies. The prevalence was as high among the host communities as among the refugees. Host communities were impacted by higher food prices and increased competition over jobs which were reported as major constraints by 44 percent and 16 percent of the local resident households respectively. Overall, nearly every second household relied on less preferred food and every fourth reduced their portion size. Adults restricting their consumption was also common, more common among female family members compared to male members. Impact of Rohingya Refugee Influx on livelihood activities: The displacement had a major impact on the livelihood activities that households were engaged in. Compared to all other groups, the new arrivals are largely dependent on external support from both formal and informal sources. The host communities were facing increased competition and pressure on wages in the casual labour market, the most important income source for them, due to increased labour force availability. Roughly 12 percent of the new arrivals reported to sell some parts of their ration in order to meet other basic needs; mainly to buy other food items not covered in the basket (mostly condiments), firewood, and to cover health related costs. While only 2 percent mentioned remittances as their main income source. A clear differentiation was observed across gender lines. Overall, women were less involved in incomegenerating activities compared to men and tended to engage more in petty trade and paid domestic labour as part of coping strategies which were potentially associated with protection risks. Households depending on formal or informal assistance, begging, spending their savings, and relying on paid domestic work as their main income source are amongst the groups most vulnerable to food insecurity. Way Forward: The REVA analysis recommended a number of key action points to address the immediate and longer-terms needs. Food assistance has been playing a crucial role in ensuring food access among refugees who have limited access to livelihoods. Transitioning from food rations to food vouchers or cash, where families have the choiceamong food items, would further strengthen households capacity to access high quality food. However, food assistance alone is not sufficient to ensure food security and nutrition of refugees in the short, medium, to longer-term. Self-reliance and livelihood support programmes should be scaled-up immediately to help refugees and host communities respectively, to reduce their economic vulnerability. Nutrition prevention and treatment programmes targeting the most vulnerable groups should be expanded. Important investments must be made to ensure sufficient access to clean water and sanitation facilities. Increased distribution of non-food items, especially cooking fuel, would immediately reduce the sale of food assistance and the exposure of children and adult females to protection risks. FOOD SECURITY OUTLOOK FOOD GRAIN PRODUCTION, IMPORT, UTILIZATION AND PRICE Global The Food Price Index (consisting of average food price indices of five commodity groups - cereals, dairy products, oil, sugar and meat) reported by the Food and Agriculture Organization (FAO) rose slightly in September 2017 as compared to the previous month on the back of a sharp increase in the global prices of vegetable oil and dairy products. It however, started to decrease during the reporting quarter and hit 169 points in December The average price index of major food commodities in 2017 calendar year was
12 points, about 8 percent higher than that of the previous year. The average index was 174 points during the reporting period which was about 3 percent less than the previous quarter. The FAO Cereal Price Index fell marginally in September 2017, then rose in the following months of the reporting quarter, and hit points in December The quarterly average was 153 points, slightly lower than the previous quarter. The cereal prices followed an upward trend during the 2017 calendar year, which was 5 percent higher than in the previous year, yet 58 percent down from their 2011 peak. Among the major cereals, wheat prices went down mostly on the back of large exportable supplies from the EU and the Russian Federation and increased competition among exporters. By contrast, maize prices increased slightly in the US, although those from South America were weighed down by large supplies. FAO has forecast the world cereal production for 2016/17 at 2.6 billion MT, marginally surpassing the 2016 peak. Total production of coarse grains was set to reach a new record, with most of the expansion taking place in South America and Southern Africa. However, wheat production was forecast to decline slightly from last year, mostly on the back of a lower harvest in the United States. Global rice production in 2017 was expected to remain broadly stable. World cereal utilization in 2017/18 was set to expand by 1 percent from the previous year. Overall, food consumption of cereals was forecast to grow by 1.3 percent and feed use by 0.4 percent, while industrial utilization was projected to rise by 1.2 percent. Based on the latest forecasts for cereal production and utilization, world cereal stocks by the close of seasons in 2018 were set to reach a new record level. The increase in wheat and rice stocks largely reflects an anticipated accumulation of stocks in China, whereas for coarse grains, the expansion reflects higher end-of-season maize stocks in South America and the United States. Bangladesh Rice prices during the 1 st half of the current FY followed a different pattern from what was observed in the past few years. Although exhibiting a downward trend with fluctuation, market prices in this period were much higher than normal prices of past years. The wholesale rice prices started to increase steadily from the beginning of the FY 2017/18, yet, started decreasing during the reporting quarter. The Government, through its price monitoring model to forecast domestic foodgrain prices, has estimated the wholesale prices of coarse rice for the upcoming quarter to move downward. Stability in domestic production and stock of foodgrain had triggered the downward drift of the wholesale prices. Wheat prices in the current FY followed a somewhat different pattern than what was observed over the last four years. Prices rose sharply in September, but continued to grow till October The wholesale wheat prices were however, stable during the reporting quarter and were forecast by the Government to further decline during the upcoming quarter. For the agricultural cycle of July 2017 to June 2018, the United States Department of Agriculture (USDA) in its Annual Update of Grain and Feed for Bangladesh raised the forecast for wheat production by about 2 percent on expectations of low international wheat prices and new demands. Imports constitute 70 percent of Bangladesh s total wheat consumption and strong global production and high global exportable supplies keep international prices low
13 Reference: Bangladesh Bank, Central Bank of Bangladesh, Bangladesh Bureau of Statistics, Bangladesh Meteorological Department, Department of Agricultural Marketing/DAM, Ministry of Agriculture, FAO Food Price Index, Food Planning and Monitoring Unit (FPMU), Ministry of Food, Food Situation Report 111, Index Mundi Website, India Department of Consumer Affairs, Ministry of Consumer Affairs, Food and Public Distribution, Ministry of Food, The Daily Star: The Daily Star: The Daily Star: REVA Summary Report: The World Bank -- BANGLADESH DEVELOPMENT UPDATE The Bangladesh Food Security Monitoring Bulletin is prepared by the Vulnerability Analysis and Mapping (VAM) unit of the World Food Programme (WFP) and published by the WFP Bangladesh Country Office. It is published four times a year and focuses on developments affecting food security in Bangladesh. This issue covers the quarter of Oct-Dec The previous BFSM bulletins are available on the internet at the following URL addresses: The bulletins can be received by subscription upon request. For suggestions or queries, please contact Ms Arifeen Akter, Sr. Programme Officer, VAM Unit, WFP Bangladesh at arifeen.akter@wfp.org
14 - 13 -
15 - 14 -