Emerging Applications of RS & GIS in Agriculture
|
|
|
- Donald Sutton
- 5 years ago
- Views:
Transcription
1 Emerging Applications of RS & GIS in Agriculture Crop intensification (National Food Security Mission) Horticulture (National Horticulture Mission) High value crops (Commerce) Fibre Crop Information System Ministry of Textiles Expansion of rabi crop area with short duration pulses Mapping and inventory of post-kharif rice fallow lands in 6 states Advisory on the suitability of these lands for short duration pulse crops Expansion and management of Horticulture crops Satellite based mapping and inventory of hort. crops Site suitability assessment for expansion Inventory and evaluation of high value crops Mapping, inventory and economic evaluation of Menthol mint Development of a centralised Decision Support System for monitoring and assessment of fibre crops prospect


2 nrsc Crop Intensification Mapping Post kharif -rice fallows & Assessing their Suitability for rabipulses using Geospatial Techniques Funding support Department of Agriculture, Cooperation and Farmers Welfare, Govt. of India National Remote Sensing Centre, ISRO, Hyderabad and Mahalanobis National Crop Forecast Centre Department of Agriculture, Cooperation and Farmers Welfare New Delhi
3 Methodology frame work Kharif rice fallow layer Delineation of Post Kharif-rice fallow lands Suitability analysis for Rabi pulses cultivation in post kharif-rice fallow lands Input 1 RISAT derived Kharif rice layer Intersection Input 2 LANDSAT OLI derived Rabi fallow layer Static input data Soil depth and AWC Drainage network Surface Water body Slope Dynamic input data R2-LISS III/LANDSAT OLI NDVI, LSWI Rabi crop area Temperature Post-Kharif rice fallow layer ( ) Validation with secondary data and field data Fine-tuning/ adjustments Final map and statistics Descriptive spatial products (weather and soil parameters in post-rice fallows) Intersection Decision rules Suitable land for rabi pulses Maps and Statistics
 B. Rabi Cropped Area C.")
 157993 District Kharif Rice + Rabi Crop Post Kharif Rice Fallow Areas Post")
4 Crop intensification Post kharif rice fallow lands for growing pulse crops in rabi season Satellite data - RISAT 1, LISS III A. Kharif Rice (2015) B. Rabi Cropped Area C. Kharif Rice + Rabi Crop Post Kharif Rice Fallow Areas District Kharif Rice Bhadrak Kendraparha Total Kharif Rice(ha) District Rabi Cropped Area Bhadrak Kendraparha Total Kharif Rice(ha) District Kharif Rice + Rabi Crop Post Kharif Rice Fallow Areas Post kharif rice fallows as % of kharif rice area Bhadrak % Kendraparha % Total (ha)

 Area")
5 Multi-criteria approach for suitability assessment for rabi pulses IMD AWS LANDSAT OLI NBSSLUP Soil Layer (1: ) Final product Mean daily Air Temperature AWC Soil Depth Mean monthly Air Temperature LSWI PAWC Kharif rice and rabi fallow lands Criteria: Mean monthly air temp 24 LSWI first fortnight Jan LSWI second fortnight Jan PAWC 75 Area favourable for rabi crop sowing Kh rice fallow area suitable for rabi crop growing Districts Estimated kharif rice-fallow (ha) Area favourable for rabi crop sowing (ha) % area of kharif rice fallow Bhadrak Kendrapada

6 Kharif Rice Area (Chhattisgarh): Total Kharif Rice area (Chhattisgarh): Lakh ha Kharif Rice Area District (lakh ha) Balod 1.55 Baloda Bazar 2.19 Balrampur 0.77 Bastar 0.97 Bemetara 1.63 Bijapur 0.45 Bilaspur 1.98 Dakshin Bastar Dantewada 0.56 Dhamtari 1.11 Durg 0.92 Gariyaband 0.84 Janjgir - Champa 2.71 Jashpur 1.70 Kabeerdham 0.82 Kondagaon 0.92 Korba 0.96 Koriya 0.64 Mahasamund 2.26 Mungeli 1.11 Narayanpur 0.17 Raigarh 2.18 Raipur 1.57 Rajnandgaon 2.79 Sukma 0.49 Surajpur 1.21 Surguja 1.15 Uttar Bastar Kanker

7 Temporal NDVI images (Rabi season, ) of Chhattisgarh Nov 2015 Dec 2015 Jan 2016 Feb Nov, Mar 2016 Apr 2016
 1 Balod 0.60 2 Baloda Bazar 0.45 3 Balrampur 0.")

8 Rabi Crop Area (Chhattisgarh): Total Rabi crop area (Chhattisgarh): Lakh ha Rabi Crop area Harvested by Feb Harvested by Mar Harvested by May District Name Rabi Crop Area (Lakh ha) 1 Balod Baloda Bazar Balrampur Bastar Bemetara Bijapur Bilaspur 0.53 Dakshin Bastar Dantewada 9 Dhamtari Durg Gariyaband Janjgir - Champa Jashpur Kabeerdham Kondagaon Korba Koriya Mahasamund Mungeli Narayanpur Raigarh Raipur Rajnandgaon Sukma Surajpur Surguja 0.27 Uttar Bastar Kanker Total Area 13.07
 Area (Lakh ha) % Kharif rice area left Fallow District Name 1 Balod 1.05 68.06 2 Baloda Bazar 1.77 80.86 3 Balrampur 0.59 75.90 4 Bastar 0.83 86.10 5 Bemetara 0.")
9 Post Kharif Rice Fallow (Chhattisgarh): Total Post Kharif Rice Fallow Area (Chhattisgarh): Lakh ha (74% of Kharif Rice Area) Area (Lakh ha) % Kharif rice area left Fallow District Name 1 Balod Baloda Bazar Balrampur Bastar Bemetara Bijapur Bilaspur Dakshin Bastar Dantewada Dhamtari Durg Gariyaband Janjgir - Champa Jashpur Kabeerdham Kondagaon Korba Koriya Mahasamund Mungeli Narayanpur Raigarh Raipur Rajnandgaon Sukma Surajpur Surguja Uttar Bastar Kanker Total Area
 Large( 0.35) Moderate Large Moderate Moderate (0.25-0.35) Moderate (0.25-0.35) Moderate Small ( 0.25) Low Small ( 0.")
10 Priority Tehsil level distribution of rice and its fallow area to decide priority for Crop Intensification Scope of Intensificatio n Kharif rice area (lakh ha) Post rice fallow area (lakh ha) High Large ( 0.35) Large( 0.35) Moderate Large Moderate Moderate ( ) Moderate ( ) Moderate Small ( 0.25) Low Small ( 0.25) Small Very Low Large Small Tehsils with high scope of Intensification in Chhattisgarh District Thesils Kharif rice area (lakh ha) Post Kharif rice fallow area (lakh ha) Balod Gunderdehi Baloda Bazar Baloda Bazar Baloda Bazar Kasdol Bilaspur Masturi Janjgir - Champa Nawagarh Janjgir - Champa Nawagarh Mahasamund Pithora Mahasamund Bagbahra Raipur Arang Raipur Tilda Total area
11 Multi-criteria approach for suitability Analysis IMD AWS LANDSAT OLI NBSSLUP Soil Layer (1: ) SRTM DEM Mean daily Air Temperature AWC Soil Depth Proximity to Drainage Network Mean monthly Air Temperature LSWI PAWC Slope (%) Post Kharif rice-rabi fallow lands Proximity to Surface water bodies Criteria: Mean monthly air temp 18 o C LSWI second fortnight Dec LSWI first fortnight Jan PAWC 75 Slope 10 % Drainage network 2 km Surface water bodies 0.5 km Area favourable for pulses in rabi season
12 Post Rice Fallow Lands Suitable for Crops (Chhattisgarh): Total Post Kharif Rice Fallow Area suitable for pulses: 7.62 Lakh ha (~29%) Area Suitable area District Name (Lakh ha) (%) 1 Balod Baloda_Bazar Balrampur Bastar Bemetara Bijapur Bilaspur Dakshin_Bastar Dantewada Dhamtari Durg Gariyaband Janjgir Jashpur Kabeerdham Kondagaon Korba Koriya Mahasamund Mungeli Narayanpur Raigarh Raipur Rajnandgao Sukma Surajpur Surguja Uttar_bastar kanker


 Mango Oil palm Carto-1 PAN")
13 Coordinated programme on Horticulture Assessment & Management using Geoinformatics (CHAMAN) Methodology Mango, Citrus Hybrid approach for classification using object oriented and limited visual interpretation techniques on single date datasets from LISS-IV and PAN Banana Decision tree classifier with multi-date data from LISS-IV and LISS-III Field information collected through mobile app (over 1000 points collected for various crops) Coverage 13 selected districts of Telangana and Andhra Pradesh Crop District Status Telangana Mango Khammam Completed Citrus Nalgonda Completed Andhra Pradesh Krishna Completed Mango East Godavari Completed West Godavari Completed Vizianagaram In progress Citrus Nellore Completed Anantapur In progress Kadapa Completed Anantapur Completed Banana East Godavari Completed West Godavari Completed Kurnool Completed Different crops viewed with various datasets (Carto-1 PAN, LISS-IV and LISS-IV + PAN merged) Mango Oil palm Carto-1 PAN Resourcesat-2 LISS-IV PAN & LISS-IV merged

14 High Resolution Satellite Image showing Different Horticulture Crops LISS-IV + PAN merged

15 Methodology for Classification
16 Parameters collected through CHAMAN app Sl. Parameter Information 1 Location In terms of lat/long taken through the GPS in mobile phone 2 Field photos Two photos of the field 3 Village name Name of the village 4 Crop name Name of the crop 5 Crop variety Crop variety 6 Fruit bearing age Young/old 7 Orchard type Mixed or pure 8 Spacing Spacing between the crops/plants 9 Water source Weather irrigated or rain-fed 10 Inter-crop Name of the crop grown along with crop of interest 11 Soil type Red, black or loamy 12 Management Good, average or poor 13 Stress, if any Water, pest or any other 14 Yield Information from farmer 15 Any other Additional information not included in the above


17 Field data collected for Citrus (Acid Lime) in Nellore district, A.P Acid lime Acid lime Acid lime Acid lime


18 Delineation of Mango Plantations with High Resolution Satellite Data 1 Age-wise identification of mango plantations Nuzvid mandal Krishna district Andhra Pradesh 3 2 LISS- PAN Merged data Over 10 yrs age Less than 5 yrs age 5-10 yrs age Area classified as mango plantations ha


19 Crop Mapping and Suitability Assessment Mapping Banana Plantations in Anantapur district, A.P Suitability Map for Mango Plantation Nuzvid Mandal, A.P Banana 9781 ha Citrus plantations in Nalgonda district, Telangana Categories Suitable Area for mango (ha) Actual area under mango (ha) Highly suitable Moderately suitable Acid Lime Not/Less Suitable
 - Land Suitability Analysis for Mango Plantation")

 Actual area under mango (ha) 5019 820 8343")
20 Coordinated programme on Horticulture Assessment & Management using Geoinformatics (CHAMAN) - Land Suitability Analysis for Mango Plantation Soil Productivity Map Soil Depth Map Water Table Depth Map Land Use and Land Cover Map Suitability Map for Mango Plantation, Nuzvid Mandal, Andhra Pradesh Categories Highly suitable Moderately suitable Not/Less Suitable Suitable Area for mango (ha) Actual area under mango (ha)

")

 Oil")
21 Mapping and Inventory of Multiple Horticulture Crops Krishna District, Andhra Pradesh ( ) LISS-IV, PAN merged image Mango Oil Palm Satellite image Crop Map Mango Oil Palm Mango (55,835 ha) Oil Palm (6,542 ha)
 cultivation R2 LISS-III data 22-May-2016 Pilot study for Spices Board, Ministry of Commerce Classification using multi-date images Mint")
 Mean Menthol Oil estimate (Kg ha -1 ) Total Menthol oil production estimate (tons) 18.59 1587.74 111.")

22 Mapping, inventory and evaluation of Menthol Mint crop (Mentha arvensis L.) cultivation R2 LISS-III data 22-May-2016 Pilot study for Spices Board, Ministry of Commerce Classification using multi-date images Mint crop distribution Mobile Apps (a) Crop recording (b) Biomass data recording Mean Biomass estimate (t ha -1 ) Total Biomass production estimate (000' tonnes) Mean Menthol Oil estimate (Kg ha -1 ) Total Menthol oil production estimate (tons) ,526 Net Return to farmer: 52,546 Rs./ha Benefit-cost ratio: 2.05 Value of menthol oil per Cu.M of water: Rs Value of employment: Rs. 128 Crores (for entire district) NDVI Crop status Mean Biomass Mint crop Classes group estimate (t ha -1 ) area (ha) Poor 9.6 5,609 Medium ,610 Good ,412 Very good ,755 Capacity building to Spices Board 85386

 > 0.50 0.25 0.50 < 0.")
23 Soil characteristics in Menthol Mint growing area Mint Biomass Map Coarse Fine Medium Soil Texture Soil Org. Carbon (%) Mint crop Suitability Parameters Suitability Parameters Highly suitable class Moderately suitable class Least suitable class Soil texture Medium Fine Coarse Soil OC (%) > < 0.25 Soil Depth (cm) > < 15 Soil depth Water Table depth Water Table depth (m) 4-6 > 6 < 3

24 Sentinel 2 FCC Date: 29 May 2016

25 Multi resolution Segmentation Object NDVI Range:
26 NDVI based Classification
")
27 Texture based Classification GLCM Homogenity (All directions) Range:


28 Scaled Reflectance Low Biomass Medium Biomass High Biomass B1 B2 B3 B4 B5 B6 B7 B8 B8a B9 B10 B11 B12 Sentinel-2 Bands
29 Correlation matrix of Sentinel 2 Bands and Biomass Biomas s Band 1 Band 2 Band3 Band4 Band5 Band6 Band7 Band8 Biomas s 1.00 Band Band Band Band Band Band Band Band Band8 a Band9 Band10Band11Band12 Band8a Band Band Band Band
30 Predicted Biomass (t ha -1 ) Predicted Biomass (t ha -1 ) Predicted Biomass (t ha -1 ) Predicted Biomass (t ha -1 ) R2 = 0.85 RSME = Observed Biomass (t ha -1 ) MLR R2 = 0.58 RSME = Observed Biomass (t ha -1 ) PCR R2 = 0.72 RSME = Observed Biomass (t ha -1 ) PLSR R2 = 0.61 RSME = Observed Biomass (t ha -1 ) SVR Vegetation Indices Correlation with Biomass NDVI NDVI NDRE1a 0.63 NDRE1b 0.37 NDRE1c 0.28 NDRE2a 0.57 NDRE2b 0.50 NDRE2c 0.18 MCARI MCARI RE-NDVI 0.54 Mod-RE-NDVI 0.54 Mod RE SR 0.53 MTVI MTVI TCARI 0.61 GNDVI GNDVI IRECI 0.66 OSAVI 0.66 TCARI/OSAVI 0.57 A(B6) 0.47 A(B7) 0.48 A(B8) 0.61 area area area3 0.59


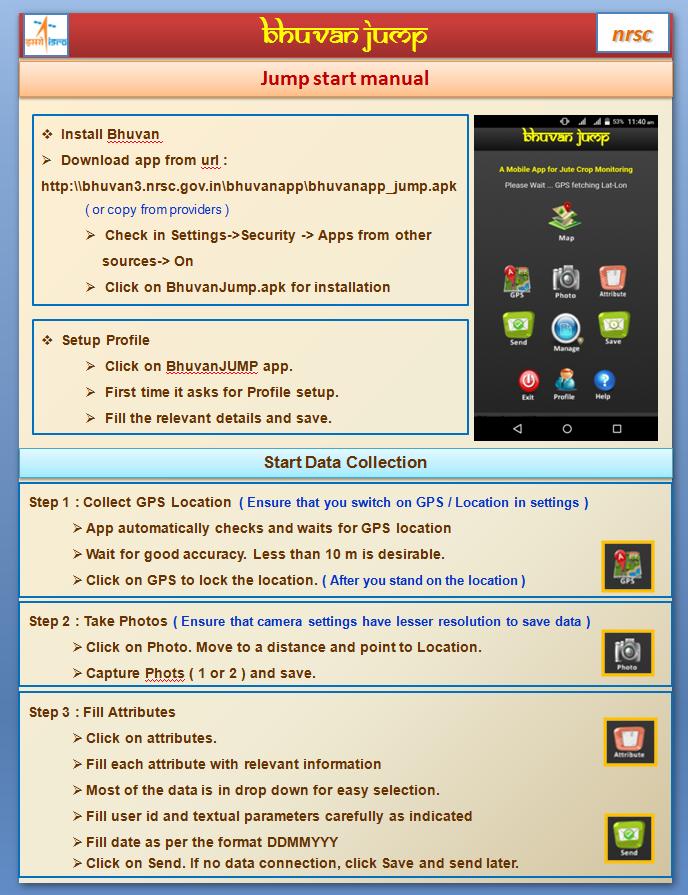
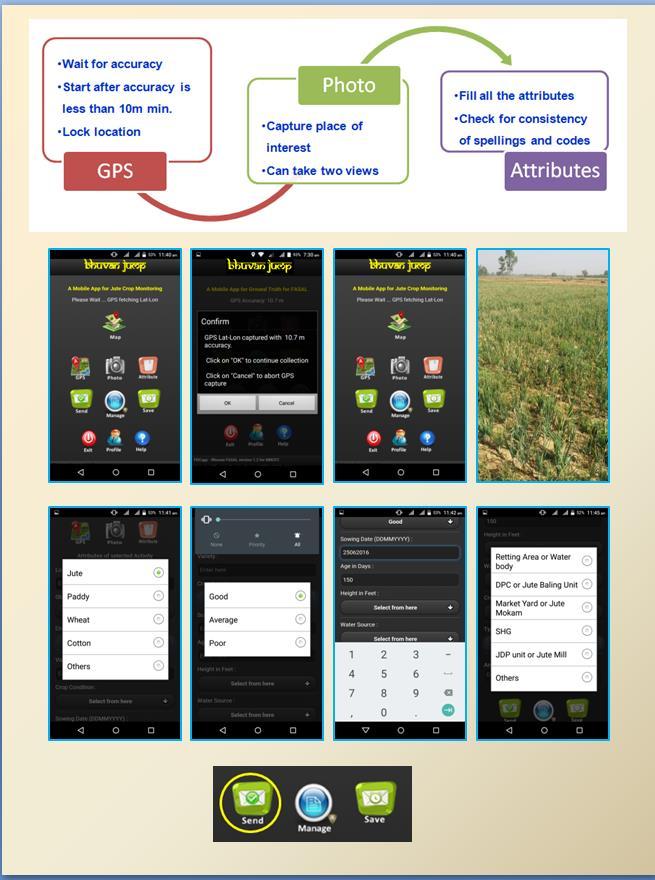
31 Fiber Crop Information system: Indian Space Research Organization, Dept of Space Mahalanobis National Crop Forecasting Centre, Min of Agriculture Cotton Corportion of India, Ministry of Textile Jute Corporation of India, Ministry of Textile National Jute Board, Ministry of Textile
32

 cover")


33 Cotton crop information system 1. Achievements till now: A pilot study has been conducted during along with Cotton corporation of India (CCI) covering nine states i.e. Andhra Pradesh, Gujarat, Haryana, Maharashtra, Karnataka, Telangana, Madhya Pradesh, Rajasthan, Punjab. A mobile app (BHUVAN RUI) tailored made for cotton crop was developed and distributed to the grounds staff of CCI Workshops were organized on the collection of field observations using mobile apps Nearly field data points were collected across the nine states. These data points were hosted in BHUVAN for visualization and further analyzed to assess the cotton crop prospect Satellite Andhra based Pradesh cotton crop map Gujarat were prepared for selected Haryana districts The district wise area and pre-harvest yield of the cotton crop was estimated (MNCFC) 2634 Karnataka 116 Telangana Madhya Pradesh 185 Rajasthan Maharashtra Punjab Spatial distribution of the mobile app based field data point over different cotton growing states
 Yavatmal district of Maharashtra Disease No Stress Pest Water Stress 100 29% 50 71% 0 Irrigated Rainfed Spatial distribution of the field")
 2016 Yield (kg/ha) Production ( 000 bales)")
 Cotton crop condition condition was found to be good during September to November months, occurrence of disease was reported")
34 Sep FN 1 Sep FN 2 Oct FN 1 Oct FN 2 Nov FN 1 Nov FN 2 Dec FN 1 Dec FN 2 Jan FN 1 Jan FN 2 % of observations Sep FN 1 Sep FN 2 Oct FN 1 Oct FN 2 Nov FN 1 Nov FN 2 Dec FN 1 Dec FN 2 Jan FN 1 Jan FN 2 % of observations Data analytics of BHUVAN RUI (Cotton crop) Yavatmal district of Maharashtra Disease No Stress Pest Water Stress % 50 71% 0 Irrigated Rainfed Spatial distribution of the field data collected over Yavatmal dist Satellite based Cotton area,yavatmal dist Flowering Squaring Boll Formation Boll Bursting Picking Senescence Pre-harvest cotton production estimate dated 14 Dec, District Acreage ( 000 ha) 2016 Yield (kg/ha) Production ( 000 bales) Yavatmal Total 1432 data points collected during Sep-16 to Jan-2017 over Yavatmal district, sowing starts in July. Cotton crop over yavatmal dist was found to be predominately rainfed (71%) Cotton crop condition condition was found to be good during September to November months, occurrence of disease was reported in the second fortnight of December and January months. September month was dominated by flowering and squaring stage Maximum boll formation was found in the month of October The picking starts in the first fortnight of November and continued till


35 Cotton crop information system No of observations Different condition of cotton crop captured using mobile app over Maharashtra district Healthy Cotton crop Dist: Nandurbar Disease Cotton crop Dist: Nagpur Pest Infestation Cotton crop Dist: Nagpur Water logged Cotton crop Dist: Chandrapur Drought affected Cotton crop Dist: Jalgaon Disease No Stress 0


36 On line Data analytics on BHUVAN RUI (cotton crop) Online data analytics: FARM Conceptualized to cater the needs of user departments towards informed decision making Online reanalysis of the field data points for meaningful information. Reporting district wise for the user defined time window of crop season. Showcasing the spatial distribution of the data point with administrative boundaries. Tabular representation of the temporal progression of selected crop parameters. Graphical representation of progression of the selected crop parameters A prototype of FARM was made for BHUVAN RUI and can be extended for other apps also. Future plan: Presently operational for BHUVAN RUI, to be extend to other mobile app based field data Inclusion of other important crop parameters like crop sowing, crop stage, crop stress etc. Incorporation of the satellite based vegetation indices and weather parameters.

 10 8 2 11 12 0 0 0 0 0 40 20 5 0 0 Spatial")


37 1st Wk Jun 2nd Wk Jun 3rd Wk Jun 4th Wk Jun 1st Wk Jul 2nd Wk Jul 3rd Wk Jul 4th Wk Jul 1st Wk Aug 2nd Wk Aug % obs of jute condition 1st Wk Jun 2nd Wk Jun 3rd Wk Jun 4th Wk Jun 1st Wk Jul 2nd Wk Jul 3rd Wk Jul 4th Wk Jul 1st Wk Aug 2nd Wk Aug 1st Wk Jun 2nd Wk Jun 3rd Wk Jun 4th Wk Jun 1st Wk Jul 2nd Wk Jul 3rd Wk Jul 4th Wk Jul 1st Wk Aug 2nd Wk Aug Age (days) Height (feet) Murshidabad district of West Bengal 100 Good Poor Average Irrigated Rainfed Modal Age Modal Height Data analytics on BHUVAN JUMP (Jute crop) Spatial distribution of the field data points collected over Murshidabad dist, Total 274 data points collected over Murshidabad district during Jun- Aug, Jute sowing starts in April. Jute crop was predominately irrigated, with more than 90% area under irrigation Majority of the jute crop fields were found to be in good condition. Occurrences of average crop condition were found in the 3 rd week of July. During the time of observation the crop age was found to increase from 60 days to 120 days The crop height was found to be nearly 12 feet at maturity. Jute area of Murshidabad was found to be thousand ha and production of 2336 bale dated 15 July, 2016


")

 Good= 3 (75%) Avg = 1 (25%) 33 50-65 4-8")
 Good= 27 (94%) Avg = 1 (3%) Poor = 1 (3%) 4 th")
38 Data analytics on BHUVAN JUMP (Jute crop) No of Observations Different Jute crop conditions were captured over Naogaon district of Assam Drought affected Jute crop Healthy Jute crop Water logged Jute crop 0 Normal Drought Water logged Jute crop prospect over Nagaon dist, Assam Satellite data based Jute crop map of Naogaon Dist Pre-harvest jute production estimate dated 15 July, 2016 District Acreage ( 000 ha) Yield (kg/ha) Production ( 000 bales)$ Time Period 1 st Wk of June 2 nd Wk of June 3 rd Wk of June Obs. Age (Days) Heigh t (feet) Irrigated Crop Condition (0%) Good= 3 (75%) Avg = 1 (25%) (0%) Good= 28 (85%) Avg= 3 (9%) Poor = 2 (6%) (0%) Good= 27 (94%) Avg = 1 (3%) Poor = 1 (3%) 4 th Wk (0%) Good= 95
39 Thank you